FOREX PRO Weekly, January 31-February 04, 2011

EUR/USD Daily Update, Tue 01, February 2011

Good morning,
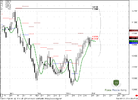
Looks like EUR turns in a way of DRPO and has held above pivot. I hope that you do not have any short positions yet, as we've discussed in research - "If market will move above pivot and hold there - don't be short".
So, for confirmation of daily DRPO we need second close below Green line on the daily chart, but before that I expect that market will take out the previous highs, because:

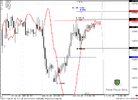
1. 0.618 Fib expansion target on hourly chart at 1.3760 - just above the previous highs
2. I do not see any "Sell" signals on hourly chart of EUR, but this could be H&S or Butterfly Sell, 3-drive sell - all these patterns assume reaching of 1.3760-1.3780 area
3. There is a MACDP failure pattern on hourly chart on EUR
4. I see nice Butterfly "Sell" on GBP 4-hour chart

So, I think that today we will have to look for possible Sell signals on EUR around 1.3760-1.3780 area. If signal will be clear, possibly we even can anticipate DRPO confirmation on daily chart, for better entry point.
 

Attachments

  • EUR_D_01_02_11.PNG
    EUR_D_01_02_11.PNG
    43.5 KB · Views: 168
  • EUR_1H_01_02_11.PNG
    EUR_1H_01_02_11.PNG
    46 KB · Views: 166
So the EUR/USD has bounced off of the 38.2% is that indicating a B&B buy? Now I assume we are waiting for a Double Repo to form or fail. Taking long profits below the last high, I am asking so I can confirm that I understand what I have read.
Thanks,
Josh

Josh, I recommend you buy and study Joe Dinapoli's book "Trading with Dinapoli Levels" to fully understand what Sive is talking about it. All the directional patterns like DRPO, B&B (bread and butter), H&S (head and shoulder), etc, are all described there.
 
Sive,

On the S&P Emini, we should be expecting a retracement up to the .618 of this last swing, right?
 
Sive,

On the S&P Emini, we should be expecting a retracement up to the .618 of this last swing, right?

Well, This will be perfect and it seems that market will give us this retracement. Besides, around 1285 area is a weekly pivot point. Placing stop just around 1292-1295 area gives outstanding risk/reward entry point. If even target will be around 1250 - 1225 points.
 
I have the book and I am re reading the D levels chapters right now. As you can see from my chart I would never have figured out the modified MACD that I have on there. I am starting to understand, it is a problem of experience in seeing the action. That was more of what my question was about. Real life example, what am I looking for. I think today's post covered it. DRPO is getting ready to happen as I type. Being a novice I am gonig to lose a few pips and wait for the confirmation close.

Can someone write the algorithm for the MACDP?
 
H1 3 drive sell?

Well, This will be perfect and it seems that market will give us this retracement. Besides, around 1285 area is a weekly pivot point. Placing stop just around 1292-1295 area gives outstanding risk/reward entry point. If even target will be around 1250 - 1225 points.

I do not understand what are you talking about. What is S&P Emini?

Anyway, do you see a 3 drive sell on H1 eurusd?

Thak you mr. Sive!
 
listen there was no sell signal on intraday! I lost money trying to anticipate it. I am starting to understand. Sive my question for the now is this: I drew the Fib Expansion from ABC the last three points on the daily and got 1.3880 as the 61.8% fib node from the most recent ABC. Obviously there was no confirmation on the 4 hour chart of the DRPO, myself I am going to wait this move out and get in on the drop below the 3x3 at the next point with a stop at a fib node. taking that hit wil be a risk vs. what was obviously reward on the last move above the 3x3 DMA.

Why do you not place more analysis on the combined Dinapoli signals such as the modified MACD and Stochastic as you do with just chart patterns and fib nodes? The Oscillator predictor showed on the daily, if you look at my chart, that is was not yet overbought. Again I am only asking because I want to bounce ideas off of someone who has much more experience then me.

Thank you for any explanation you can give.

Josh
 

Attachments

  • 2011-01-30-TOS_CHARTS.png
    2011-01-30-TOS_CHARTS.png
    103.7 KB · Views: 80
Why do you not place more analysis on the combined Dinapoli signals such as the modified MACD and Stochastic as you do with just chart patterns and fib nodes? The Oscillator predictor showed on the daily, if you look at my chart, that is was not yet overbought. Again I am only asking because I want to bounce ideas off of someone who has much more experience then me.

Josh

Hi Josh,
First, MT4 does not have exponential MACD and modified Stochastic.
Second, I don't need Stochastic, because I have MACD Predictor and I know in advance the price, when trend will change.
But, if you would like to discuss something with MACD/Stoch combination - let's do that. Just don't forget to attach charts.
 
Back
Top