Sive Morten
Special Consultant to the FPA
- Messages
- 18,644
Monthly
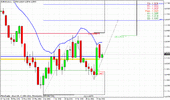
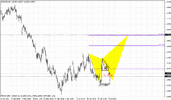
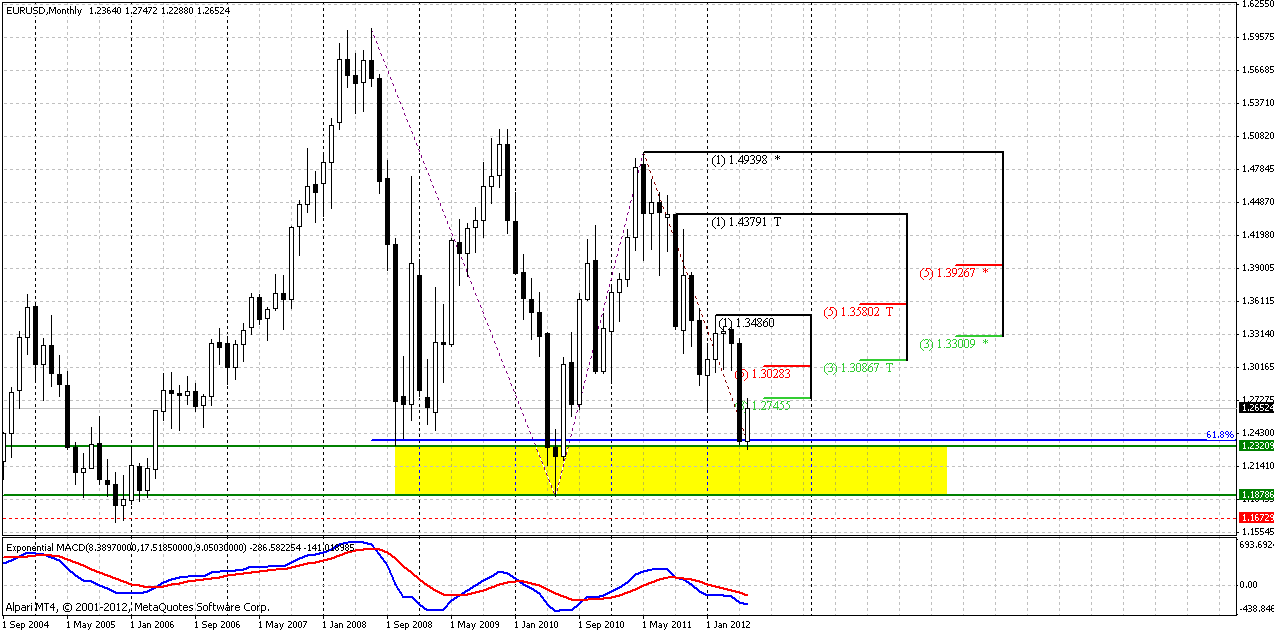
Monthly trend holds strongly bearish. Although chart almost equals to previous one – market closed just 20 pips higher, we’ve seen a lot of price action within the week. Actually situation in EU is so, that it is better to not marry any position and try to appoint nearest targets. I’m talking for those who trade on daily time frame. I’ve looked again on monthly chart and find out that we’ve missed important detail. Currently market stands not only on crucial support range – 1.19-1.23 that held EUR twice from collapse. This is also 0.618 target from huge AB-CD pattern. We could also tell that this is 0.88 Fib support from most recent swing, but it has minor importance.
From that perspective it seems possible retracement to 1.30 K-resistance monthly level. We’ve discussed this already on previous week and told that even such bounce, that could be solid from daily perspective, on monthly chart could become absolutely reasonable and moderate retracement, that still will not change overall bearish bias on monthly time frame.
The problem though, that currently we have some lack of confirmation that a) this move has started and b) that it will reach this level. From monthly stand point we have couple of conclusions – although trend and price action are bearish, market stands at support. May be we should investigate possibility to buy against previous lows, because if market will break it – it will mean downward continuation.
Weekly
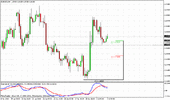
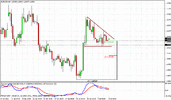
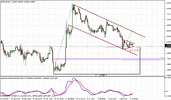
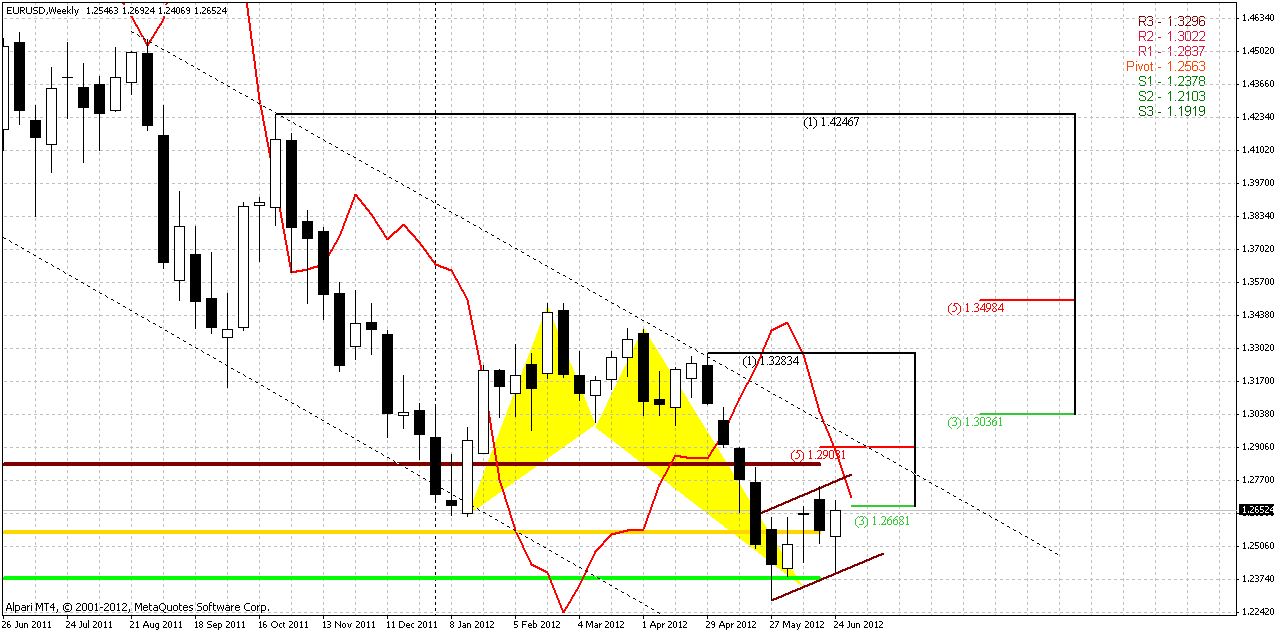
Weekly trend is bearish. In addition to monthly target, market has hit 1.27 target of butterfly pattern and weekly oversold, then it turned to upward retracement. Still, currently price holds below even first Fib resistance 1.2668. From weekly time perspective I do not want to buy and probably search the possibility to sell, since current price action is creating classical bear flag. Keeping in mind that market was at oversold and actually just shows sideway move tells that it rather heavy.
Looking at monthly pivot points for July we have MPP=1.2563, MPR1=1.2837, MPS1=1.2378. We know that when market stands in bear trend it often retraces to MPR1. That is very close to upper border of channel and weekly K-resistance.
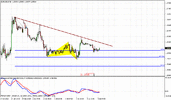
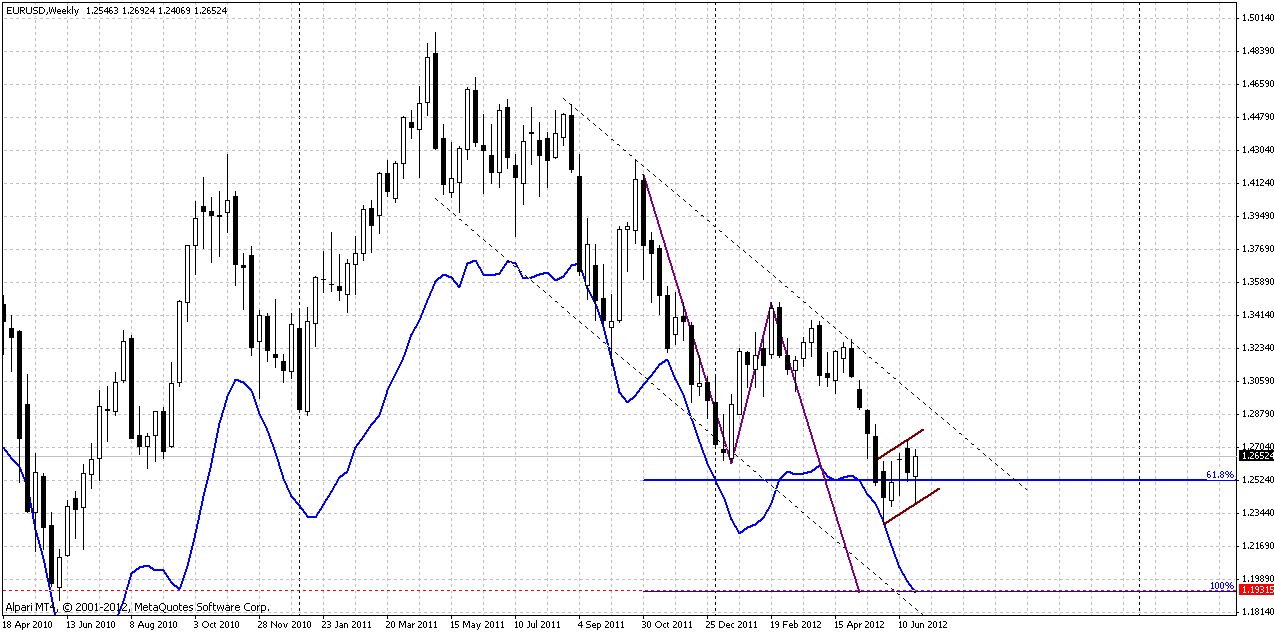
On second chart we see downward destination points. Our AB=CD pattern is finished fight at the lower border of monthly support zone. Also if we apply classical rule of flag trading – move after breakout should be equal to mast – this point also will be around 1.18-1.19 area. So, on weekly chart I do not want to buy and probably start to look for sell possibilities around MPR1 and K-resistance area, if I will be able to find any daily AB=CD to sell into.
Daily
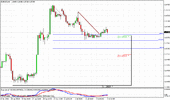
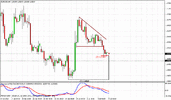
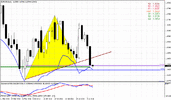
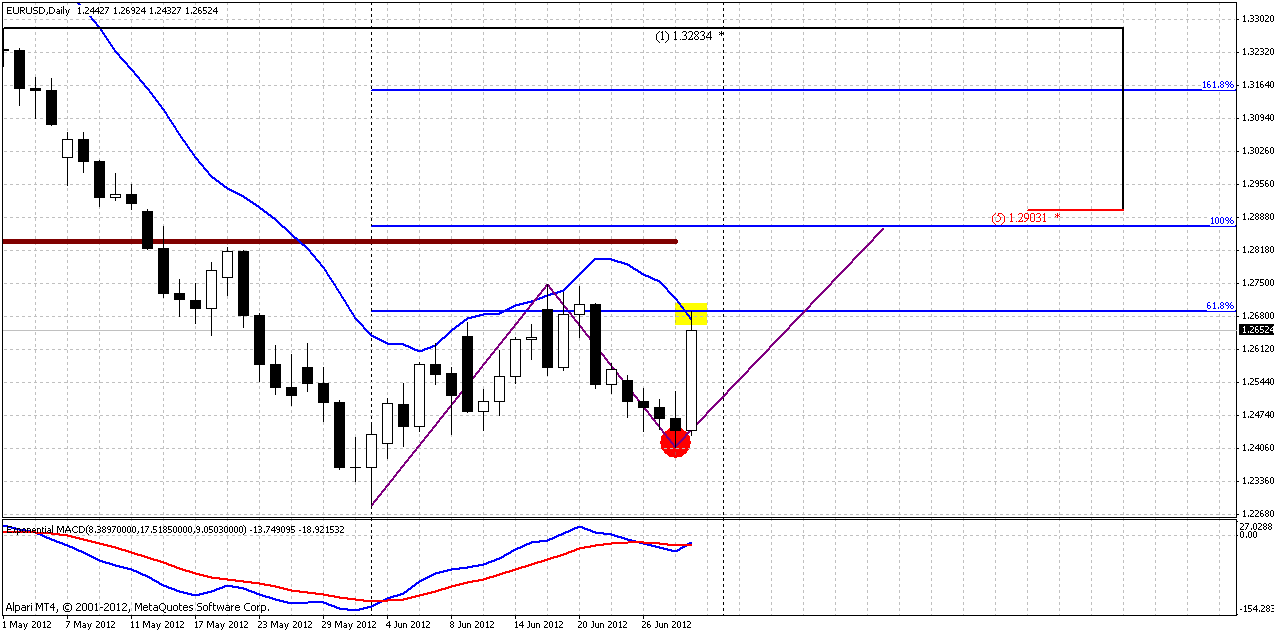
Daily chart mostly resolves our riddle. As you can see trend has turned bullish here again by solid upward candle. This give us some confidence to think that AB=CD is really could be possible. Market already has reached its 0.618 target and daily overbought.
So, I suppose that we could be buyers here against previous lows (red circle) at some pullback. The target of this AB=CD precisely at an area of MPR1 and lower border of K-resistance on weekly chart.
4-hour
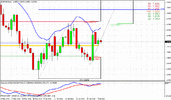
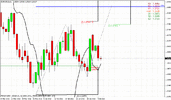
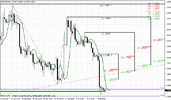
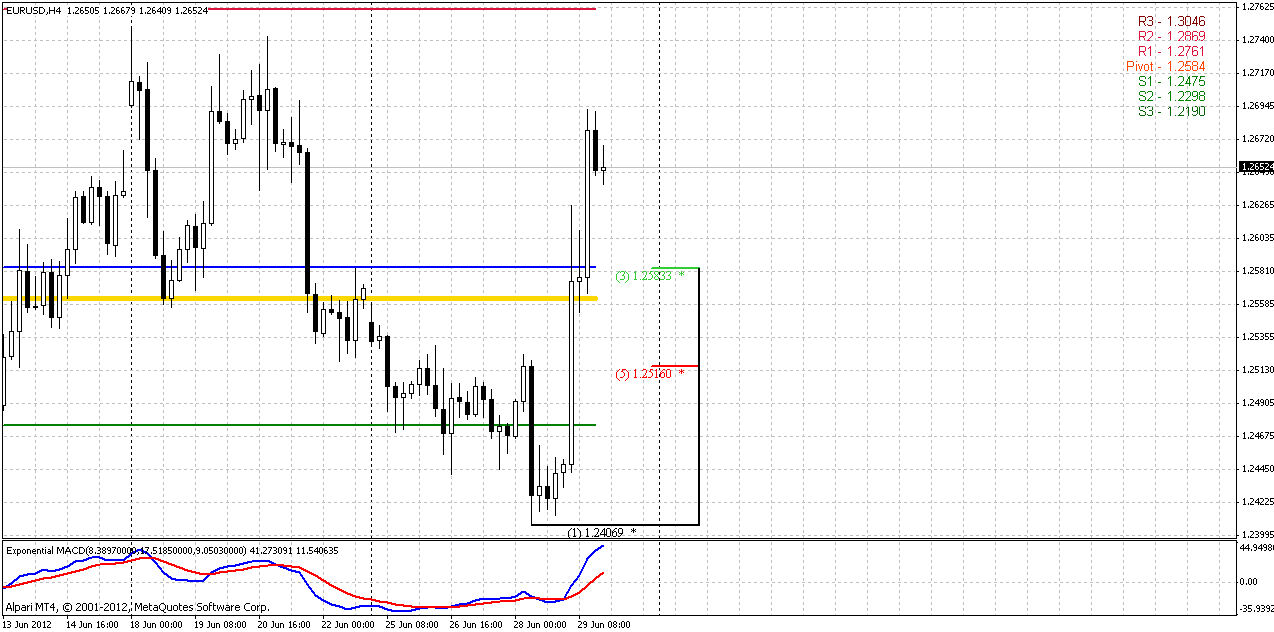
Trend strongly bullish here. Keep in mind that WPR1=1.2761 is also a daily Fibonacci K-resistance area. I just put it out from the chart, since we’ve talked about it in every research. Here I like 1.2560-1.2585 area to search for buy opportunity. This is nearest Fib support level, WPP and MPP. If market will hold here it will simultaneously confirm bullish sentiment. Probably it could be a bit deeper retracement – to 50% support of total move. One thing that we do not want to see - erasing of this upward splash. If market will take out its lows, then we should forget about upward continuation. So, that is our point of stop placing. This is a bit extended stop – 200 pips, but current volatility is solid. Another way, how you may act – drop your time frame, find some patterns or downward AB=CD to buy into and stick with it. This may be even better way to act. Here I just show you the levels what to watch for.
Conclusion:
On long-term charts situation holds bearish, at least currently I do not see any upward explosive moves, that could force us think opposite. On weekly time frame bear flag is forming (in a shape of daily AB=CD) so, positional traders should wait for 1.29-1.30 level and then search a possibility to sell.
Daily traders could try to buy with hope of upward continuation of this AB=CD pattern against “C” point low. First level to watch as suitable for Long entry is 1.2560-1.2580.
The technical portion of Sive's analysis owes a great deal to Joe DiNapoli's methods, and uses a number of Joe's proprietary indicators. Please note that Sive's analysis is his own view of the market and is not endorsed by Joe DiNapoli or any related companies.
Monthly trend holds strongly bearish. Although chart almost equals to previous one – market closed just 20 pips higher, we’ve seen a lot of price action within the week. Actually situation in EU is so, that it is better to not marry any position and try to appoint nearest targets. I’m talking for those who trade on daily time frame. I’ve looked again on monthly chart and find out that we’ve missed important detail. Currently market stands not only on crucial support range – 1.19-1.23 that held EUR twice from collapse. This is also 0.618 target from huge AB-CD pattern. We could also tell that this is 0.88 Fib support from most recent swing, but it has minor importance.
From that perspective it seems possible retracement to 1.30 K-resistance monthly level. We’ve discussed this already on previous week and told that even such bounce, that could be solid from daily perspective, on monthly chart could become absolutely reasonable and moderate retracement, that still will not change overall bearish bias on monthly time frame.
The problem though, that currently we have some lack of confirmation that a) this move has started and b) that it will reach this level. From monthly stand point we have couple of conclusions – although trend and price action are bearish, market stands at support. May be we should investigate possibility to buy against previous lows, because if market will break it – it will mean downward continuation.

Weekly
Weekly trend is bearish. In addition to monthly target, market has hit 1.27 target of butterfly pattern and weekly oversold, then it turned to upward retracement. Still, currently price holds below even first Fib resistance 1.2668. From weekly time perspective I do not want to buy and probably search the possibility to sell, since current price action is creating classical bear flag. Keeping in mind that market was at oversold and actually just shows sideway move tells that it rather heavy.
Looking at monthly pivot points for July we have MPP=1.2563, MPR1=1.2837, MPS1=1.2378. We know that when market stands in bear trend it often retraces to MPR1. That is very close to upper border of channel and weekly K-resistance.

On second chart we see downward destination points. Our AB=CD pattern is finished fight at the lower border of monthly support zone. Also if we apply classical rule of flag trading – move after breakout should be equal to mast – this point also will be around 1.18-1.19 area. So, on weekly chart I do not want to buy and probably start to look for sell possibilities around MPR1 and K-resistance area, if I will be able to find any daily AB=CD to sell into.

Daily
Daily chart mostly resolves our riddle. As you can see trend has turned bullish here again by solid upward candle. This give us some confidence to think that AB=CD is really could be possible. Market already has reached its 0.618 target and daily overbought.
So, I suppose that we could be buyers here against previous lows (red circle) at some pullback. The target of this AB=CD precisely at an area of MPR1 and lower border of K-resistance on weekly chart.

4-hour
Trend strongly bullish here. Keep in mind that WPR1=1.2761 is also a daily Fibonacci K-resistance area. I just put it out from the chart, since we’ve talked about it in every research. Here I like 1.2560-1.2585 area to search for buy opportunity. This is nearest Fib support level, WPP and MPP. If market will hold here it will simultaneously confirm bullish sentiment. Probably it could be a bit deeper retracement – to 50% support of total move. One thing that we do not want to see - erasing of this upward splash. If market will take out its lows, then we should forget about upward continuation. So, that is our point of stop placing. This is a bit extended stop – 200 pips, but current volatility is solid. Another way, how you may act – drop your time frame, find some patterns or downward AB=CD to buy into and stick with it. This may be even better way to act. Here I just show you the levels what to watch for.

Conclusion:
On long-term charts situation holds bearish, at least currently I do not see any upward explosive moves, that could force us think opposite. On weekly time frame bear flag is forming (in a shape of daily AB=CD) so, positional traders should wait for 1.29-1.30 level and then search a possibility to sell.
Daily traders could try to buy with hope of upward continuation of this AB=CD pattern against “C” point low. First level to watch as suitable for Long entry is 1.2560-1.2580.
The technical portion of Sive's analysis owes a great deal to Joe DiNapoli's methods, and uses a number of Joe's proprietary indicators. Please note that Sive's analysis is his own view of the market and is not endorsed by Joe DiNapoli or any related companies.
