- Forex, Gold, BTC Market Analysis | Trading Signals
- Sive Morten- Currencies, Gold, Bitcoin Daily Video
You are using an out of date browser. It may not display this or other websites correctly.
You should upgrade or use an alternative browser.
You should upgrade or use an alternative browser.
FOREX PRO Weekly July 02-06, 2012
- Thread starter Sive Morten
- Start date
Hi Triantus,
Here we go...good luck dude...
Thanks and Best Regards
As I understand it, butterfly is an exhausting pattern, not just a drawing. So, in an uptrend, it has to indicate the exhaust of the buyers and reversal. In your example, you expect the continuation of the uptrend, based on the butterfly.
Triantus Shango
Sergeant Major
- Messages
- 1,371
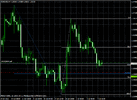
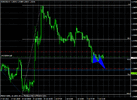
BUT if we look at the daily chart, we can see that there is a potential gartley/butterfly buy in progress. and that's at the bottom of a trend. hence if the harmonic pattern completes and is not invalidated, it will lend more credence to the short trend exhaustion, which will turn into a bullish reversal.
As I understand it, butterfly is an exhausting pattern, not just a drawing. So, in an uptrend, it has to indicate the exhaust of the buyers and reversal. In your example, you expect the continuation of the uptrend, based on the butterfly.
D.R.&Quinch
Sergeant
- Messages
- 661
GulP! that was quick action!
D.R.&Quinch
Sergeant
- Messages
- 661
im staying short and not watching the granular detail, its yuck. almost stopped out at midday
Triantus Shango
Sergeant Major
- Messages
- 1,371
listen to soertje. take a look at the weekly chart. this baby is going down to retest the previous weekly low, at the very least. and the trend line, a little lower. instead, on a pullback, re-load the shorts.
I am to buy at 1,2380
Triantus Shango
Sergeant Major
- Messages
- 1,371
forgot to add that 226x/8x is also where the FE 127.2 of that potential butterfly buy comes in, and that's also where the previous low on weekly is. so at this point, if the USD keeps on taking off, as per DXY, lower we go, as long as pull-backs remain under key levels, of course.
Similar threads
- Replies
- 1
- Views
- 63
- Replies
- 0
- Views
- 43
- Replies
- 0
- Views
- 48
- Replies
- 7
- Views
- 761
- Replies
- 5
- Views
- 390
- Forex, Gold, BTC Market Analysis | Trading Signals
- Sive Morten- Currencies, Gold, Bitcoin Daily Video

