Rashidin, Lolly,
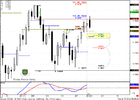
yes, we have this Gartley "222". But there is a couple of moments that makes me worry with it. If you've read research carefully, you should remember it:
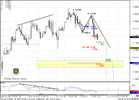
1. Look, how larger downmove develops on daily. Market has hit just 0.618 target from huge daily AB-CD, shown retracement, but then was not able even renew the lows. This is not typical.
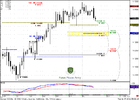
2. The batterfly that is forming on daily/weekly chrart is very often takes places after solid long-term moves.
3. On monthly chart market was at overbought at Fib resistance. All that it could show - retracement to nearest Fib support at 1.4140. This is also a sign of strength.
4. Also look, how it behave around 1.0 target, this AB=CD move up is very harmonic, almost perfect, but market does not show any pullback from AB=CD target.
That's why this Gartley 222 either could fail, or, just show some shallow move down. Also is possible that CD leg will be extended. Anyway, currently I do not see solid "sell" signals, may be later will appear something.