FOREX PRO Weekly July 04-08, 2011

I'm stuck with a LONG postition at 1.4407

1. I certainly do not know when you opened your position, but This morning the price was in the .4460 area - you should have moved your stop to break even (at least) or into some profit.
2. I think the price will reverse - maybe not today, maybe it is reversing already.
Good luck.
 
am i mistaken or does it look like a triangle is forming on the daily with a 1-2-3 and/or an AB=CD pattern with the CD leg in the process of forming? which would indicate further downside before potential reversal of short-term short trend? is that why most news releases from the big boys state that they expect EUR to rocket back up?
 
screenshot for previous post re triangle+1-2-3 formation on daily

oops! forgot to attach the screenshot... here you go guys.
 

Attachments

  • EURUSD_daily_triangle.jpg
    EURUSD_daily_triangle.jpg
    158.4 KB · Views: 173
i am off my rocker today! i don't know why i wrote there was 3-drives pattern. there isn't. i need to calm down.

that being said, on H8 i have a sell GARTLEY 222 that has retraced already to the 50% fib for the A-D leg. so theoretically, next targets could be 61.8% (4264) and 78.6% (4181).

or am i missing something?
 
H8 chart for previous post

definitely need some sleep... forgot to attach the chart again... here it is
 

Attachments

  • EURUSD_H8_sell_gartley222.jpg
    EURUSD_H8_sell_gartley222.jpg
    455 KB · Views: 170
EUR/USD Daily Update, Thu 07, July 2011

Good morning,
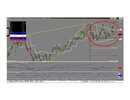
due to Portugal downgrading market has shown solid plunge. So, we can't speak about entering long currently. Still, on daily time frame bullish bias has not been cancelled totally - market at Fib support and MACDP comes in play today.
Tomorrow we will see NFP release and situation again could twist from top to bottom. Weekly chart tells the same, since it shows picture telling that upward is more probable than downward.
That's why I do not trust much to current sell-off.

Since tommorow will be important data, it's better to focus on short term trades, so that our positions do not hurt from tommorow's turmoil.
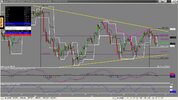
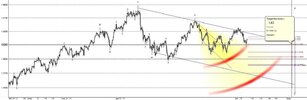
On 4-hour chart we see, that market accelerates right to 1.0 target and turns to retracement. Usually after such kind of price action market makes 50%-61.8% retracement from last swing down. 61.8 - is 1.4350 area - weekly pivot and Confluence resistance.
The next target is 1.42 area - pivot support 1 at 1.618 target.

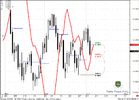
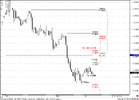
On hourly chart we see, that market could show AB=CD retracement with the 1.0 target At Agreement with 50% resistance. We can't exclude that market could try to retest pivot from downside, but for bearish bias it should not return back in the range of upward retracement above 1.4360

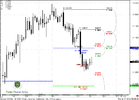
So plan is simple. Keep an eye on development of this retracement. If market will reach 1.4350-1.4370 drop to 5-min chart and watch for Sell signals. Enter short with stop around 1.4380-1.4390 target 1.42.
As you can see, this trade with very tight stop, although risk exists.
The second approach - do nothing, and wait NFP data.
 

Attachments

  • EUR_D_07_07_11.PNG
    EUR_D_07_07_11.PNG
    49.1 KB · Views: 161
  • EUR_4H_07_07_11.PNG
    EUR_4H_07_07_11.PNG
    42.1 KB · Views: 158
  • EUR_1H_07_07_11.PNG
    EUR_1H_07_07_11.PNG
    27.3 KB · Views: 162
Hello Sive

Guys check out how wave count matched Sive's analysis to 1.4250 and how retracement began at 0.62...
 

Attachments

  • Wave Counters.jpg
    Wave Counters.jpg
    97.4 KB · Views: 91
  • H1 Divergence.jpg
    H1 Divergence.jpg
    131.7 KB · Views: 89
Back
Top