Sive Morten
Special Consultant to the FPA
- Messages
- 18,659
Monthly
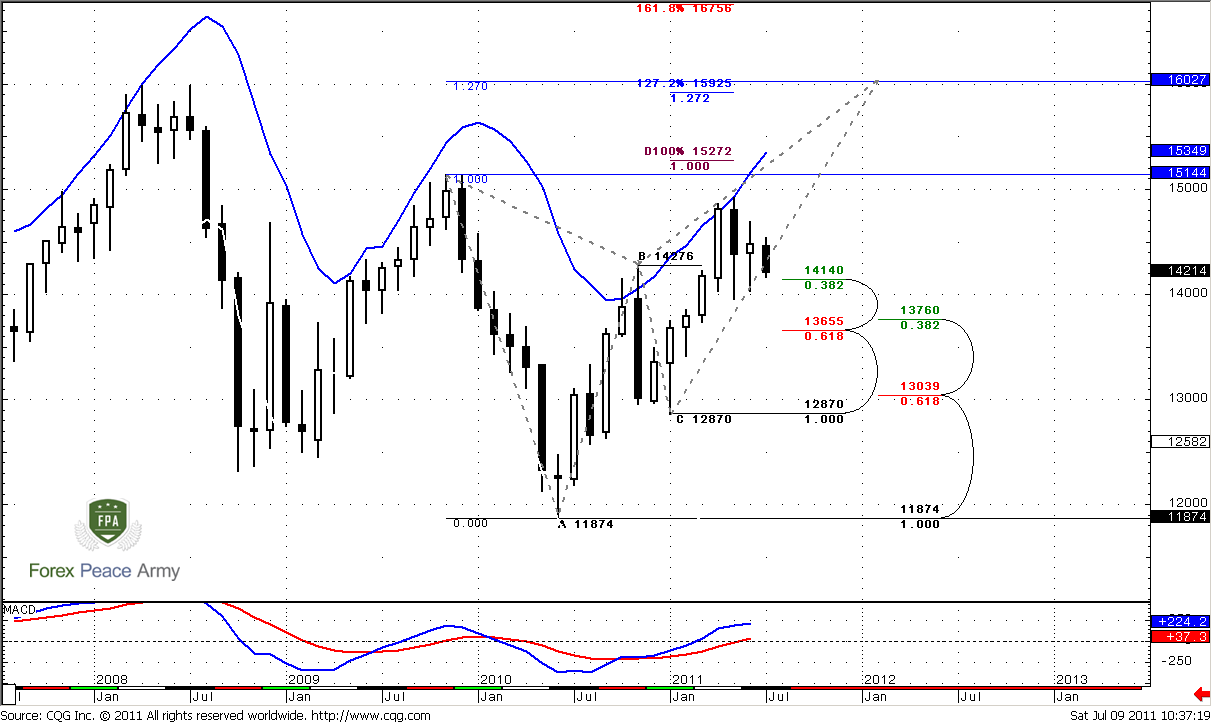
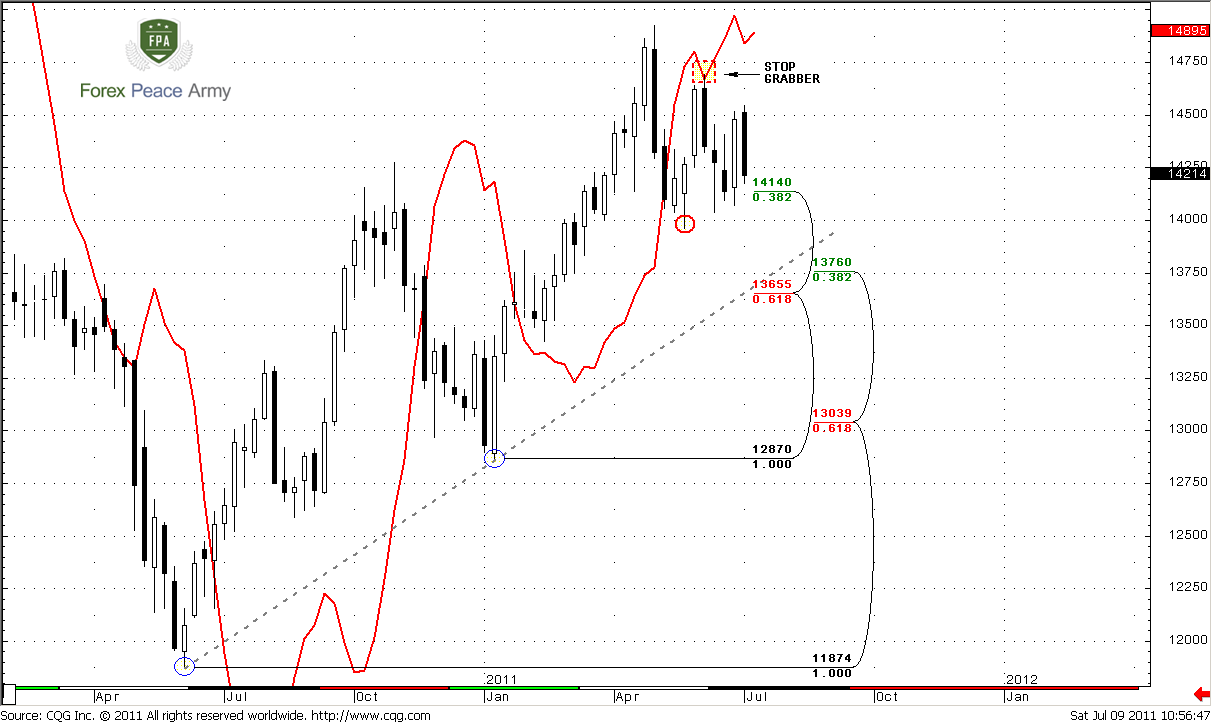
Trend holds bullish, there are no many changes on monthly chart. As you know, we have two major scenarios. The first one is a move to 1.60 area, the second – deeper retracement to 1.37, and current environment absolutely does not help to resolve this problem and to answer on this question definitely.
During the past two months market has shown retracement till nearest 3/8 Fib support at 1.4140 that stands very close to previous highs at 1.4276. Now it shows some bouncing from there. June month has become an inside one, as three past months in general stand in limited range. Current price action makes me think, that the probability of further move down becomes weaker. Think by yourself, market has hit monthly overbought, 0.88 Fib resistance, and after all it just has reached nearest Fib support at 1.4140 and stands there currently. This is not very typical for situations when market really intends to move lower. Forming inside month tells us that market now stands indecision or building energy. So, it looks like the downward power is not so great, at least currently. Nearest target stands at 1.5272, but potentially it could turn to butterfly “Sell” pattern. The target of this pattern is 1.27 extension at 1.6027. Also it almost coincides with 1.27 target of recent bullish AB-CD at 1.5925.
From another point of view, if you draw trend line and link lows at 1.1874 and 1.2870, then you will be able to see that this trend line nicely holds upward move. From that perspective retracement in July to 1.37 Confluence support will be normal, since it precisely will reach this trend line.
In general more confidence could give us with bearish bias close below 1.40. Downward possibility also implicitly confirms with market overbought. Usual retracement target during overbought is zero point of Detrended Oscillator and this level stands around monthly Confluence support. Also its worth to note here that trend will remain bullish, even if market will reach 1.37 area. Still, if market will hold on first Fib support, this will be much better for current bullish bias and Butterfly pattern.
#1
As an alternative scenario I want to show you a bit different picture. This scenario suggests possible reversal not at 1.60 but at 1.52 area. Also it suggests retracement to 1.37 monthly confluence support. This is 3-Drive “Sell”:
#2
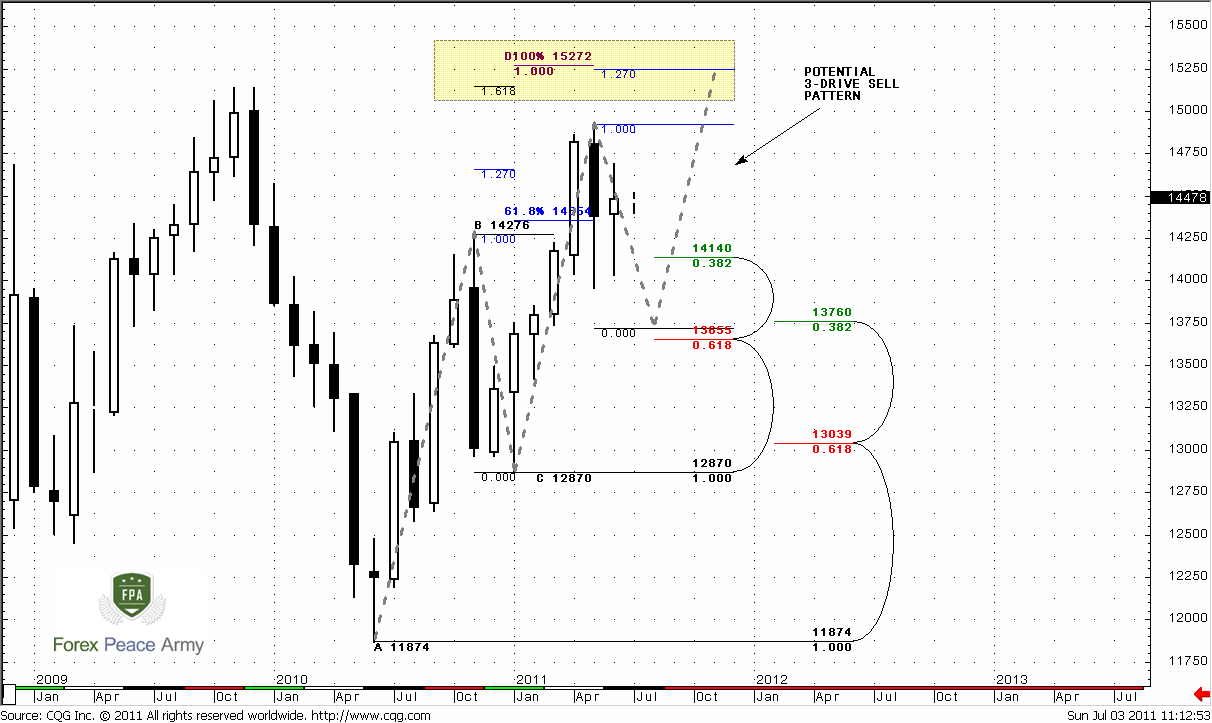
See – for agreement of 1.618 of first drive and 1.27 of second drive market should show retracement to 1.37 before acceleration to 1.52.
So, as conclusion to monthly chart we can say, that overbought, trend line and potential 3-Drive are support retracement to 1.37, while butterfly and standing for a long time at first Fib support level are support further move up. This task could resolve the direction of triangle breakout on weekly time frame.
Weekly
This time frame also does not make overall picture much clearer. Let’s just discuss as bullish as bearish points from current chart and you will understand why I’ve said that:
Bullish:
1. Market is forming triangle formation after strong move up. Usually this triangle is a continuation pattern;
2. If you link appearance of this triangle with monthly charts’ events, then you’ll see, that market has exceeded 0.618 AB-CD target and turned to retracement just because reached monthly overbought. So, current triangle could be just a respect of this overbought and some pause to correct it.
3. Market for a long time stands at nearest Fib support area that is also a previous highs.
4. Although trend is bearish, market does not absolutely confirm that, since it stands in the range and does not accelerate lower.
Bearish
1. Trend is bearish and market has formed bearish stop grabber pattern that could lead to taking out lows at 1.3963. Since this will be a downward breakout, market could easily accelerate to 1.37 area;
2. On monthly chart market has hit overbought the usual depth of retracement after that points on 1.37 area;
3. Market is following to long-term trend line and it support stands at 1.37 in July.
4. Another potential pattern is 3-Drive “Sell” that demands retracement to 1.37.
5. Market stands below monthly pivot.
#1
That is with chart #1, now about chart #2 – let’s speak about triangle itself.
Bullish:
1. Very often after strong uptrend market forms Butterfly “Sell” as a reversal pattern. Target of this pattern agrees with monthly AB-CD around 1.52 and weekly/monthly overbought;
2. Market has reached just 0.618 target from downward AB-CD and turned to deep retracement that is not very common.
3. Fundamental data point on growth due to poor NFP data, debt ceiling questions and ECB rate hiking. Despite the problems in EU debt burden is much lower than of US.
Bearish
1. Market could form downward Butterfly “Buy” as well. The target of this pattern coincides with AB=CD target, trend line and weekly confluence support;
2. After each upward pullback market forming bearish engulfing or Dark Clouds, i.e. shows fast returns back.
#2
So, what we’re going to do now, since long-term charts can’t resolve the problem? Usually, when such things happen, only thing that we can do is to focus on short-term trades and analysis and make trading plan, based on daily time frame, by trading recent swings with short term trades and scalp targets, until situation will resolve.
Daily
Bulls did not realize their advantage with stop grabber, that we’ve discussed on Friday and market has taken out its lows and confirmed bear trend, so it seems that this pattern out of play now. Trend is bearish, price action is bearish. Market has hit 0.618 target at 1.4168 in Agreement with 0.786 Fib support. The next target is 1.4078 – weekly pivot support 1 and 1.0 Fib extension target at 1.3934 and daily oversold.
Be careful with 1.4120 also, since this is a monthly pivot support 1.
4-hour
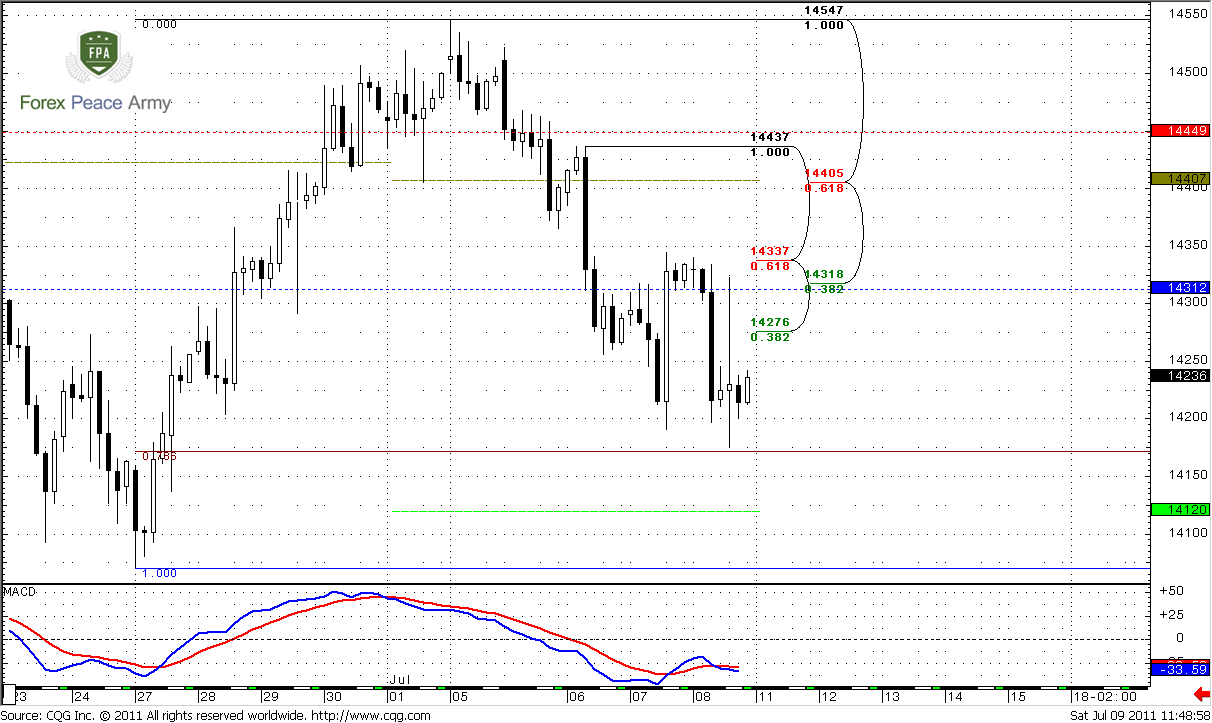
Trend has turned bearish, but in such choppy environment is too difficult to judge about it. Just above the market stands Confluence resistance and weekly pivot point at 1.4312-1.4340. That’s an area to watch for in the beginning of the week. Since we’ve said that market has hit daily support and 0.618 target it could turn to retracement. So this area is the first one that could be reached during this retracement. Possibly we will be able to use it to enter short.
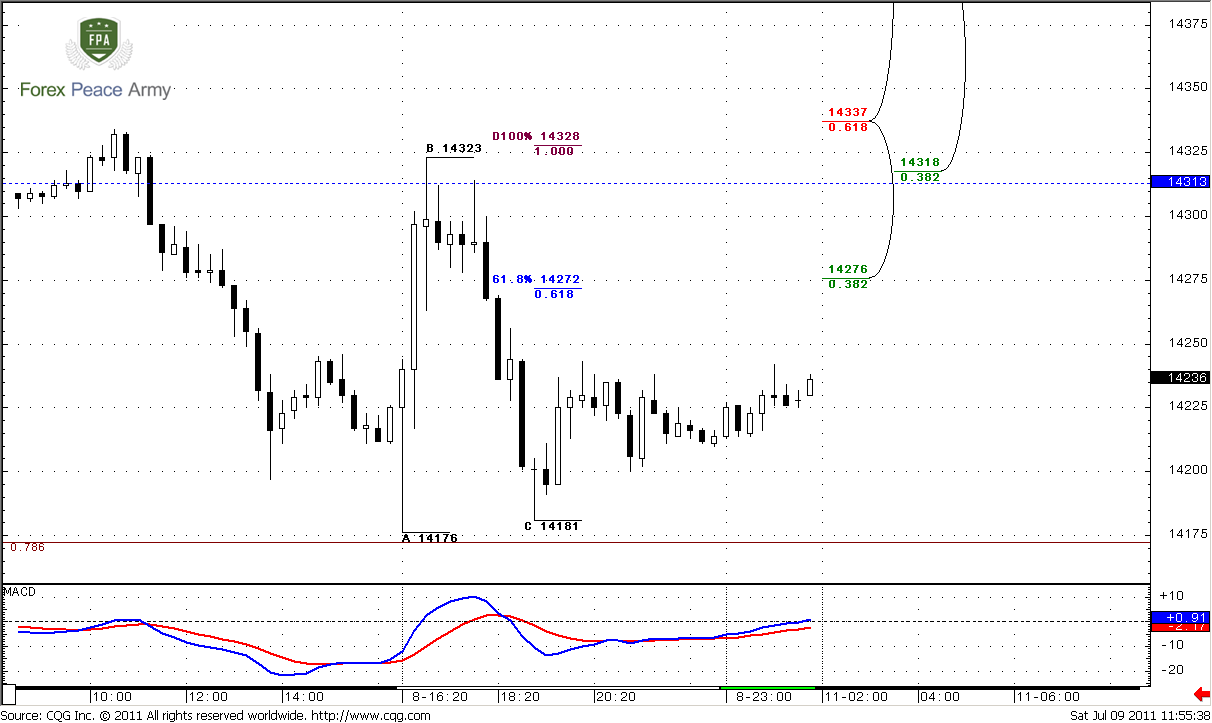
15-min
Trend has reestablished on bullish side. Here is just single important detail for us – Confluence area is also an Agreement with AB-CD pattern. Personally, I prefer to see Wash & Rinse of the highs around 1.4350 – when market will exceed them and then show fast return back. This will be perfect from bearish point of view. If market will break it and hold their – don’t haste to enter short, since it could turn as Double bottom pattern and could lead to deeper retracement up. Besides, it this case, market will stand above pivot point…
Conclusion:
Position traders:
Long term environment does not give us solid signals of near time direction. If it will be downside, then the first area to watch is 1.37
Intraday and daily traders:
1. Wait upward retracement to 1.4312-1.4340 area;
2. If market will show W&R of highs around 1.4350 this will be much better form bearish perspective;
3. If it will break 1.4350 and hold there – don’t be short, wait deeper upward move.
Potential targets are 1.4078 – weekly pivot support 1 and 1.0 Fib extension target at 1.3934 and daily oversold. Be careful with 1.4120 also, since this is a monthly pivot support 1.
The technical portion of Sive's analysis owes a great deal to Joe DiNapoli's methods, and uses a number of Joe's proprietary indicators. Please note that Sive's analysis is his own view of the market and is not endorsed by Joe DiNapoli or any related companies.
Trend holds bullish, there are no many changes on monthly chart. As you know, we have two major scenarios. The first one is a move to 1.60 area, the second – deeper retracement to 1.37, and current environment absolutely does not help to resolve this problem and to answer on this question definitely.
During the past two months market has shown retracement till nearest 3/8 Fib support at 1.4140 that stands very close to previous highs at 1.4276. Now it shows some bouncing from there. June month has become an inside one, as three past months in general stand in limited range. Current price action makes me think, that the probability of further move down becomes weaker. Think by yourself, market has hit monthly overbought, 0.88 Fib resistance, and after all it just has reached nearest Fib support at 1.4140 and stands there currently. This is not very typical for situations when market really intends to move lower. Forming inside month tells us that market now stands indecision or building energy. So, it looks like the downward power is not so great, at least currently. Nearest target stands at 1.5272, but potentially it could turn to butterfly “Sell” pattern. The target of this pattern is 1.27 extension at 1.6027. Also it almost coincides with 1.27 target of recent bullish AB-CD at 1.5925.
From another point of view, if you draw trend line and link lows at 1.1874 and 1.2870, then you will be able to see that this trend line nicely holds upward move. From that perspective retracement in July to 1.37 Confluence support will be normal, since it precisely will reach this trend line.
In general more confidence could give us with bearish bias close below 1.40. Downward possibility also implicitly confirms with market overbought. Usual retracement target during overbought is zero point of Detrended Oscillator and this level stands around monthly Confluence support. Also its worth to note here that trend will remain bullish, even if market will reach 1.37 area. Still, if market will hold on first Fib support, this will be much better for current bullish bias and Butterfly pattern.
#1
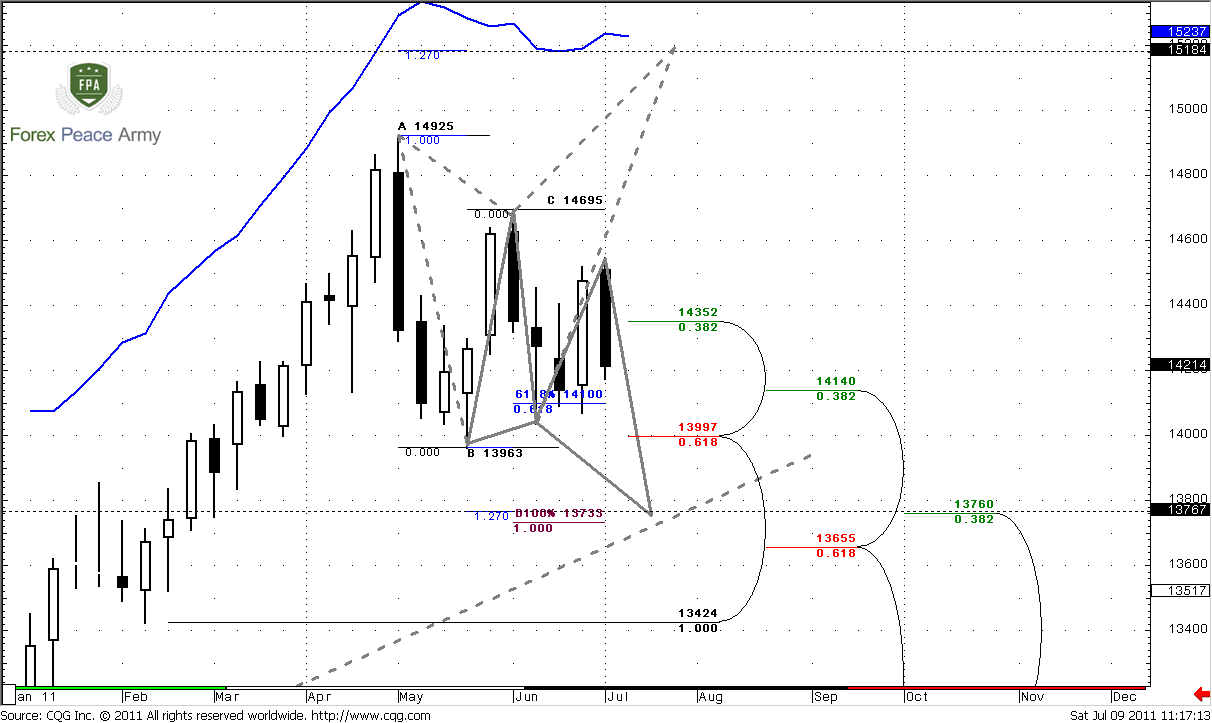
As an alternative scenario I want to show you a bit different picture. This scenario suggests possible reversal not at 1.60 but at 1.52 area. Also it suggests retracement to 1.37 monthly confluence support. This is 3-Drive “Sell”:
#2
See – for agreement of 1.618 of first drive and 1.27 of second drive market should show retracement to 1.37 before acceleration to 1.52.
So, as conclusion to monthly chart we can say, that overbought, trend line and potential 3-Drive are support retracement to 1.37, while butterfly and standing for a long time at first Fib support level are support further move up. This task could resolve the direction of triangle breakout on weekly time frame.
Weekly
This time frame also does not make overall picture much clearer. Let’s just discuss as bullish as bearish points from current chart and you will understand why I’ve said that:
Bullish:
1. Market is forming triangle formation after strong move up. Usually this triangle is a continuation pattern;
2. If you link appearance of this triangle with monthly charts’ events, then you’ll see, that market has exceeded 0.618 AB-CD target and turned to retracement just because reached monthly overbought. So, current triangle could be just a respect of this overbought and some pause to correct it.
3. Market for a long time stands at nearest Fib support area that is also a previous highs.
4. Although trend is bearish, market does not absolutely confirm that, since it stands in the range and does not accelerate lower.
Bearish
1. Trend is bearish and market has formed bearish stop grabber pattern that could lead to taking out lows at 1.3963. Since this will be a downward breakout, market could easily accelerate to 1.37 area;
2. On monthly chart market has hit overbought the usual depth of retracement after that points on 1.37 area;
3. Market is following to long-term trend line and it support stands at 1.37 in July.
4. Another potential pattern is 3-Drive “Sell” that demands retracement to 1.37.
5. Market stands below monthly pivot.
#1
That is with chart #1, now about chart #2 – let’s speak about triangle itself.
Bullish:
1. Very often after strong uptrend market forms Butterfly “Sell” as a reversal pattern. Target of this pattern agrees with monthly AB-CD around 1.52 and weekly/monthly overbought;
2. Market has reached just 0.618 target from downward AB-CD and turned to deep retracement that is not very common.
3. Fundamental data point on growth due to poor NFP data, debt ceiling questions and ECB rate hiking. Despite the problems in EU debt burden is much lower than of US.
Bearish
1. Market could form downward Butterfly “Buy” as well. The target of this pattern coincides with AB=CD target, trend line and weekly confluence support;
2. After each upward pullback market forming bearish engulfing or Dark Clouds, i.e. shows fast returns back.
#2
So, what we’re going to do now, since long-term charts can’t resolve the problem? Usually, when such things happen, only thing that we can do is to focus on short-term trades and analysis and make trading plan, based on daily time frame, by trading recent swings with short term trades and scalp targets, until situation will resolve.
Daily
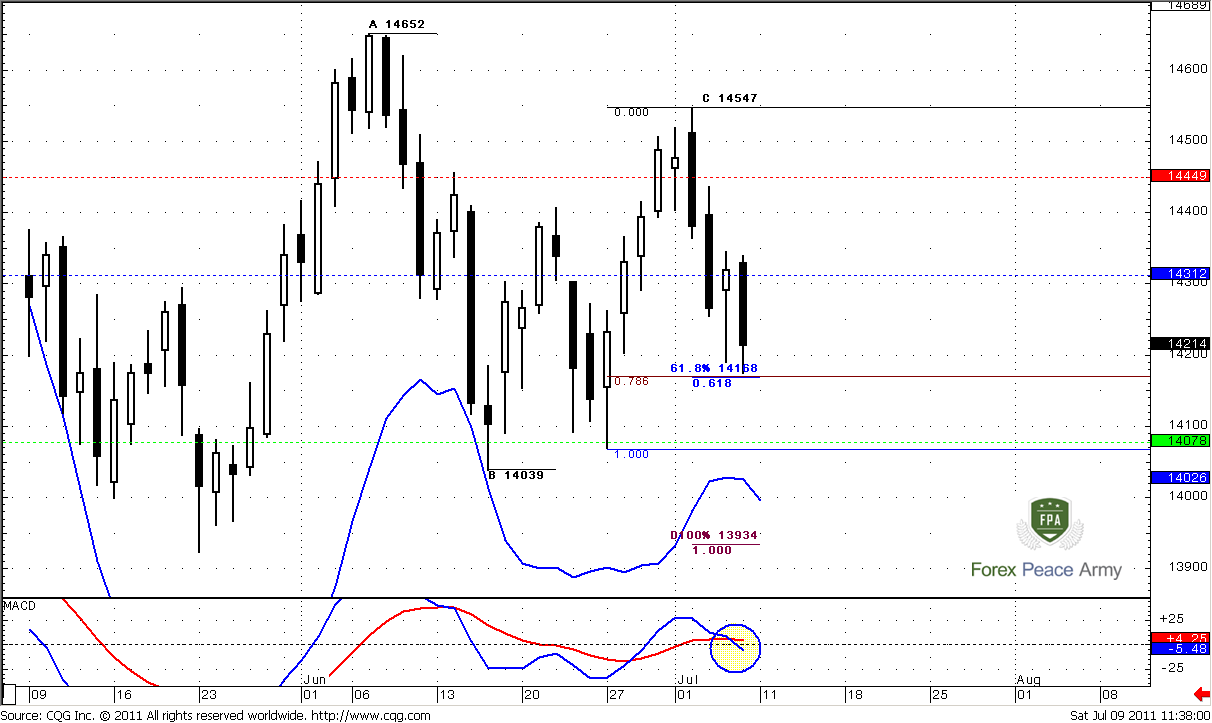
Bulls did not realize their advantage with stop grabber, that we’ve discussed on Friday and market has taken out its lows and confirmed bear trend, so it seems that this pattern out of play now. Trend is bearish, price action is bearish. Market has hit 0.618 target at 1.4168 in Agreement with 0.786 Fib support. The next target is 1.4078 – weekly pivot support 1 and 1.0 Fib extension target at 1.3934 and daily oversold.
Be careful with 1.4120 also, since this is a monthly pivot support 1.
4-hour
Trend has turned bearish, but in such choppy environment is too difficult to judge about it. Just above the market stands Confluence resistance and weekly pivot point at 1.4312-1.4340. That’s an area to watch for in the beginning of the week. Since we’ve said that market has hit daily support and 0.618 target it could turn to retracement. So this area is the first one that could be reached during this retracement. Possibly we will be able to use it to enter short.
15-min
Trend has reestablished on bullish side. Here is just single important detail for us – Confluence area is also an Agreement with AB-CD pattern. Personally, I prefer to see Wash & Rinse of the highs around 1.4350 – when market will exceed them and then show fast return back. This will be perfect from bearish point of view. If market will break it and hold their – don’t haste to enter short, since it could turn as Double bottom pattern and could lead to deeper retracement up. Besides, it this case, market will stand above pivot point…
Conclusion:
Position traders:
Long term environment does not give us solid signals of near time direction. If it will be downside, then the first area to watch is 1.37
Intraday and daily traders:
1. Wait upward retracement to 1.4312-1.4340 area;
2. If market will show W&R of highs around 1.4350 this will be much better form bearish perspective;
3. If it will break 1.4350 and hold there – don’t be short, wait deeper upward move.
Potential targets are 1.4078 – weekly pivot support 1 and 1.0 Fib extension target at 1.3934 and daily oversold. Be careful with 1.4120 also, since this is a monthly pivot support 1.
The technical portion of Sive's analysis owes a great deal to Joe DiNapoli's methods, and uses a number of Joe's proprietary indicators. Please note that Sive's analysis is his own view of the market and is not endorsed by Joe DiNapoli or any related companies.