nicolebobbin
Private
- Messages
- 76
when will we have update today, will market break above 1.4270 again ?
Good morning,
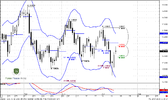
Looks like market still has decided to reach ultimate 1.618 retracement target in Agreement with 4H Fib resistance.
If market really has bearish bias it should not break it. So currently we stand at crucial point. If market will reverse here - we will see at least new leg down. If not - then it could lead to changing in daily trend.
As you can see on 4-hour chart 1.618 target stands slightly higher than market's high. Personally I would like to see W&R of that highs and hitting the Agreement - then fast return back below that level. This will be perfect signal to enter short with very tight stop.
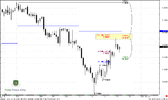
Second scenario is also possible - look at 15-min chart. Usually when market reverses, it shows first leg down and during second can't move above previous highs and stops at some deep Fib resistance. For instance, it could be 1. 4212, or 1.4225 - 0.618 0r 0.786 levels. If that will happen, we also can try to enter short.
One thing that we do not want to see is breakout of Agreement at 1.4266 or even with weekly pivot and holding above them.
Hello again Mr.Morten.
You said in your post that "on 4-hour chart 1.618 target stands slightly higher than market's high".
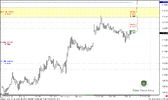
On my MT4 chart on 4-hour chart 1,00 extension target (and not 1.618 extension targhet) in Agreement with 0.618 fibo retracement stands slightly higher than market's high. I atached the chart.
Can you please tell me where am I wrong in drawing the fibo extension.
Thank you in advance.
")
What's going on here?
Went up to 1.4281 (MT4) then dropped to 1.4148 in minutes. Did not reach the second target of 1.4317 as Sive predicted.
Can this be the downturn? Or will it go back up to 1.4317 before it hopefully turns down again?
Can someone that has more experience with Sive please answer.
Thanks.
Closed all my shorts at no profit. Will just sit back and watch.
Me- grabs popcorn.
I have a question here : while Euro has crisis and down, why AUD always down together with Euro, AUD doesn't have any serious crisis
Second question : why USDX strengthen but USDJPY dive down at the same time with EURUSD, it looks so confuse to understand when take into account the fact that Japan just had earthwake, tsunami and nuclear crisis, their production/export is reduced.
The world has many other option to put their money, AUD, CAD, NZD..... but all these currency decrease value, only JPY increase value, why is this weird
I am new here, so please help.
All is going to plan. After a sideways 1.40 all day long, it has now gone up to Sive's 1.4140 or 1.4175 on my MT4.
Then watching my 5m chart it started dropping to 1.4154 so I got in with a 1 lot sell. Took a large punt as my other 2 traders also predicted a move to 1.3820 and 1.3837 in the short term. Not often do all 3 predict the same.
My TP is at 1.3837 as the first leg.
Am I doing OK?
Thank you Sive for giving us your time and knowledge. Much to catch up.
Hello again Mr.Morten.
You said in your post that "on 4-hour chart 1.618 target stands slightly higher than market's high".
On my MT4 chart on 4-hour chart 1,00 extension target (and not 1.618 extension targhet) in Agreement with 0.618 fibo retracement stands slightly higher than market's high. I atached the chart.
Can you please tell me where am I wrong in drawing the fibo extension.
Thank you in advance.
Hi oficiuljuridic,
I think Sive cannot respond to your answer as faster as usual. So just consider my poor explanation if you want.
If you look carefully on H4 chart on spot market, point A is at 1.3831, point B is at 1.4051 and point C is at 1.3948. Then just draw fibo expansion and you can find that 1.618 extention is around 1.4317, very near to weekly pivot point (1.4324 on my chart).
Hope this can help you a bit.
Thanks and Best Regards.
What's going on here?
Went up to 1.4281 (MT4) then dropped to 1.4148 in minutes. Did not reach the second target of 1.4317 as Sive predicted.
Can this be the downturn? Or will it go back up to 1.4317 before it hopefully turns down again?
Can someone that has more experience with Sive please answer.
Thanks.
Closed all my shorts at no profit. Will just sit back and watch.
Me- grabs popcorn.
Hi Jonny 2 pips.
Unfortunately, when I've made update for 13th, I have not seen yet strong up candle to 1.0 Fib ext target. If I've seen it, I've recommended to wait a deeper move, we've hinted on the possibility move to 1.4260 area.
Still, almost all trades that we recommend, we try to do near strong levels of support resistance. This gives us huge advantage, since even if we will wrong, market in most cases respect that areas at least slightly. This allows us to move stop to break even.
That's how is better to act - if you've entered without any Sell patterns, i.e. blindly just from the level - wait of initial pullback and move stop to b/e.
Thanks Rashidin.