Hello Mr. Sive!
I understand that your time is very limited, so I'll just post an analysis and hope you'll take a look. If not, take care of yourself and don't overwork!
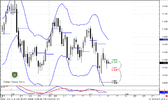
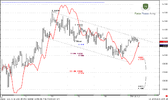
Monthly: Trend is bearish, price is forming ABCD retracement after strong move up, straight to 0.5 resistance from all time high. Target of ABC coincides with 1 retracement of the move up and stands inside this move.
Weekly: Retracement after reaching of small abc 100% target and Agreement with 0.88 fib support. Problem is that trend turned bulish but the price action stands in the range of initial bulish engulfing. We have 0.382 resistance of CD leg. So, up or down?
Preferably market will move up to weekly Confluence resistance and form Butterfly sell. Monthly trend will stay bearish precisely at that area.
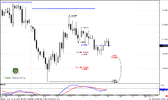
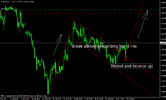
Daily: trend bulish. Price could form ABCD retracement after strong move up.
H4: several Stop grabbers. I think price will retrace to WS1. This is 0.618 daily retracement and agreement. Also, this is the low of strong daily bar up.
Action: I will SELL right at the opening of the market. ST just above 0.382 Weekly resistance. If price goes down I will move stops to BE an wait to see if I get any bullish pattern around 5.448 agreement area. If yes, close short positions and open longs, if not hold short.
Georgeta, you've made nice analysis. But the major question is what is your time frame? What time frame do you trade? Depending on that will be easier to discuss possible action
Hey sive,
thanks again for your analysis. Hope your in good health.
Quick 2 questions:
1. Do you think it is wise to buy a straddle from current market price of 14150?
2. You work for an european bank, did your bank pass the stress test ? =P
Hi Yousuf,
Options trading is a bit, say, different substance. You 've said only about strike price. What about the time and premium that you will get. In general straddle is a short position on volatility. You have to be sure, that market will not leave some range, i.e. volatility will decrease. To answer on your question, we need to look at some additional indicators, such as True Range, Historical Volatility, and calculate implied volatility that m-makers build in their quotes. We have to know time till expiration and premium. So, it's not a piece a cake.
Greetings Sive, Once again thanks for ur straight to the point analysis. pls would need help as to how to use trailing stop, what it is all about, and if it a better option than stop loss. please pardon me if i am drawing you backwards please, i just want to learn from you. Thanks in anticipation of ur usual support. ")
Hi akalou, If my mind does not trick me, in FPA military school there are couple of chaters how better to apply trailing stop. The major idea is not move it just for fix number of pips, but follow some strong support levels that appeared when market countinue move up or resistances - if down.
Concerning option, the short answer will be - use it, when logical stop is too far for you. For instance, if you decide to make deal on weekly chart or even monthly but stop will kill you if it will be triggered - you may try apply options or some strategies - spreads, straddles, strangles, ratio spreads and other.
Mr. DaveDubai,
you are a recruit. Do not act as a General.
If Yousuf's question warranted an answer, it would come from either Sive or the admin.
Besides, the emoticon at the end of the sentence shows that Yousuf was kidding.
Bernard
BenOm, Yousuf, Dave. We are equal here, surely we have to follow some rules of decorum, but this kind of piking not very pleased to anybody.
First, don't treat me as Guru, master etc. I'm the same as you and just share with my view on market, since probably I know something, that could be useful to forumers. Those people who find that useful - read my posts, others - not, that's normal. So as you do - you also know something, that may be could be useful to others. We are here for study.
Be patient to each other respect yourself and others.
I understand that Dave has thought that Yousuf a bit cut it too fat and want to reestablish the status quo, and he is partially right. And I'm thankful to Dave for his attitude.
From the other view this was, really, as BenOm said a joke.
The one thing that I will not be tolerate to is critics and forecasts without any foundation.