MACD, Histogram and EMA
Hello everybody. Sive, i'd like to ask you some questions about MACD and EMA:
1) what parameters do you use for macd? The "standard" 12,26,9 or 8.3896,17.5185,9.0503 suggested by Mr. DiNapoli?
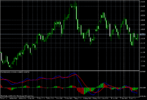
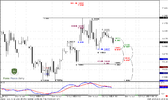
2) (i might be wrong, but the macd histrogram seems to be a very useful indicator for estimating the trend, i've attached a chart (eurusd daily). In particular, the histogram react much faster, and it can give us a signal that trend is changing before the macd line cross the signal line. Of course, this leads to more signals and more fake signals), [how] do you use macd histogram? Would you suggest us to use it?")
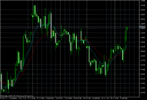
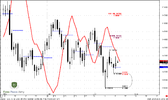
3) i've noticed that moving averages act, very often, as support/resistence. I've attached another chart (eurusd H1), with the EMA(26) and EMA(12). This happens especially when market is trending. Do you use moving averages to detect (or, at least, confirm) support and resistence areas? May be you could mention this behaviour in military school, if you think it's worth to be said.
Thank you for your attention and time you spend for us!
Hello everybody. Sive, i'd like to ask you some questions about MACD and EMA:
1) what parameters do you use for macd? The "standard" 12,26,9 or 8.3896,17.5185,9.0503 suggested by Mr. DiNapoli?
2) (i might be wrong, but the macd histrogram seems to be a very useful indicator for estimating the trend, i've attached a chart (eurusd daily). In particular, the histogram react much faster, and it can give us a signal that trend is changing before the macd line cross the signal line. Of course, this leads to more signals and more fake signals), [how] do you use macd histogram? Would you suggest us to use it?
3) i've noticed that moving averages act, very often, as support/resistence. I've attached another chart (eurusd H1), with the EMA(26) and EMA(12). This happens especially when market is trending. Do you use moving averages to detect (or, at least, confirm) support and resistence areas? May be you could mention this behaviour in military school, if you think it's worth to be said.
Thank you for your attention and time you spend for us!