Sive Morten
Special Consultant to the FPA
- Messages
- 18,669
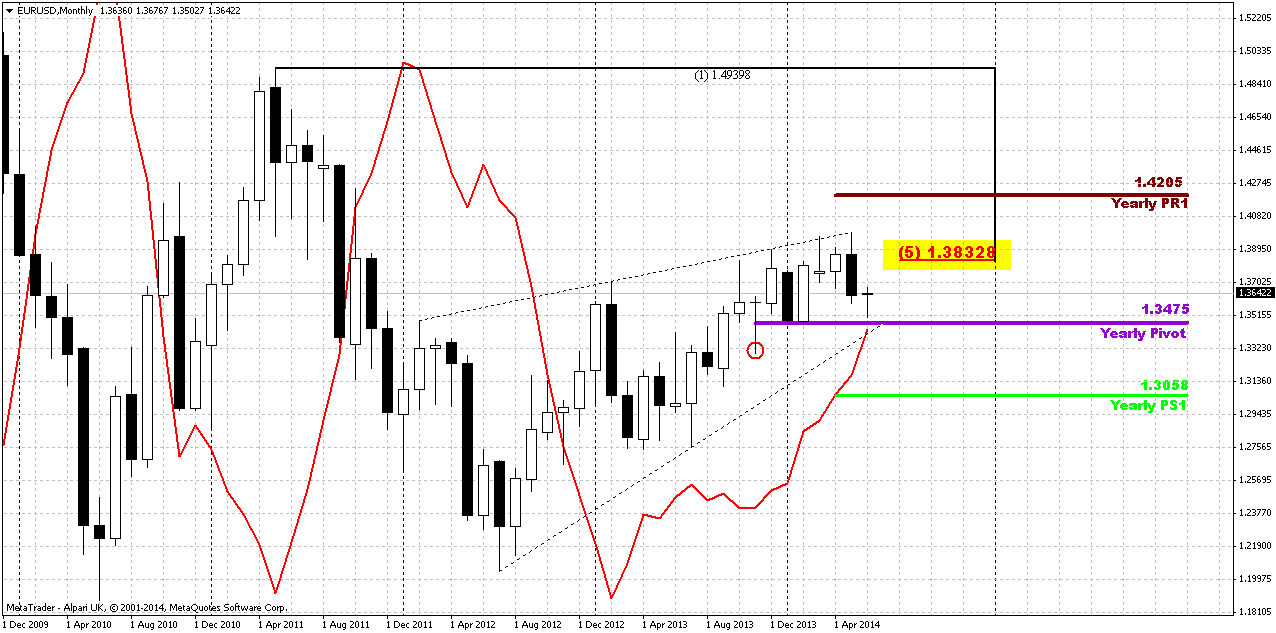
Monthly
The U.S. dollar recouped losses Friday as investors added to a well-worn pattern of borrowing greenbacks to buy higher-yielding currencies after solid U.S. jobs data left little chance the Federal Reserve would speed up monetary tightening. This follows Thursday's long-promised steps by the European Central Bank to boost the level of monetary stimulus into the euro zone economy, which, over time, puts pressure on investors to sell euros and buy higher-yielding currencies. "One central bank providing liquidity and another seeing data that is not going to change its mind on removing liquidity or the pace of normalization leads to an environment where risk is back on the table for the carry trade. That also benefits emerging market currencies," said Steven Englander, global head of G10 FX strategy at CitiFX in New York.
The euro gyrated after the data, initially selling off but then catapulting to a fresh, but brief, two-week high of $1.3677. Since then, it has settled back down 0.13 percent at $1.3641, just beneath the 200-day moving average.
The data, which showed the U.S. economy added 217,000 non-farm jobs against the Reuters consensus forecast of 218,000, brought employment to its pre-recession levels and indicated an economy that had snapped back from a harsh winter.
It may take until next week for the dust to settle on the ECB's moves, making good on hints that it would take strong action to both support the economy and, in passing, halt gains for the euro which have driven inflation below targets.
"Nothing really has changed in the U.S. scenario and I don't think the dust has settled from the ECB. The fact is the euro is lower than when we wholly anticipated the easing (by the ECB)," said Robert Lynch, head of G10 FX strategy at HSBC in New York.
Since the May 8 ECB policy meeting, when expectations grew for the central bank to loosen policy, the euro has dropped nearly 2 percent against the dollar and it is now down 0.80 percent year-to-date. Investors had been caught by the euro's four percent rise between January and the start of May, an unexpected scenario given bets the removal of policy accommodation by the Fed was expected to boost the dollar. But the Fed's slow and steady message of a dovish outlook for monetary policy remains intact despite stronger data. The conclusion of many from Thursday's ECB decision is that the ECB on its own will struggle to weaken the single currency. "It is still all about the Fed," said one London-based dealer. "Until we get more certainty about the prospect of stronger growth and higher interest rates in the United States, there are too many other factors in the euro's favor."
Technical
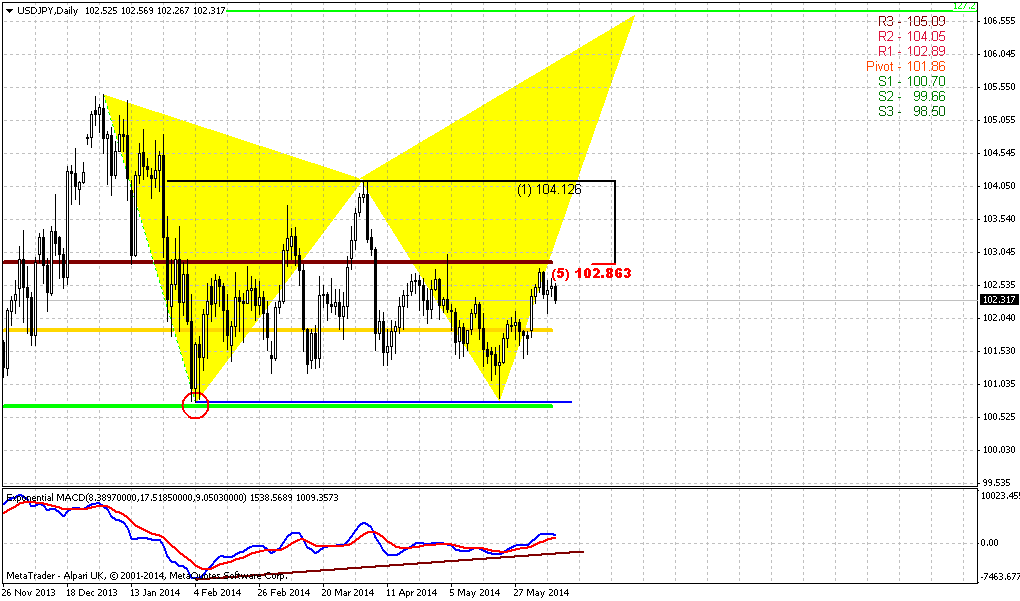
Although April was upward month, but overall action mostly should be classified as “inside” one to March range. Almost whole April price has spent in the same range. At the same time May action has shown its power. Although this has happened not quite independently but having ECB hand in EUR dynamic, still, technically we’ve got reversal bar on monthly chart. We saw something cognate on February action, but it didn’t lead to any downward continuation. At the same time, currently situation is slightly different because there was no solid upward action in April, and now we have a month candle that has moved above April high and close below it’s low and this could lead at least to some downward continuation. Part of this work has been done already and is continued on recent week. Now market stands at very significant moment. It has closely approached to Yearly Pivot point and monthly MACDP. If we will get lucky, we could get clarification in June for extended period. Thus, appearing of bullish grabber right at YPP level definitely will tell us that market should exceed 1.40 level and probably will reach YPR1~1.42 area. Conversely, failure at YPP will be great challenge on further downward action.
We’re speaking about both scenarios, because fundamental comments of current week do not show any agreement in investors’ opinion concerning EUR. Some analysts even think that until US applies dovish policy EUR depreciation will be limited despite how dovish ECB. Thus, with fundamental indecision we have to closely watch for definite patterns and key levels. Now they are YPP and potential grabber.
By looking at bigger picture, market stands in tight range since 2014. Thus, 1.33-1.3850 is an area of “indecision”. While market stands inside of it we can talk about neither upward breakout nor downward reversal. At least, reversal identification could be done with yearly pivot – if market will move below it, this could be early sign of changing sentiment. But, as you can see, nothing among this issues have happened yet.
That’s being said, market stands around crucial area and June could clarify what will happen next.
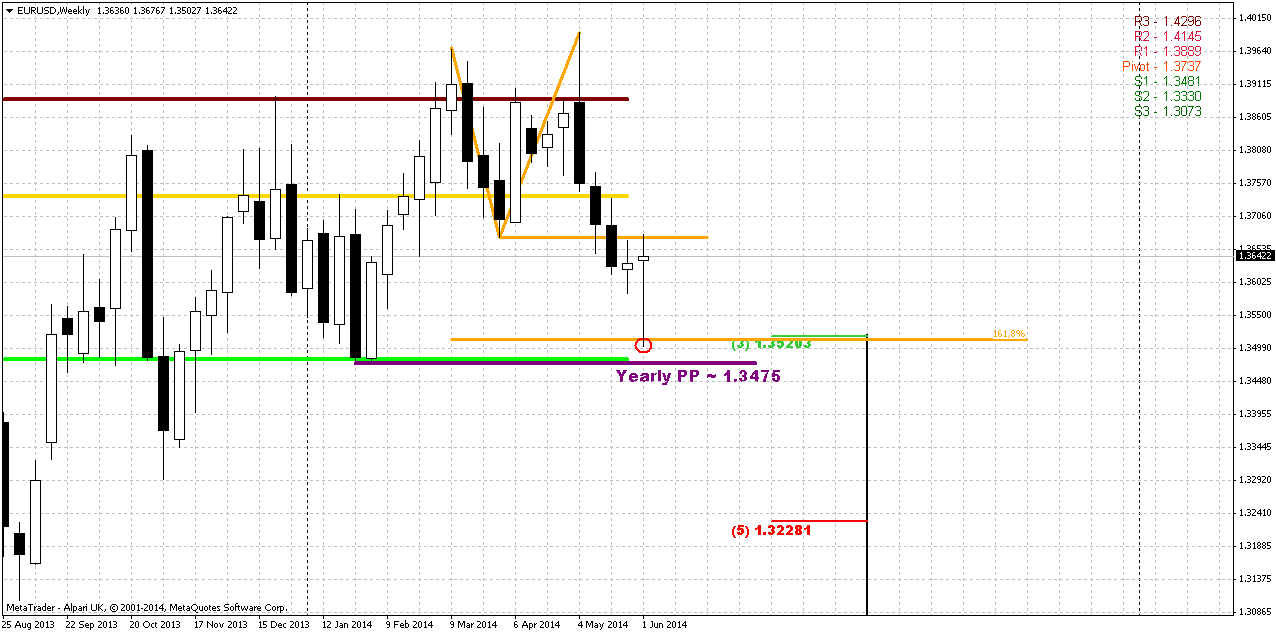
Weekly
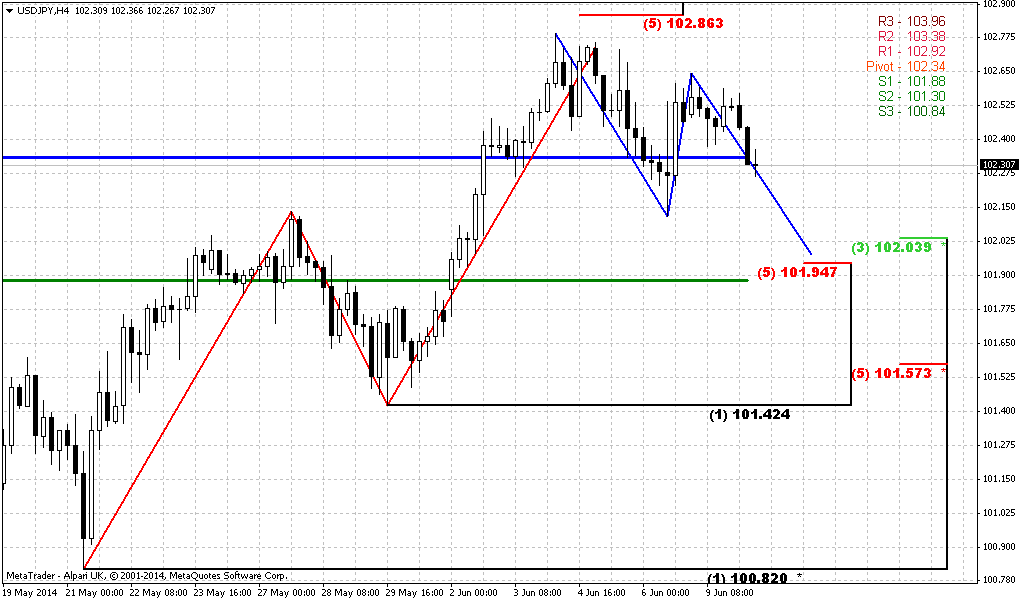
Weekly trend is bearish, but market is not at oversold. Actually, guys, our minimum program has been completed. Month ago when 1.27 Butterfly “Sell” has been completed, we said that market should reach at least 3/8 Fib support at 1.3520 area. This has happened yesterday and butterfly has worked well. Right now situation on weekly chart is relatively simple. We have solid hammer pattern that stands upon strong support area – YPP, MPS1 and Fib level. Nearest perspecitve that we will deal with on coming week is respect of this level, i.e. bounce up. Medium term task is choosing a direction.
We will point on bearish trend only if market will move below YPP and take out lows of hammer pattern. This also will mean that monthly trend shifts bearish. Otherwise bullish perspective will dominate over market and there are some reasons for that. First is – weekly butterfly. Yes, market has hit 1.27 and shown 3/8 retracement, but this is not neccesary means the end of the game. As market will return right back up – it could mean that price will proceed to 1.618 target. Second – patterns on monthly, that we’ve just spoken about. I mean bullish grabber. But if even we will not get it, but market will continue move up this still will suggest existing of bullish sentiment, since price still will be above YPP and grabber has chances to appear on July as well...
So, currently let’s focus on first task – possible bounce up on coming week, while directional task we will monitor gradually through all following weekly researches.
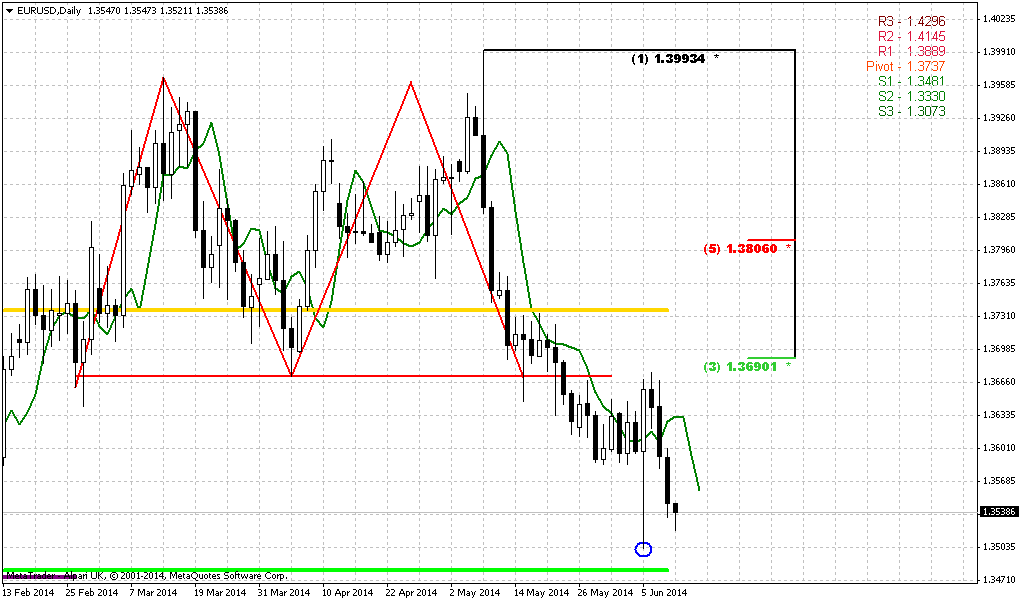
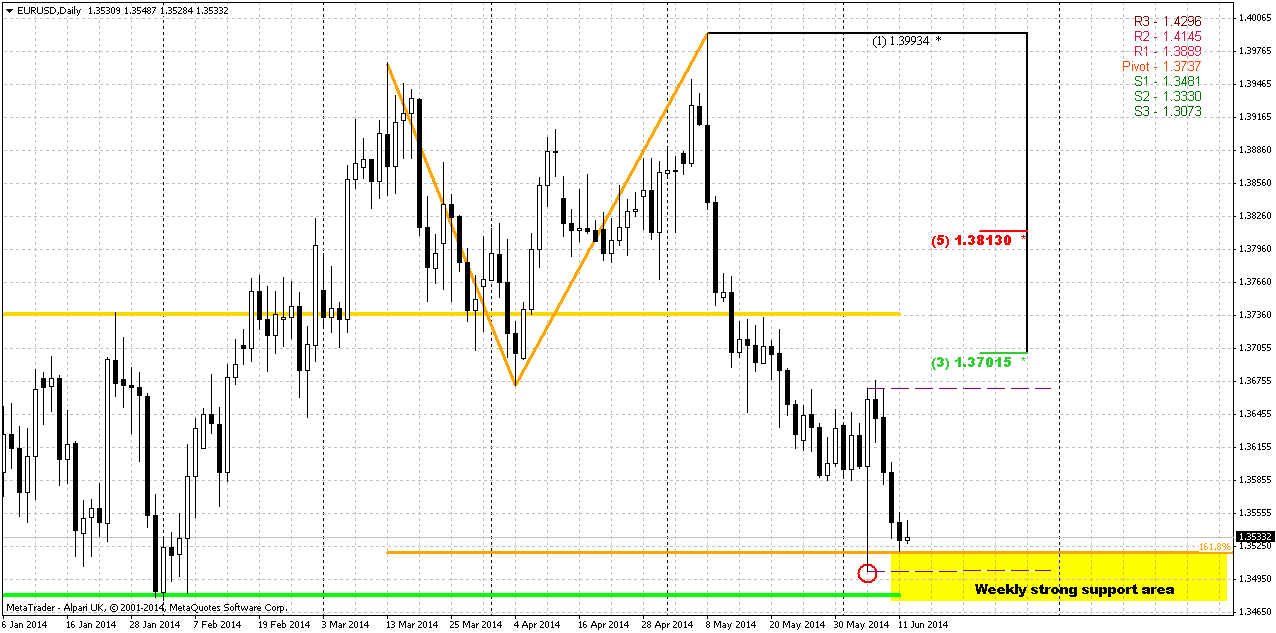
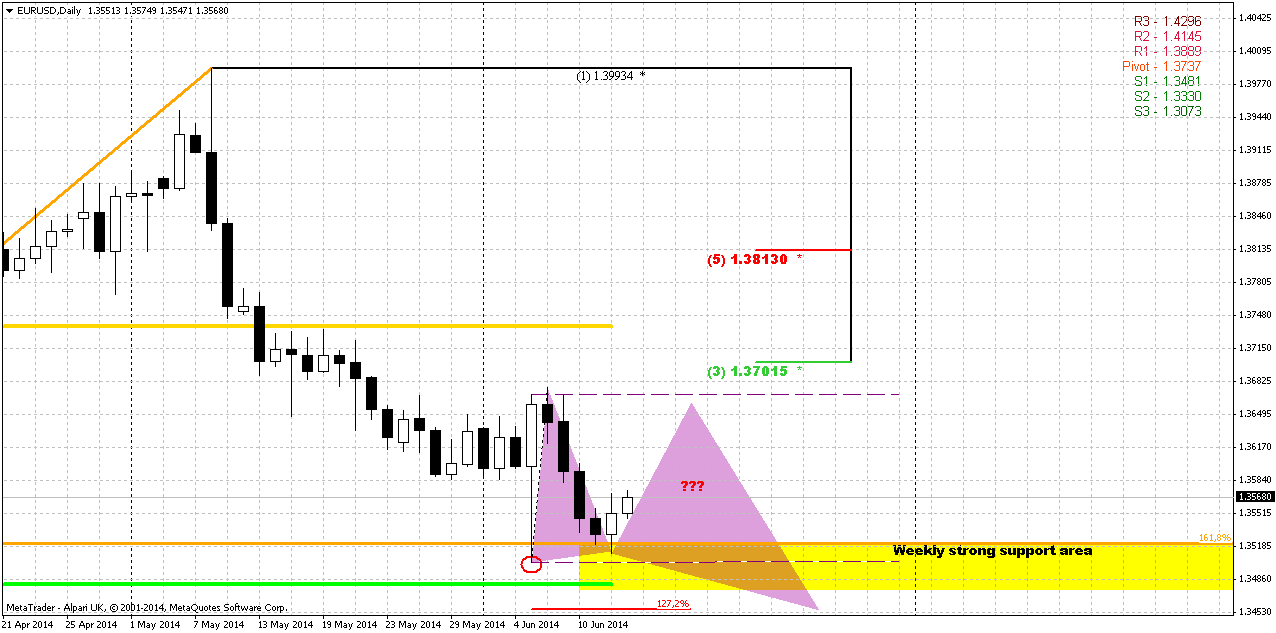
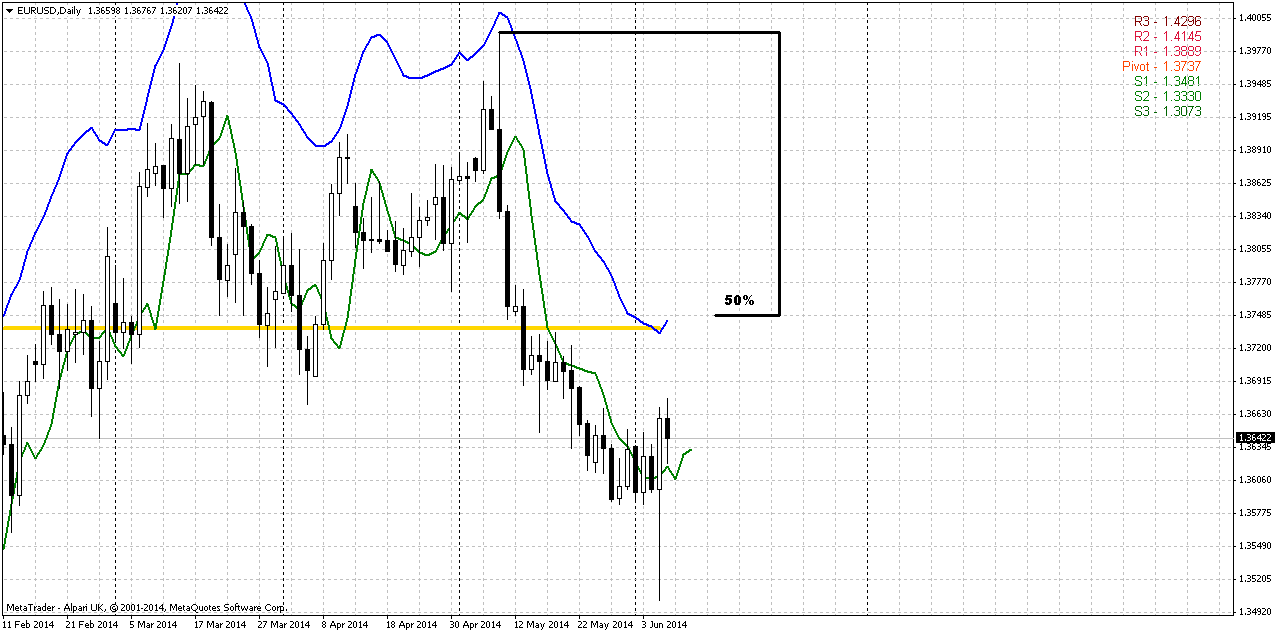
Daily
Daily trend has shifted bullish here, but this is not very important now, because we will make a deal with DiNapoli directional pattern, and direction overrules trend. As we’ve estimated on weekly chart – market stands and rock hard support area and MPP has not been tested yet. This moment pushes us to some conclusions.
Within previous couple of weeks we’ve talked about chances on appearing DiNapoli patterns – either B&B or DRPO, mostly because thrust down was really nice and at some time pattern should have to appear. And now this has happened. It looks a bit curious due ECB rate decision impact, but still this is DRPO “Buy” and it makes analysis of possible upward bounce relatively simple. The target of DRPO is 50% resistance of the whole thrust down and here this level coincides with daily overbought and MPP around 1.3750 area.
Now about former analysis, particularly about Double Top pattern, who we should treat it now… Well, it seems that 1.3750 retracement per se will not lead to failure of this pattern yet, because this area stands very close to the neckline and shy penetration of neckline is allowable. Here we will have to watch for following action. If market will hold above 1.3750 – this will be dangerous sign. Even more, this could become first loud bell on possible further upward action, because Double top is not just a pattern. This is the range either. Hence, if market returns right back inside the range after it was broken previously – it means that market will move to opposite border first and may be will show opposite breakout second.
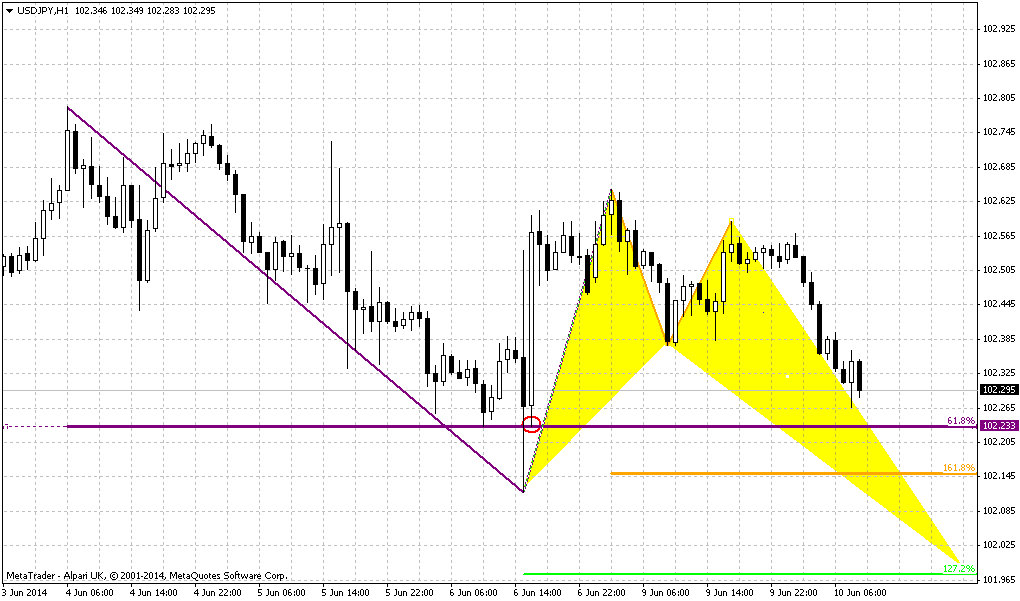
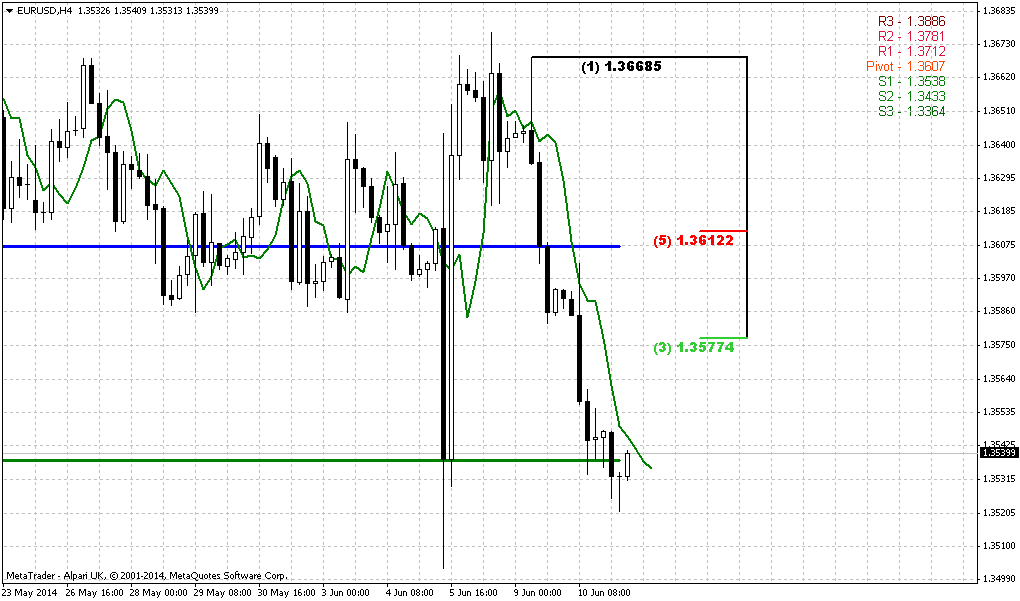
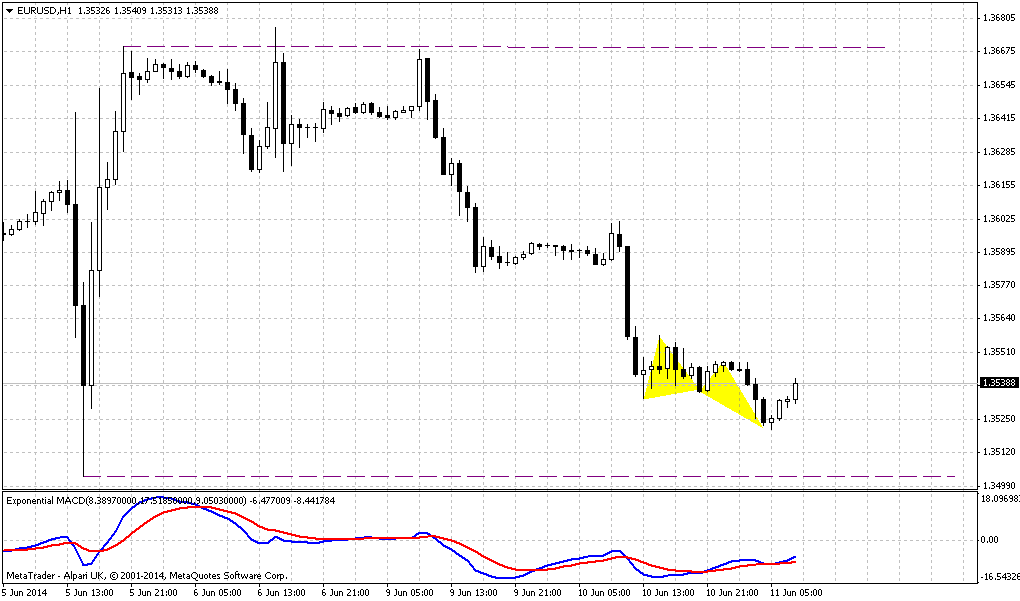
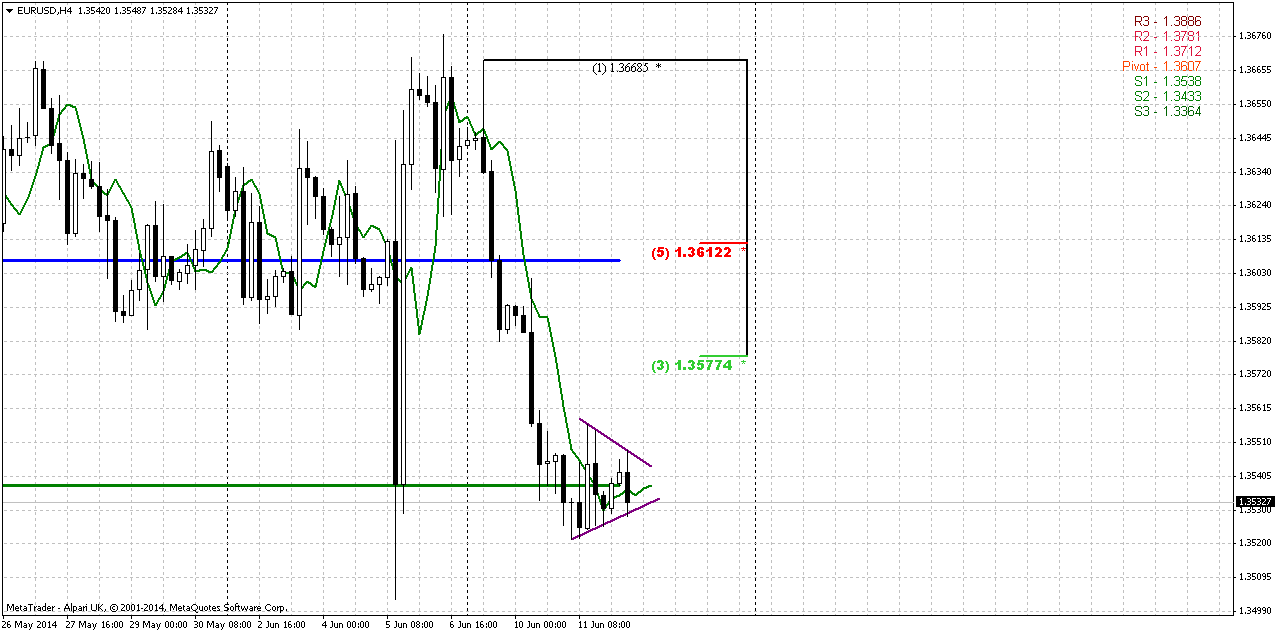
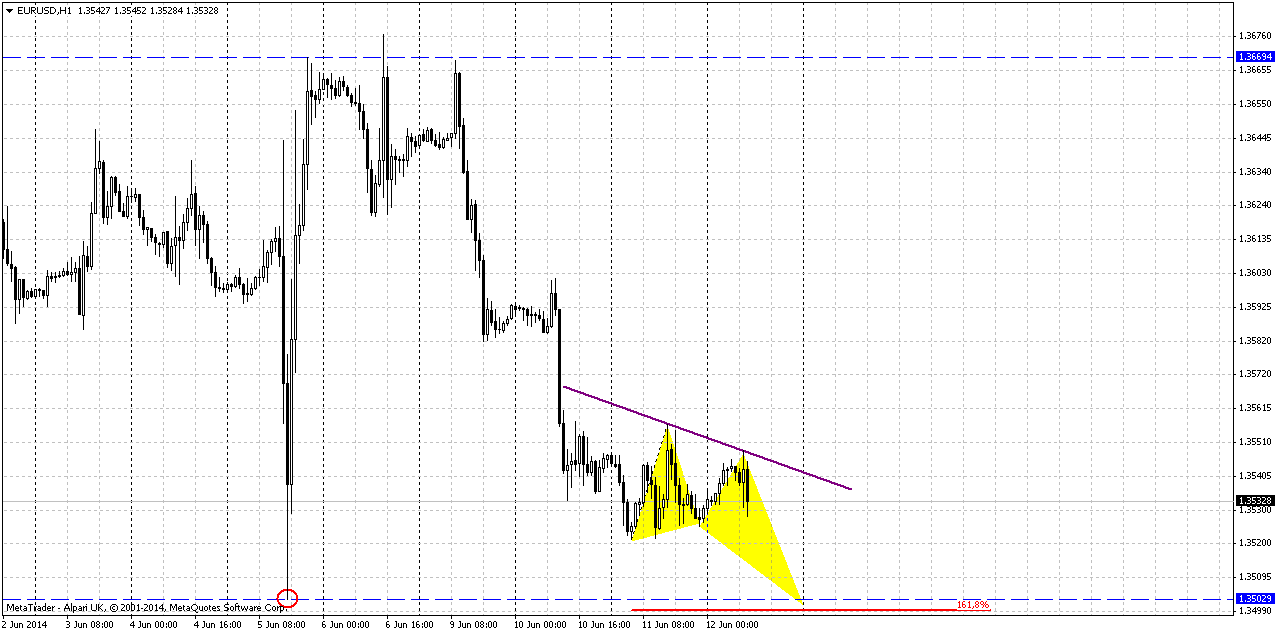
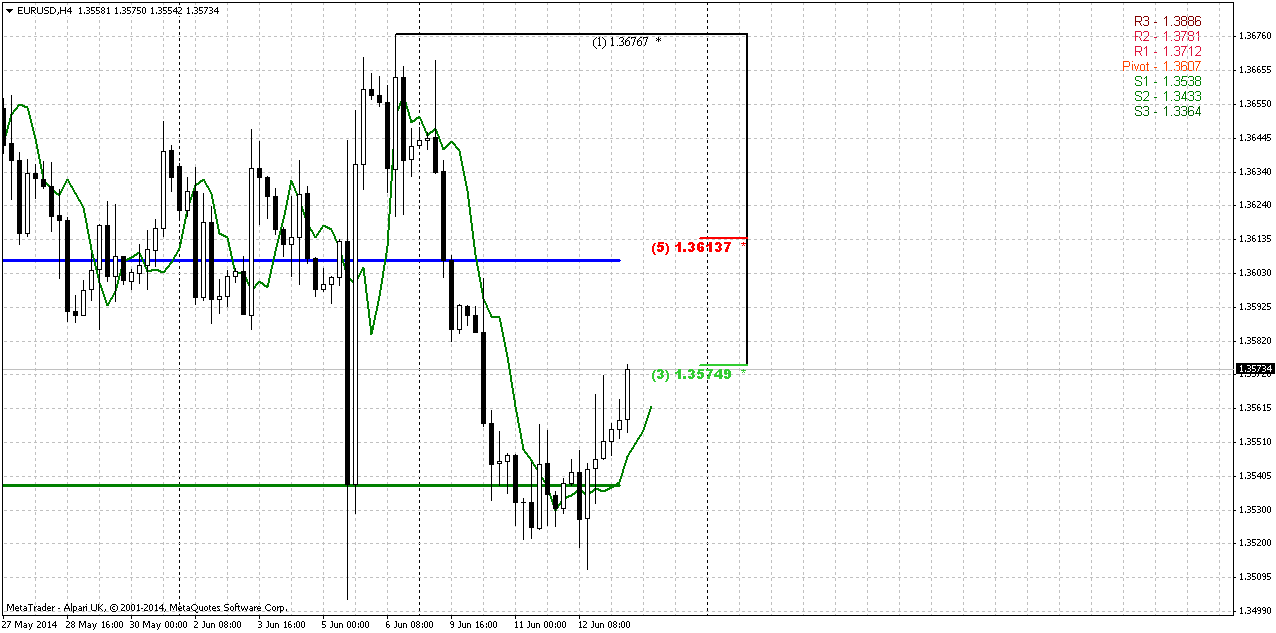
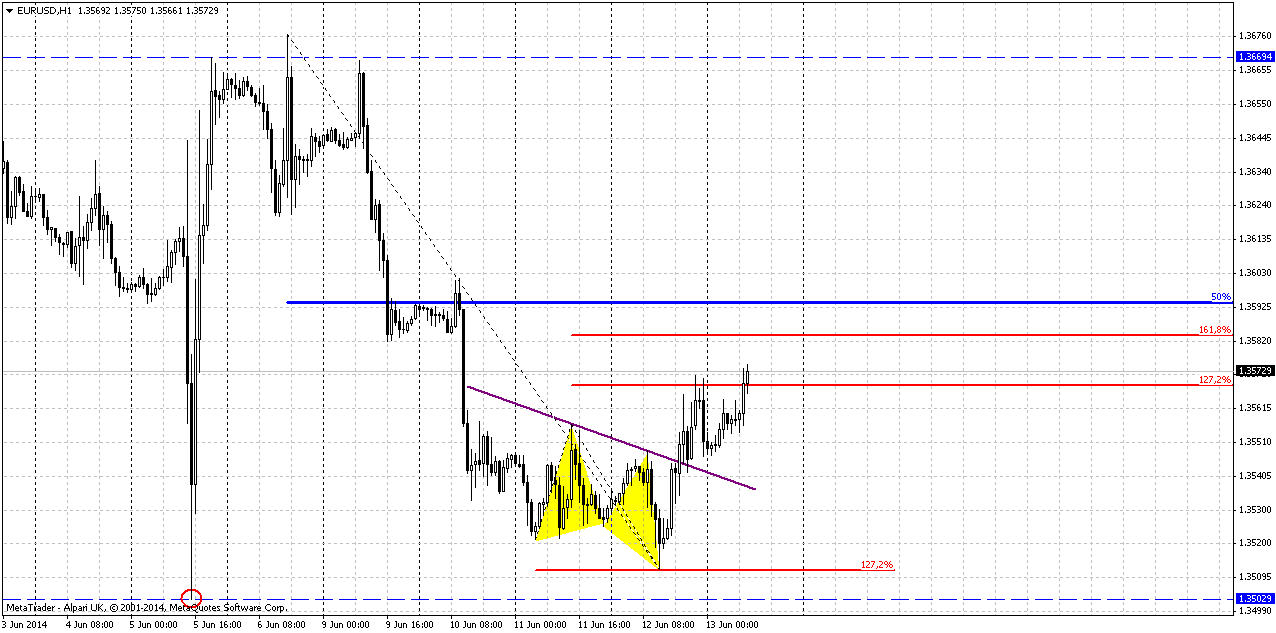
4-hour
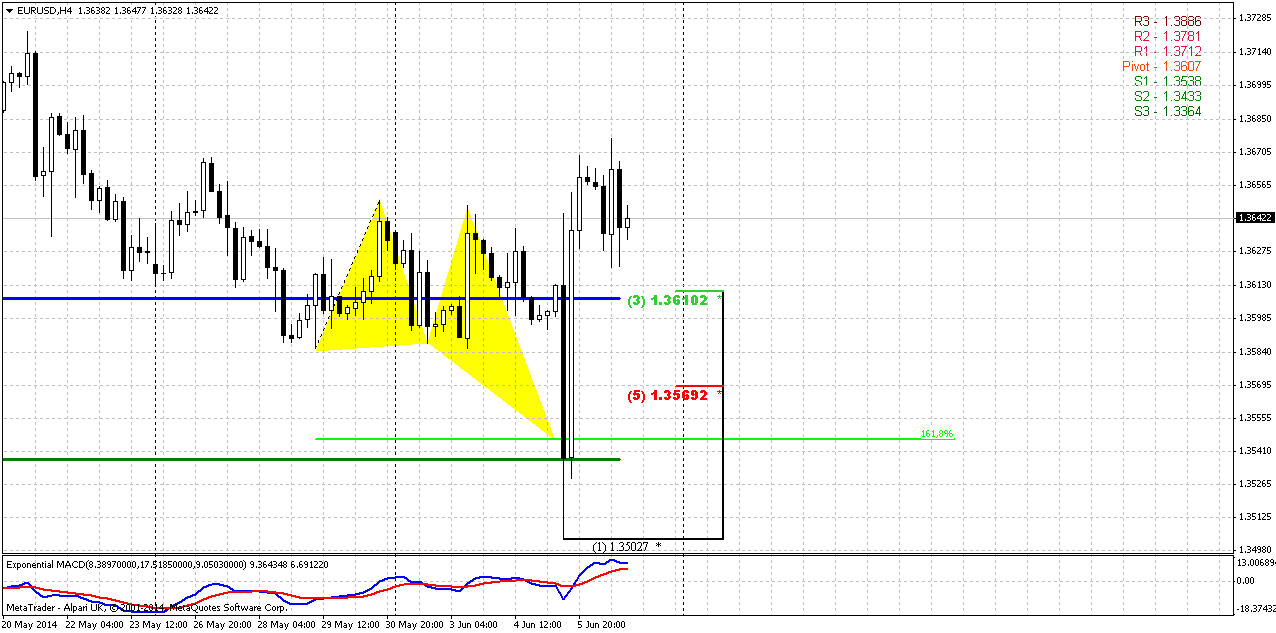
And finally 4-hour chart. Trend is bullish here. We also see that DRPO takes the shape of butterfly that a bit overextended to the downside due ECB rate decision. At the same time butterfly is reversal pattern and market has formed huge bullish engulfing, may be it could be treated here even as Rail Road Tracks (RRT – DiNapoli directional pattern that has some specific features). Anyway, this pattern suggests upward action equals to the length of the bars and could be AB-leg of AB=CD upward pattern. Here we should be focused on small downward retracement inside the body of this pattern. Probably we should watch for 1.3585-1.3610 area. This is the range between 50% support (EUR likes this ratio) and 1.3610 – combination of WPP and first Fib support level. It would be nice if market will hold above WPP and confirm its bullishness to give us confidence of upward continuation.
Conclusion:
While price stands in 1.33-1.38 area we can’t speak either on upward or downward breakout. To change really big picture market should have to show breakout out of it. Still, market right now stands around crucial area – combination of YPP and monthly MACDP. Appearing of bullish grabber in June or July could resolve the riddle fast on further action. Conversely moving below YPP will shift monthly trend bearish as well and could lead to further EUR depreciation.
On coming week we mostly will deal with respect of current 1.35-1.3520 support area and upward bounce. Minimum target of this bounce stands around 1.3750 area. As market already has formed reversal patterns as on daily as on intraday charts – our primary task on Monday is watching on intraday retracement down.
The technical portion of Sive's analysis owes a great deal to Joe DiNapoli's methods, and uses a number of Joe's proprietary indicators. Please note that Sive's analysis is his own view of the market and is not endorsed by Joe DiNapoli or any related companies.
The U.S. dollar recouped losses Friday as investors added to a well-worn pattern of borrowing greenbacks to buy higher-yielding currencies after solid U.S. jobs data left little chance the Federal Reserve would speed up monetary tightening. This follows Thursday's long-promised steps by the European Central Bank to boost the level of monetary stimulus into the euro zone economy, which, over time, puts pressure on investors to sell euros and buy higher-yielding currencies. "One central bank providing liquidity and another seeing data that is not going to change its mind on removing liquidity or the pace of normalization leads to an environment where risk is back on the table for the carry trade. That also benefits emerging market currencies," said Steven Englander, global head of G10 FX strategy at CitiFX in New York.
The euro gyrated after the data, initially selling off but then catapulting to a fresh, but brief, two-week high of $1.3677. Since then, it has settled back down 0.13 percent at $1.3641, just beneath the 200-day moving average.
The data, which showed the U.S. economy added 217,000 non-farm jobs against the Reuters consensus forecast of 218,000, brought employment to its pre-recession levels and indicated an economy that had snapped back from a harsh winter.
It may take until next week for the dust to settle on the ECB's moves, making good on hints that it would take strong action to both support the economy and, in passing, halt gains for the euro which have driven inflation below targets.
"Nothing really has changed in the U.S. scenario and I don't think the dust has settled from the ECB. The fact is the euro is lower than when we wholly anticipated the easing (by the ECB)," said Robert Lynch, head of G10 FX strategy at HSBC in New York.
Since the May 8 ECB policy meeting, when expectations grew for the central bank to loosen policy, the euro has dropped nearly 2 percent against the dollar and it is now down 0.80 percent year-to-date. Investors had been caught by the euro's four percent rise between January and the start of May, an unexpected scenario given bets the removal of policy accommodation by the Fed was expected to boost the dollar. But the Fed's slow and steady message of a dovish outlook for monetary policy remains intact despite stronger data. The conclusion of many from Thursday's ECB decision is that the ECB on its own will struggle to weaken the single currency. "It is still all about the Fed," said one London-based dealer. "Until we get more certainty about the prospect of stronger growth and higher interest rates in the United States, there are too many other factors in the euro's favor."
Technical
Although April was upward month, but overall action mostly should be classified as “inside” one to March range. Almost whole April price has spent in the same range. At the same time May action has shown its power. Although this has happened not quite independently but having ECB hand in EUR dynamic, still, technically we’ve got reversal bar on monthly chart. We saw something cognate on February action, but it didn’t lead to any downward continuation. At the same time, currently situation is slightly different because there was no solid upward action in April, and now we have a month candle that has moved above April high and close below it’s low and this could lead at least to some downward continuation. Part of this work has been done already and is continued on recent week. Now market stands at very significant moment. It has closely approached to Yearly Pivot point and monthly MACDP. If we will get lucky, we could get clarification in June for extended period. Thus, appearing of bullish grabber right at YPP level definitely will tell us that market should exceed 1.40 level and probably will reach YPR1~1.42 area. Conversely, failure at YPP will be great challenge on further downward action.
We’re speaking about both scenarios, because fundamental comments of current week do not show any agreement in investors’ opinion concerning EUR. Some analysts even think that until US applies dovish policy EUR depreciation will be limited despite how dovish ECB. Thus, with fundamental indecision we have to closely watch for definite patterns and key levels. Now they are YPP and potential grabber.
By looking at bigger picture, market stands in tight range since 2014. Thus, 1.33-1.3850 is an area of “indecision”. While market stands inside of it we can talk about neither upward breakout nor downward reversal. At least, reversal identification could be done with yearly pivot – if market will move below it, this could be early sign of changing sentiment. But, as you can see, nothing among this issues have happened yet.
That’s being said, market stands around crucial area and June could clarify what will happen next.
Weekly
Weekly trend is bearish, but market is not at oversold. Actually, guys, our minimum program has been completed. Month ago when 1.27 Butterfly “Sell” has been completed, we said that market should reach at least 3/8 Fib support at 1.3520 area. This has happened yesterday and butterfly has worked well. Right now situation on weekly chart is relatively simple. We have solid hammer pattern that stands upon strong support area – YPP, MPS1 and Fib level. Nearest perspecitve that we will deal with on coming week is respect of this level, i.e. bounce up. Medium term task is choosing a direction.
We will point on bearish trend only if market will move below YPP and take out lows of hammer pattern. This also will mean that monthly trend shifts bearish. Otherwise bullish perspective will dominate over market and there are some reasons for that. First is – weekly butterfly. Yes, market has hit 1.27 and shown 3/8 retracement, but this is not neccesary means the end of the game. As market will return right back up – it could mean that price will proceed to 1.618 target. Second – patterns on monthly, that we’ve just spoken about. I mean bullish grabber. But if even we will not get it, but market will continue move up this still will suggest existing of bullish sentiment, since price still will be above YPP and grabber has chances to appear on July as well...
So, currently let’s focus on first task – possible bounce up on coming week, while directional task we will monitor gradually through all following weekly researches.
Daily
Daily trend has shifted bullish here, but this is not very important now, because we will make a deal with DiNapoli directional pattern, and direction overrules trend. As we’ve estimated on weekly chart – market stands and rock hard support area and MPP has not been tested yet. This moment pushes us to some conclusions.
Within previous couple of weeks we’ve talked about chances on appearing DiNapoli patterns – either B&B or DRPO, mostly because thrust down was really nice and at some time pattern should have to appear. And now this has happened. It looks a bit curious due ECB rate decision impact, but still this is DRPO “Buy” and it makes analysis of possible upward bounce relatively simple. The target of DRPO is 50% resistance of the whole thrust down and here this level coincides with daily overbought and MPP around 1.3750 area.
Now about former analysis, particularly about Double Top pattern, who we should treat it now… Well, it seems that 1.3750 retracement per se will not lead to failure of this pattern yet, because this area stands very close to the neckline and shy penetration of neckline is allowable. Here we will have to watch for following action. If market will hold above 1.3750 – this will be dangerous sign. Even more, this could become first loud bell on possible further upward action, because Double top is not just a pattern. This is the range either. Hence, if market returns right back inside the range after it was broken previously – it means that market will move to opposite border first and may be will show opposite breakout second.
4-hour
And finally 4-hour chart. Trend is bullish here. We also see that DRPO takes the shape of butterfly that a bit overextended to the downside due ECB rate decision. At the same time butterfly is reversal pattern and market has formed huge bullish engulfing, may be it could be treated here even as Rail Road Tracks (RRT – DiNapoli directional pattern that has some specific features). Anyway, this pattern suggests upward action equals to the length of the bars and could be AB-leg of AB=CD upward pattern. Here we should be focused on small downward retracement inside the body of this pattern. Probably we should watch for 1.3585-1.3610 area. This is the range between 50% support (EUR likes this ratio) and 1.3610 – combination of WPP and first Fib support level. It would be nice if market will hold above WPP and confirm its bullishness to give us confidence of upward continuation.
Conclusion:
While price stands in 1.33-1.38 area we can’t speak either on upward or downward breakout. To change really big picture market should have to show breakout out of it. Still, market right now stands around crucial area – combination of YPP and monthly MACDP. Appearing of bullish grabber in June or July could resolve the riddle fast on further action. Conversely moving below YPP will shift monthly trend bearish as well and could lead to further EUR depreciation.
On coming week we mostly will deal with respect of current 1.35-1.3520 support area and upward bounce. Minimum target of this bounce stands around 1.3750 area. As market already has formed reversal patterns as on daily as on intraday charts – our primary task on Monday is watching on intraday retracement down.
The technical portion of Sive's analysis owes a great deal to Joe DiNapoli's methods, and uses a number of Joe's proprietary indicators. Please note that Sive's analysis is his own view of the market and is not endorsed by Joe DiNapoli or any related companies.