Sive Morten
Special Consultant to the FPA
- Messages
- 18,669
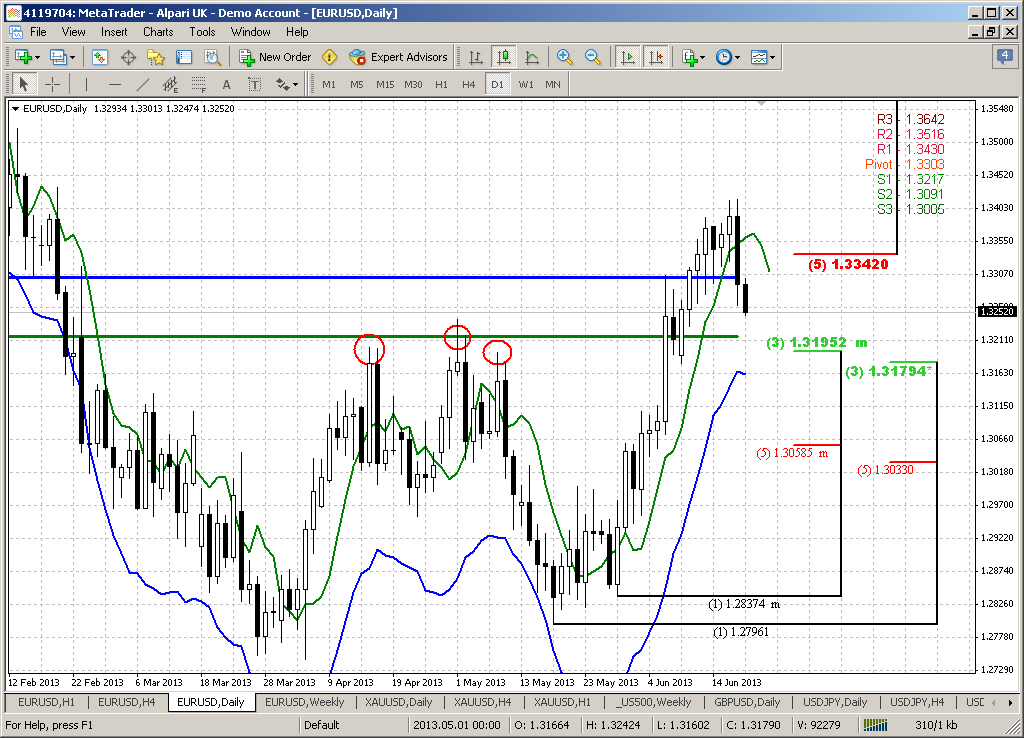
Today, guys I decide to shift to Japanese yen. Although mostly I prepare researches on EUR, but currently situation on Yen is worthy of our attention and we just can’t ignore it. As technically as fundamentally situation on yen carries a lot of oportunities. Besides, on EUR at current moment there are no significant clarification concerning our question – market still stands around 5/8 major resistance. It does not mean that we will dedicate to yen the whole week. We definitely will continue with EUR as soon as something new will appear there. But since major interesting moments now stand on long-term charts of the yen, we will take a look at it in our weekly recearch.
In general you probably know what is going on in Japanese economy. New finance cabinet takes course on exit from 2 decades deflation in economy and would like stimulate industrial production and trigger some reasonable inflation by making yen weaker. This is neccesary since Japanese economy export-oriented and it should have advantage with rivals in term of production costs. Thus weak national currency is absolutely neccesary for that. Minister of Finance starts to spend significant amount on liquidity on these objects by investing in different national programs. That is not new story.
Speaking about current situation, why there was huge plunge on Nikkei and 2 week yen appreciation. In two words it could be described as investor’s indecision. As Reuters said – investors close trades against the yen due to uncertainty whether central banks will maintain their easy monetary policies. With the Federal Reserve's next policy meeting just a few days away (18-19 June), there has been increasing focus - and growing uncertainty - over when the U.S. Federal Reserve might pull back from flooding the market with dollars, a policy meant to spur borrowing and investment to bolster a sluggish economy. In addition, doubts over the Bank of Japan's commitment to its inflationary policies has caused some investors to exit their use of profitable carry trades in the yen. That practice involves using the low-yielding yen to fund purchases of higher-yielding assets, such as U.S. stocks. The carry trade has been put on the shelf until we get more certainty on U.S. monetary policy. These short-yen positions that invested in equities and other high yielding assets outside of Japan have been brutalized recently due to a drop in both the Nikkei and the Dow and yen strength. The Fed will meet on Tuesday and Wednesday, and the U.S. central bank's policy statement that will be released at the close of the meeting and the news conference by Fed chief Ben Bernanke will be scrutinized for clues on when the Fed might start to pull back on its stimulus program. Trading in the dollar-yen has been locked in step with Japan's benchmark Nikkei 225 index in recent weeks as investors unravel the sell-yen, buy-stocks trade that dominated the market between November and May. Fall in equities also forces investors to pare the dollar hedges initially put in place to protect them from a weakening yen.
That is official news. Since Fed meeting will take place on next week, it also could become the triggering moment for technical trades and patterns that we will take a look on. Why this could impact on the market?
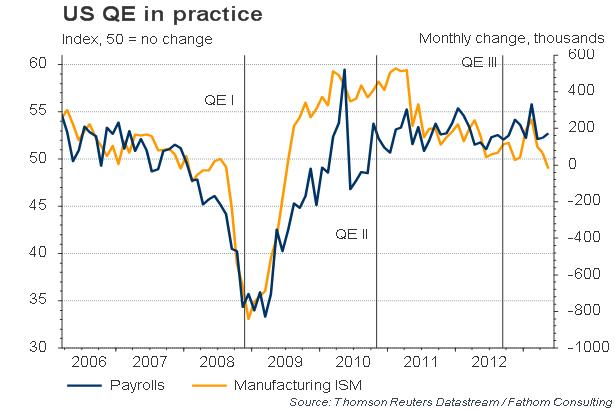
On the chart we see that QE II and QE III show no positive impact on employment and manufacturing. Everybody knows currently that this liquidity mostly was not invested in real sector, credits, loans etc. Most part of this money now is in stock bubble and despite how curious it will sound – real estate market. Yes, price on homes in US is growing much faster than the real economy and there are warnings exists among economists that it is still possible another crisis that now will have a target on saving FHA. US taxpayers already have paid about 195 Bln for saving Fannie May and Freddie Mac, but with FHA they will have to pay 115 Bln more. Since risk of inflation gradually is growing, despite how anemic it is currently, inflow another 115 Bln could have significant impact on US economy. But this is rumors yet.
The first reaction if Fed will give clear hint on closing QE program, will be probably drop on stock market since liquidity flow will be closed and jump in US dollar, because it will simultaneously mean that Fed sees either inflation risks and/or economy improvement signs. But we will see. Anyway, Fed meeting has a lot of chances to trigger significant moves on Forex market and particularly the yen and make patterns that we have now operational. Let’s take a look at them.
Monthly
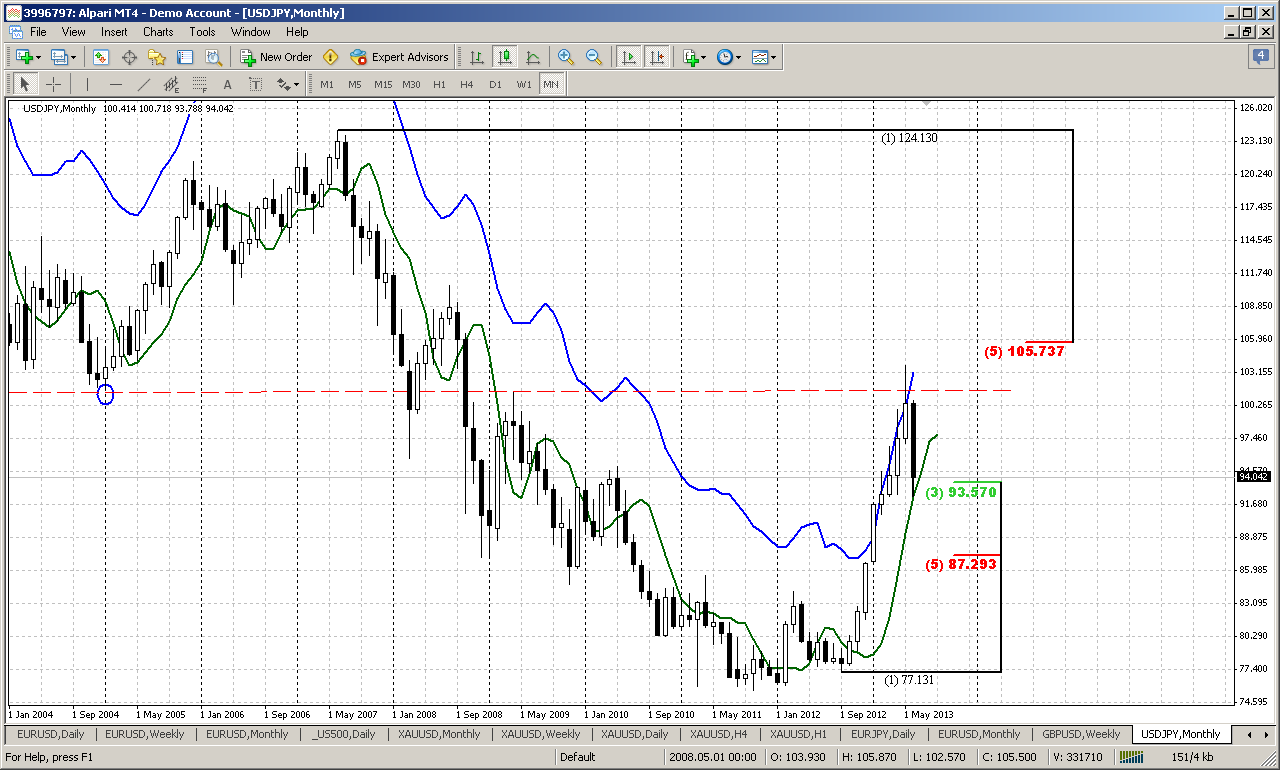
Yen monthly chart is very informative as for those traders who hold positions within months as for traders who trade on lower time frames. Trend is bullish here, and market has exceeded as Yearly pivot (around 83) as Yearly PR1 (around 90.16). This tells us that current move up probably is not just a retracement after solid downard trend, but it could medium-term reversal. And rest of the year tendency could continue. Yes, it could be some retracements and pullbacks, but upward tendency has nice chances to hold.
Second moment is – market has shown first upward swing that is greater than previous swing down and broken lower -highs, lower-lows tendency. This confirms first conclusion about possible upward continuation, but also warning us about possible compounded deep retracement. In most cases due previous strong downward momentum market shows AB-CD retracement down after reversal swing.
Third is market stands at resisance and overbought. Now it shows reasonable retracement down. If this situation to treat as “Stretch” pattern, then price stands very close to it’s target around 90-90.50 area – middle area between oversold/overbought bands (I do not have oversold band here, but I’ve checked the level).
Finally the fourth – this is context for DiNapoli B&B “Buy” trade. This definitely will not be DRPO, since market already has hit major 3/8 Support. But B&B trade has not been confirmed yet, since we do not have close below 3x3 line. Now we have only minimum required bars in up thrust (8 bars) and reaching significant support level. What kind of action we could see here? The perfect and mostly desirable scenario will be if price will continue slightly lower in June and hit 50% support around 90.50 area. This will be fastest B&B development.
But if market will show upward move istead and show long upward candle in July then B&B will be postponed. The chances are not great mostly due overbought condition, but this is possible if, for example BoJ will release some strongly supportive steps to announced policy of Yen weaken.
That’s being said in long-term perspective upward action probably will continue, but before that market will have to correct strong overbought condition and this could be done by directional trades, such as B&B. This will be solid assitance and advantage for us, because we will know the direction for the whole month and second – this could give us excellent oportunity to open long-term position on Yen appreaciation with minimum risk.
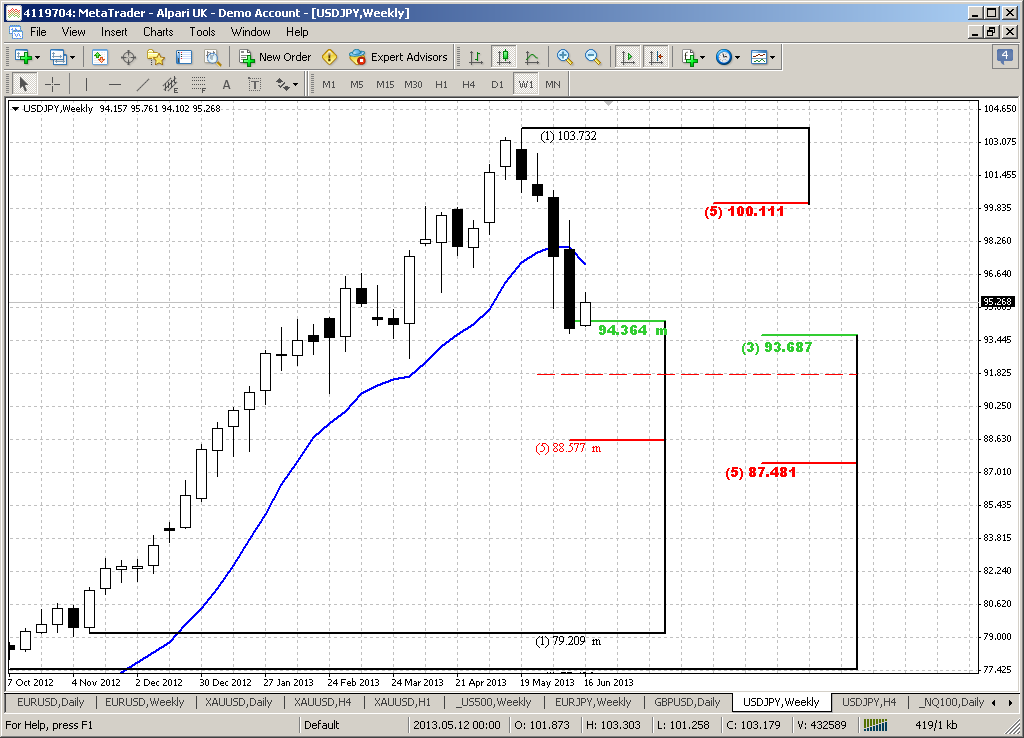
Weekly
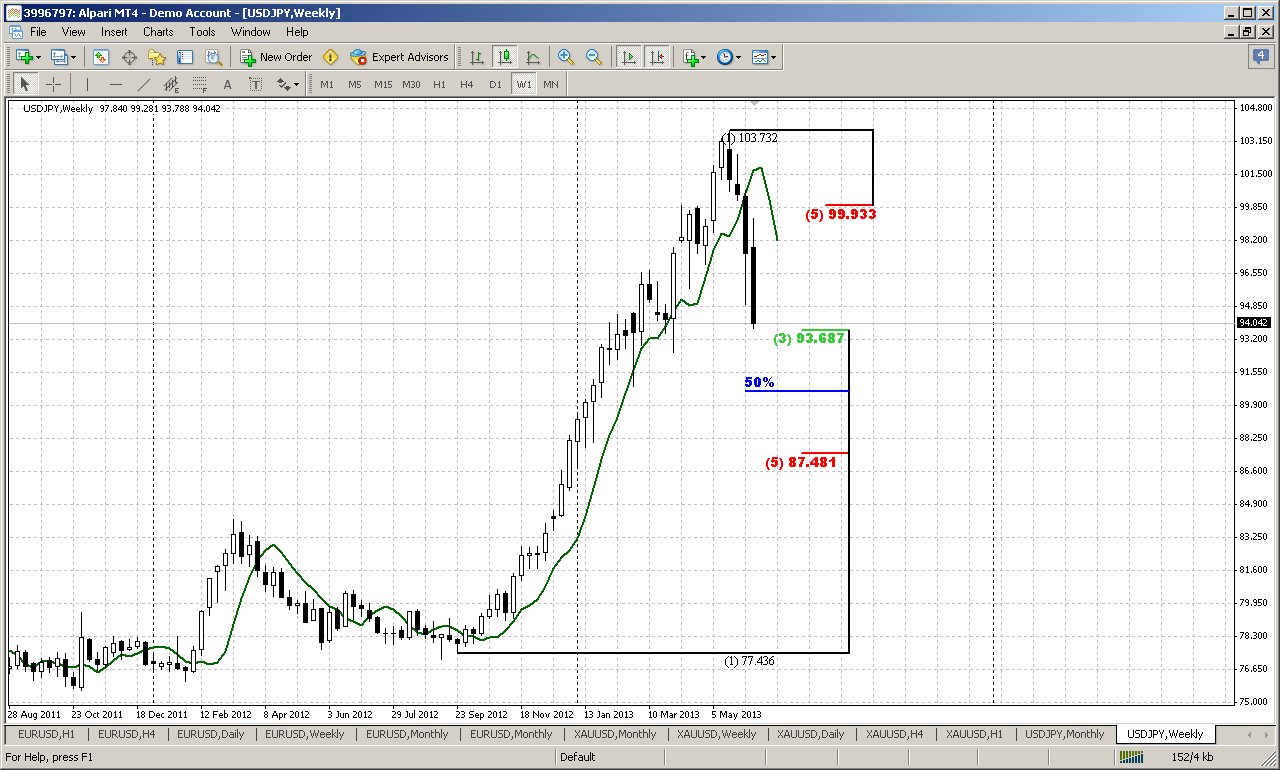
We’ve seen this picture in Friday’s daily video. In fact weekly chart is mostly significant for us, since it holds context for our trading on lower time-frames. Trend is bearish here, market is strongly oversold and has passed through all monthly support pivots, thus, I even do not have them on this chart. This is perfect setup of B&B “Buy” trade with minimum target around 100. Currently we do not know whether we will get B&B on monthly and when, how it will appear and so on, but here we have it and just wait at which level market will find support to show bounce up. Weekly pattern could coincide with monthly if market will bounce from 50% support area. But at some reason I suspect that bounce up could come from major 3/8 support and right at nearest Wed at FOMC meeting. So we will have to watch for reversal patterns around 93-94 area on lower time frames. They could give us the sign that weekly B&B has started.
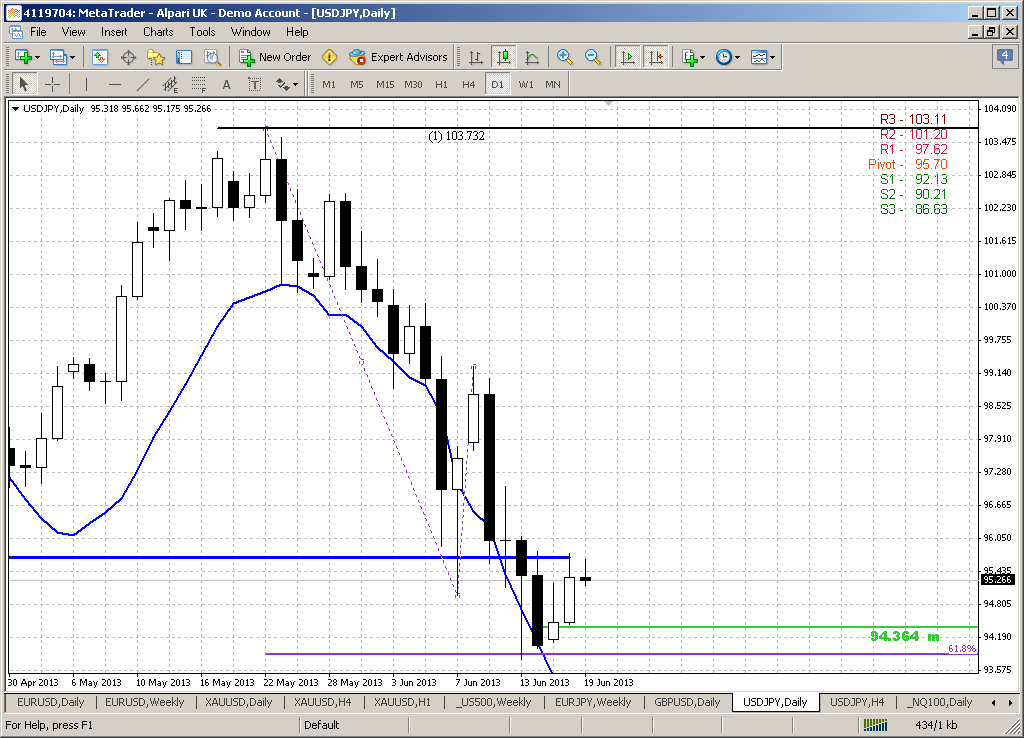
Daily
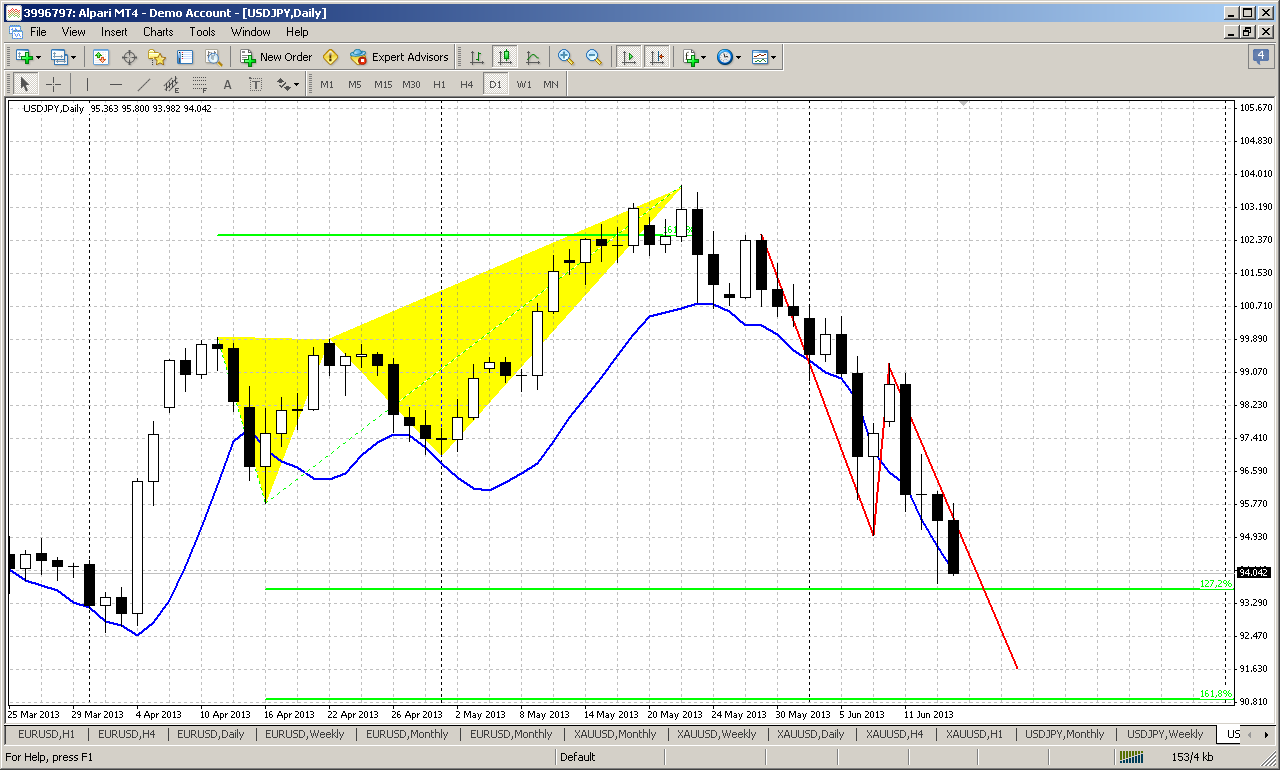
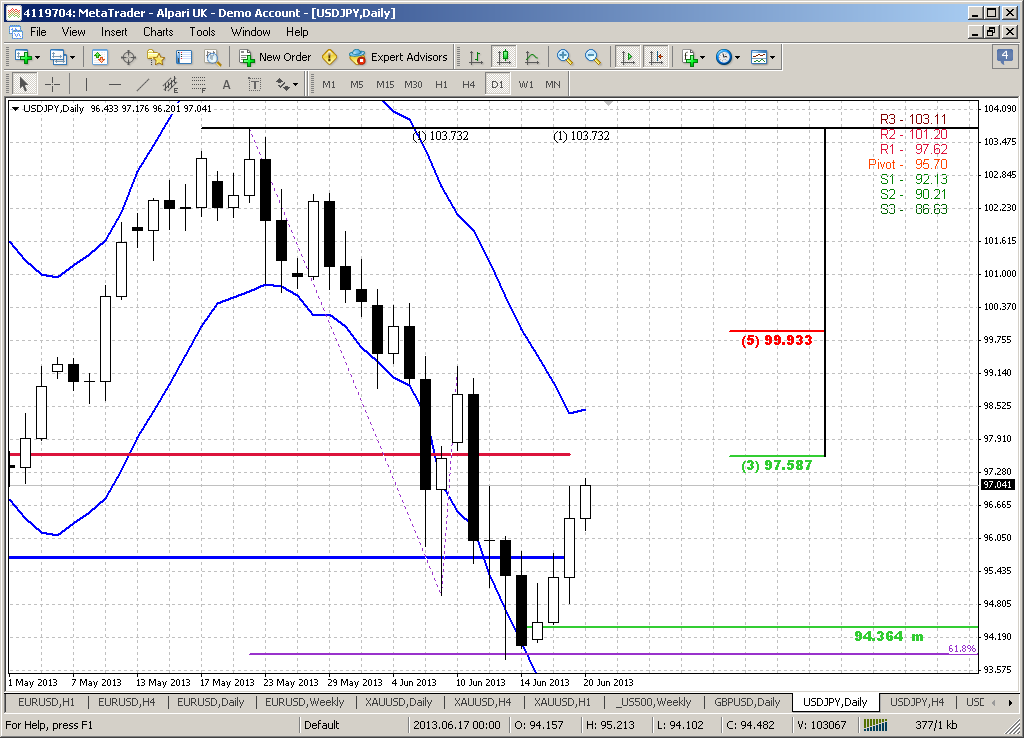
There is no much information on daily time frame yet. Unfortunately we haven’t take a look at Yen chart earlier – in April-May. It was butterfly “Sell” right at monthly resistance and oversold. Anyway, now market stands with downward move. All that I see here is just butterfly’s target levels and “lightning bolt” AB=CD pattern. Trend is bearish here and market oversold as well. 1.27 butterfly extension coincides with nearest major 3/8 level, while 1.618 stands slightly higher than 90.50 50% support level. AB-CD target is also stands around 50% weekly support. Currently is very difficult to understand whether market will start B&B right from current level of 3/8 major support or proceed slightly lower to 50%. Still, the precise entry point for us not as important as it could be on hourly chart, for instance, because this is weekly B&B. Even if we will miss precise entry point we will have a lot of time to open position on some retracement. But this does not release us from monitoring daily chart and looking for potentially upward reversal pattern.
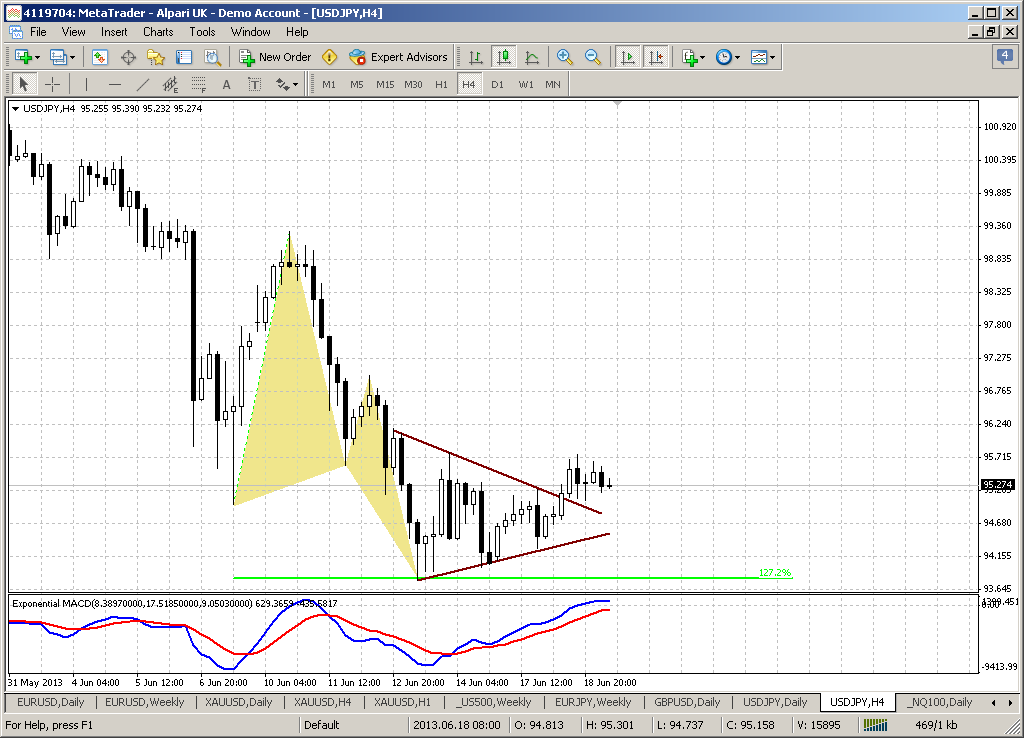
4-hour
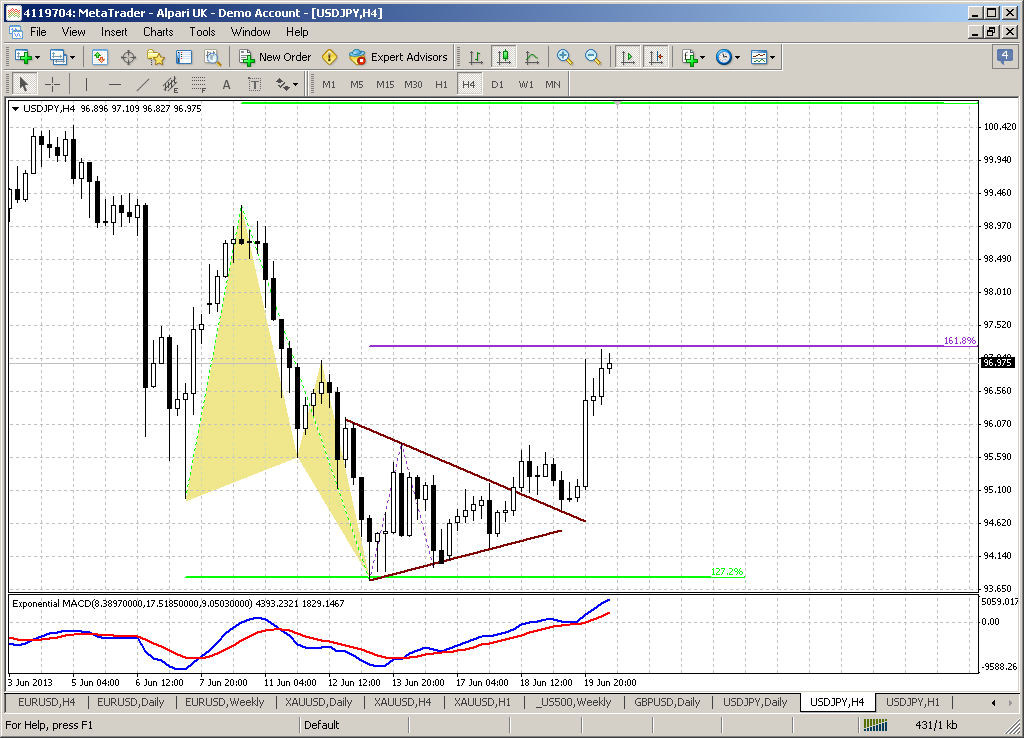
Looks like here we have something. This is potential Butterfly “Buy” with 1.618 target around major 3/8 support and 50 pips higher than daily AB-CD target. This butterlfy is accompanied by MACD bullish divergence and bearish dynamic pressure – see, trend holds bullish but price action moves lower. Also overall dynamic gradually is taking the shape of the wedge pattern. This increases bounce chances from our prespecified area of 91.50-92.20.
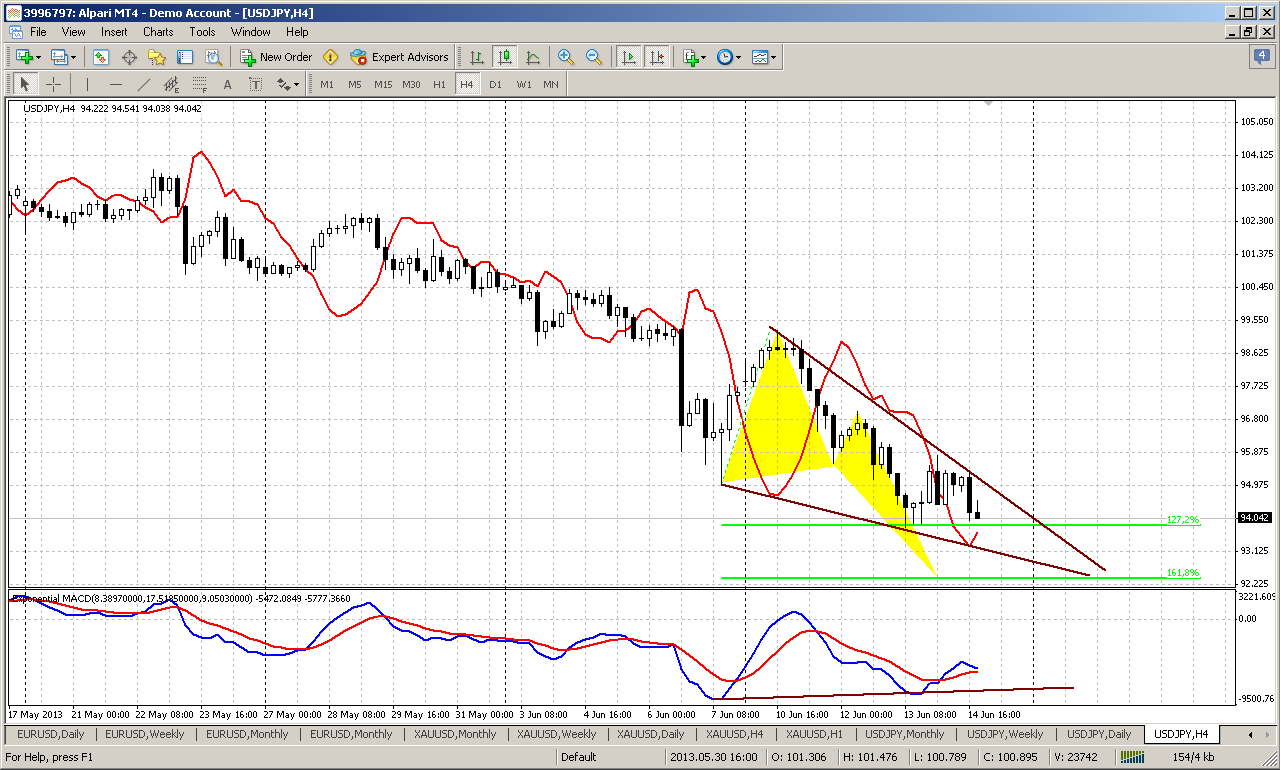
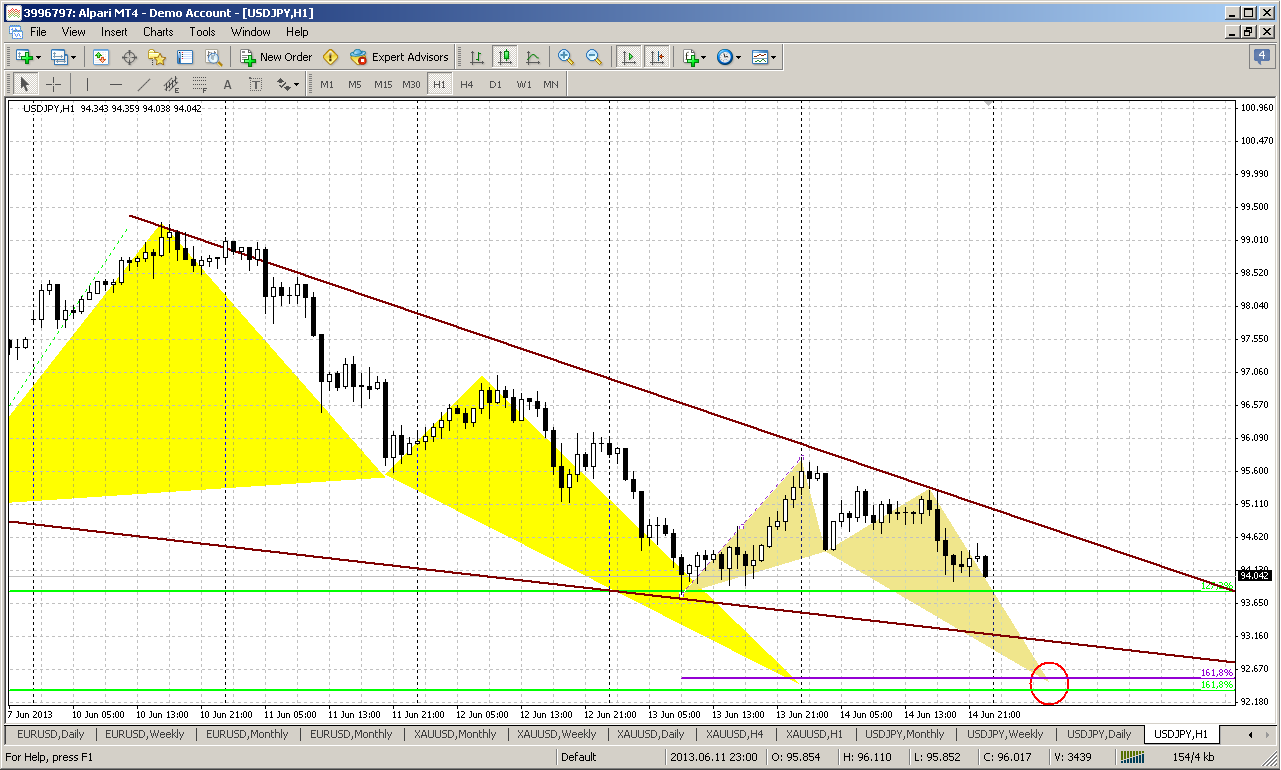
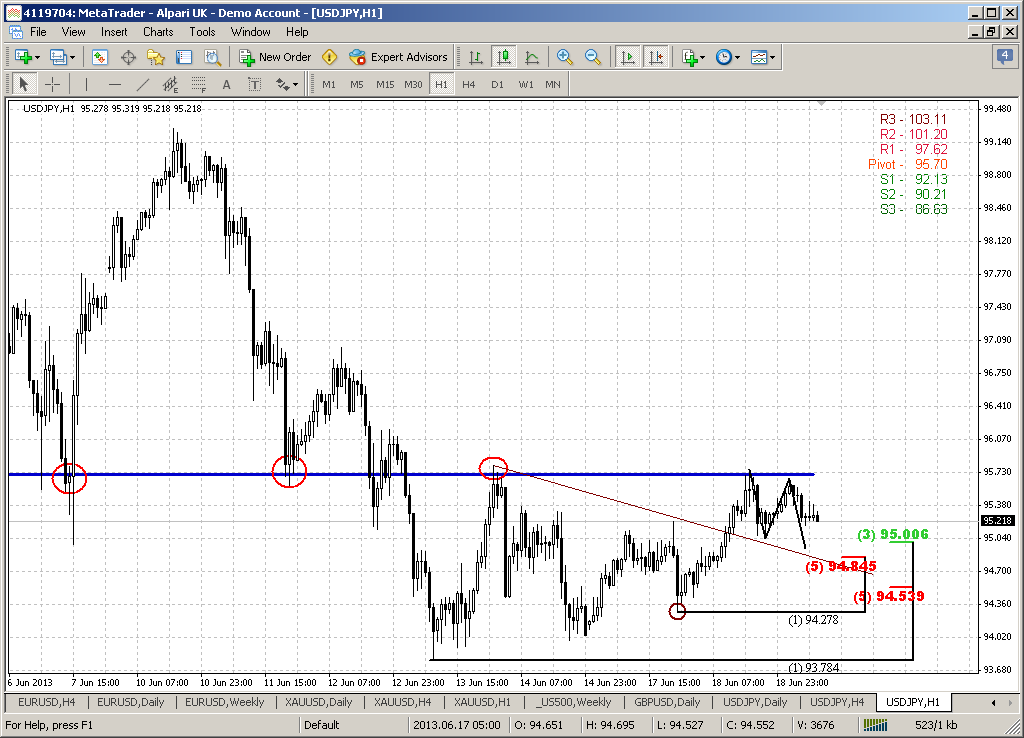
60-min
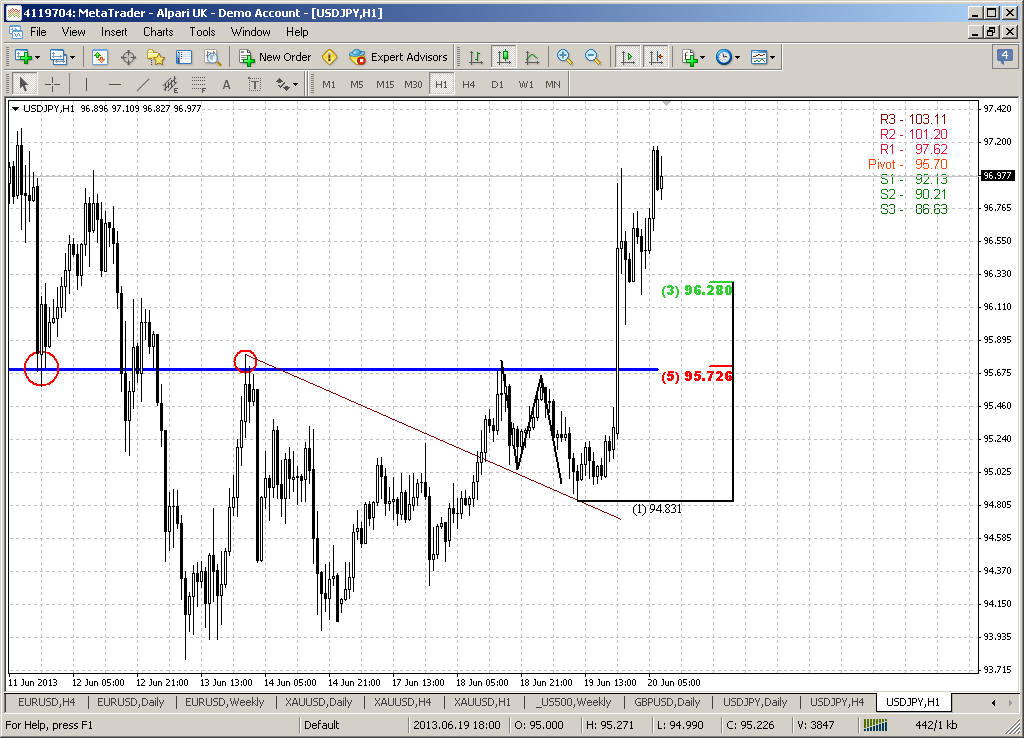
Trend is bearish here and we have another one smaller pattern, that has 1.618 target at the same area of 92.50 level. Well, probably these two butterflies should become the object of our close attention in the beginning of the week.
Conclusion:
Yen currently is a goldmine of contexts for trading at any taste – long-term, short-term, harmonic patterns, DiNapoli patterns.
Long-term picture points on possible upward continuation during second half of the year. But currently Yen is strongly overbought and probably will enter in phase of retracements and accommodation of current level. This in turn carries and gives us context for trading. Major pattern that we expect right now is B&B “Buy” on weekly time frame.
Since market now stands very close to major support level and shows the signs of exhausting on intraday charts, we will have to keep a close eye on 92.50 area on the next week, since market could start bounce from it. Target of possible move up is 100 area. As usual – if market will show fast acceleration through 92.50 – do not take long position and wait further clarification.
The technical portion of Sive's analysis owes a great deal to Joe DiNapoli's methods, and uses a number of Joe's proprietary indicators. Please note that Sive's analysis is his own view of the market and is not endorsed by Joe DiNapoli or any related companies.
In general you probably know what is going on in Japanese economy. New finance cabinet takes course on exit from 2 decades deflation in economy and would like stimulate industrial production and trigger some reasonable inflation by making yen weaker. This is neccesary since Japanese economy export-oriented and it should have advantage with rivals in term of production costs. Thus weak national currency is absolutely neccesary for that. Minister of Finance starts to spend significant amount on liquidity on these objects by investing in different national programs. That is not new story.
Speaking about current situation, why there was huge plunge on Nikkei and 2 week yen appreciation. In two words it could be described as investor’s indecision. As Reuters said – investors close trades against the yen due to uncertainty whether central banks will maintain their easy monetary policies. With the Federal Reserve's next policy meeting just a few days away (18-19 June), there has been increasing focus - and growing uncertainty - over when the U.S. Federal Reserve might pull back from flooding the market with dollars, a policy meant to spur borrowing and investment to bolster a sluggish economy. In addition, doubts over the Bank of Japan's commitment to its inflationary policies has caused some investors to exit their use of profitable carry trades in the yen. That practice involves using the low-yielding yen to fund purchases of higher-yielding assets, such as U.S. stocks. The carry trade has been put on the shelf until we get more certainty on U.S. monetary policy. These short-yen positions that invested in equities and other high yielding assets outside of Japan have been brutalized recently due to a drop in both the Nikkei and the Dow and yen strength. The Fed will meet on Tuesday and Wednesday, and the U.S. central bank's policy statement that will be released at the close of the meeting and the news conference by Fed chief Ben Bernanke will be scrutinized for clues on when the Fed might start to pull back on its stimulus program. Trading in the dollar-yen has been locked in step with Japan's benchmark Nikkei 225 index in recent weeks as investors unravel the sell-yen, buy-stocks trade that dominated the market between November and May. Fall in equities also forces investors to pare the dollar hedges initially put in place to protect them from a weakening yen.
That is official news. Since Fed meeting will take place on next week, it also could become the triggering moment for technical trades and patterns that we will take a look on. Why this could impact on the market?
On the chart we see that QE II and QE III show no positive impact on employment and manufacturing. Everybody knows currently that this liquidity mostly was not invested in real sector, credits, loans etc. Most part of this money now is in stock bubble and despite how curious it will sound – real estate market. Yes, price on homes in US is growing much faster than the real economy and there are warnings exists among economists that it is still possible another crisis that now will have a target on saving FHA. US taxpayers already have paid about 195 Bln for saving Fannie May and Freddie Mac, but with FHA they will have to pay 115 Bln more. Since risk of inflation gradually is growing, despite how anemic it is currently, inflow another 115 Bln could have significant impact on US economy. But this is rumors yet.
The first reaction if Fed will give clear hint on closing QE program, will be probably drop on stock market since liquidity flow will be closed and jump in US dollar, because it will simultaneously mean that Fed sees either inflation risks and/or economy improvement signs. But we will see. Anyway, Fed meeting has a lot of chances to trigger significant moves on Forex market and particularly the yen and make patterns that we have now operational. Let’s take a look at them.
Monthly
Yen monthly chart is very informative as for those traders who hold positions within months as for traders who trade on lower time frames. Trend is bullish here, and market has exceeded as Yearly pivot (around 83) as Yearly PR1 (around 90.16). This tells us that current move up probably is not just a retracement after solid downard trend, but it could medium-term reversal. And rest of the year tendency could continue. Yes, it could be some retracements and pullbacks, but upward tendency has nice chances to hold.
Second moment is – market has shown first upward swing that is greater than previous swing down and broken lower -highs, lower-lows tendency. This confirms first conclusion about possible upward continuation, but also warning us about possible compounded deep retracement. In most cases due previous strong downward momentum market shows AB-CD retracement down after reversal swing.
Third is market stands at resisance and overbought. Now it shows reasonable retracement down. If this situation to treat as “Stretch” pattern, then price stands very close to it’s target around 90-90.50 area – middle area between oversold/overbought bands (I do not have oversold band here, but I’ve checked the level).
Finally the fourth – this is context for DiNapoli B&B “Buy” trade. This definitely will not be DRPO, since market already has hit major 3/8 Support. But B&B trade has not been confirmed yet, since we do not have close below 3x3 line. Now we have only minimum required bars in up thrust (8 bars) and reaching significant support level. What kind of action we could see here? The perfect and mostly desirable scenario will be if price will continue slightly lower in June and hit 50% support around 90.50 area. This will be fastest B&B development.
But if market will show upward move istead and show long upward candle in July then B&B will be postponed. The chances are not great mostly due overbought condition, but this is possible if, for example BoJ will release some strongly supportive steps to announced policy of Yen weaken.
That’s being said in long-term perspective upward action probably will continue, but before that market will have to correct strong overbought condition and this could be done by directional trades, such as B&B. This will be solid assitance and advantage for us, because we will know the direction for the whole month and second – this could give us excellent oportunity to open long-term position on Yen appreaciation with minimum risk.
Weekly
We’ve seen this picture in Friday’s daily video. In fact weekly chart is mostly significant for us, since it holds context for our trading on lower time-frames. Trend is bearish here, market is strongly oversold and has passed through all monthly support pivots, thus, I even do not have them on this chart. This is perfect setup of B&B “Buy” trade with minimum target around 100. Currently we do not know whether we will get B&B on monthly and when, how it will appear and so on, but here we have it and just wait at which level market will find support to show bounce up. Weekly pattern could coincide with monthly if market will bounce from 50% support area. But at some reason I suspect that bounce up could come from major 3/8 support and right at nearest Wed at FOMC meeting. So we will have to watch for reversal patterns around 93-94 area on lower time frames. They could give us the sign that weekly B&B has started.
Daily
There is no much information on daily time frame yet. Unfortunately we haven’t take a look at Yen chart earlier – in April-May. It was butterfly “Sell” right at monthly resistance and oversold. Anyway, now market stands with downward move. All that I see here is just butterfly’s target levels and “lightning bolt” AB=CD pattern. Trend is bearish here and market oversold as well. 1.27 butterfly extension coincides with nearest major 3/8 level, while 1.618 stands slightly higher than 90.50 50% support level. AB-CD target is also stands around 50% weekly support. Currently is very difficult to understand whether market will start B&B right from current level of 3/8 major support or proceed slightly lower to 50%. Still, the precise entry point for us not as important as it could be on hourly chart, for instance, because this is weekly B&B. Even if we will miss precise entry point we will have a lot of time to open position on some retracement. But this does not release us from monitoring daily chart and looking for potentially upward reversal pattern.
4-hour
Looks like here we have something. This is potential Butterfly “Buy” with 1.618 target around major 3/8 support and 50 pips higher than daily AB-CD target. This butterlfy is accompanied by MACD bullish divergence and bearish dynamic pressure – see, trend holds bullish but price action moves lower. Also overall dynamic gradually is taking the shape of the wedge pattern. This increases bounce chances from our prespecified area of 91.50-92.20.
60-min
Trend is bearish here and we have another one smaller pattern, that has 1.618 target at the same area of 92.50 level. Well, probably these two butterflies should become the object of our close attention in the beginning of the week.
Conclusion:
Yen currently is a goldmine of contexts for trading at any taste – long-term, short-term, harmonic patterns, DiNapoli patterns.
Long-term picture points on possible upward continuation during second half of the year. But currently Yen is strongly overbought and probably will enter in phase of retracements and accommodation of current level. This in turn carries and gives us context for trading. Major pattern that we expect right now is B&B “Buy” on weekly time frame.
Since market now stands very close to major support level and shows the signs of exhausting on intraday charts, we will have to keep a close eye on 92.50 area on the next week, since market could start bounce from it. Target of possible move up is 100 area. As usual – if market will show fast acceleration through 92.50 – do not take long position and wait further clarification.
The technical portion of Sive's analysis owes a great deal to Joe DiNapoli's methods, and uses a number of Joe's proprietary indicators. Please note that Sive's analysis is his own view of the market and is not endorsed by Joe DiNapoli or any related companies.
")