Sive Morten
Special Consultant to the FPA
- Messages
- 18,639
Fundamentals
This week shows it is too early for victory relations on coming Fed rate cut as data on Friday shows not bad retail sales data. Sentiment shows some decrease but still stands at high levels, which confirms our suspicions that we've announced last week - market could criticize NFP data, tariffs war etc. but facts tell on 3%+ GDP in IQ, good NFP at moderate wage inflation (3% through the I-IIQ as well), good retail sales and overall sentiment.
This is the reason why last week we said that market shows emotional overreaction on data and blackened overall picture too much. As soon as positive statistics has been released - counter reaction on Friday was strong. We will see, what Fed will say on June meeting, but personally I treat chances on rate cut in July as low. Usually, when market doesn't expect something, price action especially strong. It means that downside action on EUR could be unexpectedly strong once something will be said (by Fed for example) that doesn't match to common view. Just to remind you - market expects 87% rate cut in July. Other words speaking - 80% rate cut already is priced-in EUR/USD rate.
In recent update, Reuters just confirms what we've said last week. Not only about rate cut but also about tariffs that sooner or later but they will be imposed on EU and Japan. We treat tariffs as a tool that served exceptionally to US as they control global trade through US Dollar. And they definitely will use it to extract as more benefits as they could in rapidly changing global economy situation.
As Reuters reports - The dollar index climbed to its highest in almost two weeks on Friday after encouraging retail sales data for May released ahead of a Federal Reserve policy meeting next week eased fears that the U.S. economy is slowing sharply.
The Commerce Department said retail sales rose 0.5% last month, just below economists’ expectations of a 0.6% gain. Data for April was revised up to show retail sales gaining 0.3%, instead of dropping 0.2% as previously reported.
The dollar has recovered in the last week from a weak start to June, as investors consider whether expectations for U.S. interest rate cuts have gotten too far-fetched relative to the data.
With international economic growth slowing, investors are nervous that U.S. President Donald Trump will impose tariffs on Japan and Europe, which could result in more dovish central banks globally and give the dollar a relative advantage.
The U.S. economy is also seen as better placed to handle trade tensions than other countries.
The dollar “has benefited to date from negative globalization news as the domestic side of the U.S. economy has looked sufficiently robust to deal with trade-related headwinds,” Morgan Stanley analysts said in a report on Friday.
“Other countries look less resilient in the face of trade tensions due to higher exposure to global import demand, dependence on manufacturing exports, and underdeveloped domestic demand,” they said.
Chinese data on Friday flashed more warning signs, with industrial output growth unexpectedly slowing in May to a more than 17-year low and investment cooling, underlining a need for more stimulus.
The Fed is not widely expected to lower rates when it meets on June 18-19, though investors will watch for new signals that a cut by the U.S. central bank may come in July.
Interest rate futures traders are pricing in a 23% chance of a cut in June, and an 87% likelihood of at least one cut in July, according to the CME Group’s FedWatch Tool.
The other major catalyst for the dollar in the near term is whether the United States and China will renew trade negotiations at the G20 summit on June 28-29.
Trump said on Friday it didn’t matter if Chinese President Xi Jinping attends the summit, adding that China would eventually make a trade deal with the United States.
Another fact that we're closely watching is speculative positions on EUR. As we've mentioned earlier - they haven't been cut and stand at the same bearish level:

Source: cftc.gov
Charting by Investing.com
Taking all driving factors together, in short-term perspective (1-month) we could get exceptionally attractive setup. If we would get any negative data for US Dollar, especially on July NFP - be prepare to buy USD. It seems that July NFP could be turning point, as it will be last significant data before Fed meeting. If they will not bring clear negativity - market should collapse. That is what recent data combination tells. Although we can't exclude that this could happen earlier.
Current situation just confirms our suggestion that tariffs do not hurt US too much and mostly impact on rivals. It means that its effect on US economy is overestimated. Consequently, expectations on rate cut in July are also wrong. But - it already is priced-in for 80+%. When market will get clear confirmation that it goes in wrong direction, reversal will be drastic and strong. Be prepared.
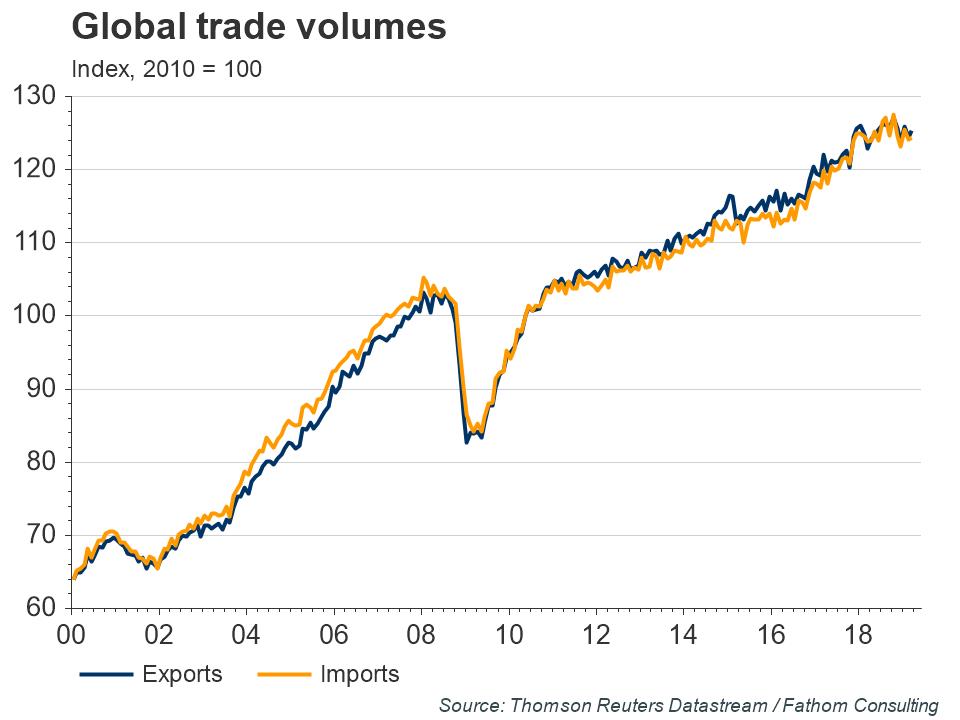
Finally, it is interesting chart from Fathom consulting - impact on global trade by D. Trump presidency. It seems that sooner or later but we will have to get the recession:
The ebbs and flows of President Trump’s protectionist rhetoric have had a material impact on global trade, as measured by CPB — the Netherlands Bureau for Policy Analysis. The volume of trade, which had been rising steadily if slowly since the global financial crisis, stalled last year. Our judgement is that this has been a consequence of uncertainty — of fear rather than fact. It would take a substantial escalation from here, involving the imposition of sizeable, trilateral tariffs between the US, China and the EU, to tip most major economies into recession.
Technical analysis
Monthly
Last week we've identified market driving factors and prepared the trading plan that suggested to use upside momentum of previous week action - new spiral of tariffs piking and poor (as market thought) NFP data.
"Now we've estimated the major factor - market expectation on worse statistics and review on Fed policy, starting as soon as July meeting."
Although we were disagree on these moments but, technically momentum was good and context was bullish, thus we've tried to use it. On Friday market has erased this setup by strong downside breakout of major support on daily chart.
On monthly, we see now that price turns the most part of June upside road back, but still it stands above major support area. As we're coming closer and closer to culmination moment - Fed July meeting, clarity should come soon and our plan (according to fundamental issues) tend to idea of downside breakout. Right now we're not think too much on strategy and long term view. What will happen in nearest month - this is our focus.
As we've said last week, changes are still look insignificant, trend still stands bearish. Monthly chart is rather large and any upside action will have retracement feature, until 1.26 area breakout. The first meaningful resistance here stands around YPP of 1.1740 area, which approximately agrees with 3/8 Fib resistance.

Weekly
On weekly chart we have more negative signs. As positive it has looked last week as negative it looks right now. Although MACD trend stands bullish, sharp downside reversal cancels upside wedge breakout here, makes it faked.
Second - take a look at reaction on 25x5 DMA. Its the same as on previous touches, sharp reversal down. Thus, breakout that we've talked about last week has not been confirmed.
Technically, all these factors are not the final verdict yet. We do not have any bearish patterns, upside action also has the right to be choppy as downside action to the left of the head's bottom was choppy as well. Now major supports have been broken. Thus, technically everything looks not as awful as it could. But - we also have fundamental background here, and it transfers situation in different sphere.
The conclusion that we could made here - EUR keeps technical chances on upside action. Invalidation of bullish context stands at 1.1075 lows. But, we see irrational price action to bullish context and at this moment it would be better to avoid any long positions.At least until we get enough reasons to change our mind. Thus, we keep shape of reverse H&S in mind, but do not take any positions with it yet.

Daily
So, our short-term setup on Friday has been erased by price action, given no chance to take long position as collapse was through strong support area without any respect. Our reversal session "R" has got more significant consequences that market situation has suggested.
First, let's start from bullish moments. In fact, we have just one - potential reverse H&S pattern. Deep retracement here is not curious as market has formed bullish reversal swing and deep retracements usually happen after it. Thus, this pattern suggests close look at major 5/8 Fib support, where theoretically the bottom of right arm should appear.
Now, to bearish moments, what we do not like here. First is too fast downside action, with disrespect of strong K-support area. This is not bullish sign. Second, and this is more important - reversal has happened prior reaching of major intraday targets. In fact market has left them uncompleted. Finally, drop starts not at major resistance but at relatively "free" space. Yes, it was Overbought, at it was last week. This week market opens flat without any overbought. I'm afraid that these moments could overvalue the shape of reverse H&S pattern. It means that it is better to not take long position blindly right at 1.1980 Fib support area.

Intraday
To be honest, on intraday chart, it is nothing to say yet. Here you can see that our targets have not been completed. Downside XOP has been broken as it doesn't exist. Now we do not have any patterns that we could hooked on. The same is on 1H chart. Thus, the daily chart is our primary one by far.

Conclusion:
Short-term fundamental driving factors that market was making bets on were discredited. Even solid technical momentum couldn't help enough to push EUR higher last week.
Although bulls keep theoretical chances to reverse situation, if market somehow starts the rally from last outpost - 1.1190 Fib support area. In this case reverse H&S could be formed -
But, for the truth sake, with fundamental background that we have now and irrational price action that doesn't correspond to normal bullish behavior, we treat chances on upside reversal as low and call to avoid blind long entry right at Fib support.
The major intrigue in the market we see in July Fed meeting that, as we suggest, should dispel a myth about Fed rate cut and big harm to US economy from tariffs war.
In longer-term view we see factors that negative for US Dollar and this negative effect could be significantly stronger than it seems right now. We think that negative impact should get maximum strength closer the end of 2nd term of D. Trump presidency. Until that moment downside trend could start but probably will be gradual. Technical long-term analysis of Dollar index suggests major downside reversal as well. Indirectly our worry is confirmed by rally on gold market, which we think stands in a phase of global trend shift to bullish. As we suggest, this combination looks worthy of our attention.
The technical portion of Sive's analysis owes a great deal to Joe DiNapoli's methods, and uses a number of Joe's proprietary indicators. Please note that Sive's analysis is his own view of the market and is not endorsed by Joe DiNapoli or any related companies.
This week shows it is too early for victory relations on coming Fed rate cut as data on Friday shows not bad retail sales data. Sentiment shows some decrease but still stands at high levels, which confirms our suspicions that we've announced last week - market could criticize NFP data, tariffs war etc. but facts tell on 3%+ GDP in IQ, good NFP at moderate wage inflation (3% through the I-IIQ as well), good retail sales and overall sentiment.
This is the reason why last week we said that market shows emotional overreaction on data and blackened overall picture too much. As soon as positive statistics has been released - counter reaction on Friday was strong. We will see, what Fed will say on June meeting, but personally I treat chances on rate cut in July as low. Usually, when market doesn't expect something, price action especially strong. It means that downside action on EUR could be unexpectedly strong once something will be said (by Fed for example) that doesn't match to common view. Just to remind you - market expects 87% rate cut in July. Other words speaking - 80% rate cut already is priced-in EUR/USD rate.
In recent update, Reuters just confirms what we've said last week. Not only about rate cut but also about tariffs that sooner or later but they will be imposed on EU and Japan. We treat tariffs as a tool that served exceptionally to US as they control global trade through US Dollar. And they definitely will use it to extract as more benefits as they could in rapidly changing global economy situation.
As Reuters reports - The dollar index climbed to its highest in almost two weeks on Friday after encouraging retail sales data for May released ahead of a Federal Reserve policy meeting next week eased fears that the U.S. economy is slowing sharply.
The Commerce Department said retail sales rose 0.5% last month, just below economists’ expectations of a 0.6% gain. Data for April was revised up to show retail sales gaining 0.3%, instead of dropping 0.2% as previously reported.
The dollar has recovered in the last week from a weak start to June, as investors consider whether expectations for U.S. interest rate cuts have gotten too far-fetched relative to the data.
With international economic growth slowing, investors are nervous that U.S. President Donald Trump will impose tariffs on Japan and Europe, which could result in more dovish central banks globally and give the dollar a relative advantage.
The U.S. economy is also seen as better placed to handle trade tensions than other countries.
The dollar “has benefited to date from negative globalization news as the domestic side of the U.S. economy has looked sufficiently robust to deal with trade-related headwinds,” Morgan Stanley analysts said in a report on Friday.
“Other countries look less resilient in the face of trade tensions due to higher exposure to global import demand, dependence on manufacturing exports, and underdeveloped domestic demand,” they said.
Chinese data on Friday flashed more warning signs, with industrial output growth unexpectedly slowing in May to a more than 17-year low and investment cooling, underlining a need for more stimulus.
The Fed is not widely expected to lower rates when it meets on June 18-19, though investors will watch for new signals that a cut by the U.S. central bank may come in July.
Interest rate futures traders are pricing in a 23% chance of a cut in June, and an 87% likelihood of at least one cut in July, according to the CME Group’s FedWatch Tool.
The other major catalyst for the dollar in the near term is whether the United States and China will renew trade negotiations at the G20 summit on June 28-29.
Trump said on Friday it didn’t matter if Chinese President Xi Jinping attends the summit, adding that China would eventually make a trade deal with the United States.
Another fact that we're closely watching is speculative positions on EUR. As we've mentioned earlier - they haven't been cut and stand at the same bearish level:
Source: cftc.gov
Charting by Investing.com
Taking all driving factors together, in short-term perspective (1-month) we could get exceptionally attractive setup. If we would get any negative data for US Dollar, especially on July NFP - be prepare to buy USD. It seems that July NFP could be turning point, as it will be last significant data before Fed meeting. If they will not bring clear negativity - market should collapse. That is what recent data combination tells. Although we can't exclude that this could happen earlier.
Current situation just confirms our suggestion that tariffs do not hurt US too much and mostly impact on rivals. It means that its effect on US economy is overestimated. Consequently, expectations on rate cut in July are also wrong. But - it already is priced-in for 80+%. When market will get clear confirmation that it goes in wrong direction, reversal will be drastic and strong. Be prepared.
Finally, it is interesting chart from Fathom consulting - impact on global trade by D. Trump presidency. It seems that sooner or later but we will have to get the recession:
The ebbs and flows of President Trump’s protectionist rhetoric have had a material impact on global trade, as measured by CPB — the Netherlands Bureau for Policy Analysis. The volume of trade, which had been rising steadily if slowly since the global financial crisis, stalled last year. Our judgement is that this has been a consequence of uncertainty — of fear rather than fact. It would take a substantial escalation from here, involving the imposition of sizeable, trilateral tariffs between the US, China and the EU, to tip most major economies into recession.
Technical analysis
Monthly
Last week we've identified market driving factors and prepared the trading plan that suggested to use upside momentum of previous week action - new spiral of tariffs piking and poor (as market thought) NFP data.
"Now we've estimated the major factor - market expectation on worse statistics and review on Fed policy, starting as soon as July meeting."
Although we were disagree on these moments but, technically momentum was good and context was bullish, thus we've tried to use it. On Friday market has erased this setup by strong downside breakout of major support on daily chart.
On monthly, we see now that price turns the most part of June upside road back, but still it stands above major support area. As we're coming closer and closer to culmination moment - Fed July meeting, clarity should come soon and our plan (according to fundamental issues) tend to idea of downside breakout. Right now we're not think too much on strategy and long term view. What will happen in nearest month - this is our focus.
As we've said last week, changes are still look insignificant, trend still stands bearish. Monthly chart is rather large and any upside action will have retracement feature, until 1.26 area breakout. The first meaningful resistance here stands around YPP of 1.1740 area, which approximately agrees with 3/8 Fib resistance.
Weekly
On weekly chart we have more negative signs. As positive it has looked last week as negative it looks right now. Although MACD trend stands bullish, sharp downside reversal cancels upside wedge breakout here, makes it faked.
Second - take a look at reaction on 25x5 DMA. Its the same as on previous touches, sharp reversal down. Thus, breakout that we've talked about last week has not been confirmed.
Technically, all these factors are not the final verdict yet. We do not have any bearish patterns, upside action also has the right to be choppy as downside action to the left of the head's bottom was choppy as well. Now major supports have been broken. Thus, technically everything looks not as awful as it could. But - we also have fundamental background here, and it transfers situation in different sphere.
The conclusion that we could made here - EUR keeps technical chances on upside action. Invalidation of bullish context stands at 1.1075 lows. But, we see irrational price action to bullish context and at this moment it would be better to avoid any long positions.At least until we get enough reasons to change our mind. Thus, we keep shape of reverse H&S in mind, but do not take any positions with it yet.
Daily
So, our short-term setup on Friday has been erased by price action, given no chance to take long position as collapse was through strong support area without any respect. Our reversal session "R" has got more significant consequences that market situation has suggested.
First, let's start from bullish moments. In fact, we have just one - potential reverse H&S pattern. Deep retracement here is not curious as market has formed bullish reversal swing and deep retracements usually happen after it. Thus, this pattern suggests close look at major 5/8 Fib support, where theoretically the bottom of right arm should appear.
Now, to bearish moments, what we do not like here. First is too fast downside action, with disrespect of strong K-support area. This is not bullish sign. Second, and this is more important - reversal has happened prior reaching of major intraday targets. In fact market has left them uncompleted. Finally, drop starts not at major resistance but at relatively "free" space. Yes, it was Overbought, at it was last week. This week market opens flat without any overbought. I'm afraid that these moments could overvalue the shape of reverse H&S pattern. It means that it is better to not take long position blindly right at 1.1980 Fib support area.
Intraday
To be honest, on intraday chart, it is nothing to say yet. Here you can see that our targets have not been completed. Downside XOP has been broken as it doesn't exist. Now we do not have any patterns that we could hooked on. The same is on 1H chart. Thus, the daily chart is our primary one by far.
Conclusion:
Short-term fundamental driving factors that market was making bets on were discredited. Even solid technical momentum couldn't help enough to push EUR higher last week.
Although bulls keep theoretical chances to reverse situation, if market somehow starts the rally from last outpost - 1.1190 Fib support area. In this case reverse H&S could be formed -
But, for the truth sake, with fundamental background that we have now and irrational price action that doesn't correspond to normal bullish behavior, we treat chances on upside reversal as low and call to avoid blind long entry right at Fib support.
The major intrigue in the market we see in July Fed meeting that, as we suggest, should dispel a myth about Fed rate cut and big harm to US economy from tariffs war.
In longer-term view we see factors that negative for US Dollar and this negative effect could be significantly stronger than it seems right now. We think that negative impact should get maximum strength closer the end of 2nd term of D. Trump presidency. Until that moment downside trend could start but probably will be gradual. Technical long-term analysis of Dollar index suggests major downside reversal as well. Indirectly our worry is confirmed by rally on gold market, which we think stands in a phase of global trend shift to bullish. As we suggest, this combination looks worthy of our attention.
The technical portion of Sive's analysis owes a great deal to Joe DiNapoli's methods, and uses a number of Joe's proprietary indicators. Please note that Sive's analysis is his own view of the market and is not endorsed by Joe DiNapoli or any related companies.
 . Fed also has confirmed slowdown in US economy and first test is passed. It is more data ahead as well as decisive July meeting, but, now 25-50 b.p. rate cut stands on the table this year.