Sive Morten
Special Consultant to the FPA
- Messages
- 18,655
EUR/USD Daily Update, Fri 24, June 2011
Good morning.
On the daily time frame there is nothing really new. Market holds the bearish bias.
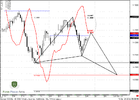
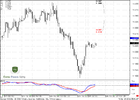
On 4-hour chart we see solid pullback due to fundamental decision by voting to escape the Greece default. Its unnaturality confirms by hourly chart - see V-shape reversal. That's very common to fundamental events. Reversals by technical events usually have W-shape bottom.
So, since today is Friday and just some hours ago the important decision has been made, probably to do nothing today is a wise decision. Because we do not know yet - how rest of the market will react on that.
I prefer to take a clear look on weekend and make some plan for Monday.
Still, if you intend to do something -
hourly trend is bullish, while daily is bearish. It tells that market probably will show deeper retracement. Picture on 4-hour chart with butterfly is just an assumption. Usually, during Butterflies, market shows 0.618-0.786 retracements.
but for better confidence I prefer to see couple of things before enter short:
1. reaching of some strong resistance on hourly chart;
2. Moving market below pivot again and shifting trend to bearish.
Only after that, probably it will be relatively safe to try enter short. But, again, will market have enough of time to show all these things till the close - who knows...
Good morning.
On the daily time frame there is nothing really new. Market holds the bearish bias.
On 4-hour chart we see solid pullback due to fundamental decision by voting to escape the Greece default. Its unnaturality confirms by hourly chart - see V-shape reversal. That's very common to fundamental events. Reversals by technical events usually have W-shape bottom.
So, since today is Friday and just some hours ago the important decision has been made, probably to do nothing today is a wise decision. Because we do not know yet - how rest of the market will react on that.
I prefer to take a clear look on weekend and make some plan for Monday.
Still, if you intend to do something -
hourly trend is bullish, while daily is bearish. It tells that market probably will show deeper retracement. Picture on 4-hour chart with butterfly is just an assumption. Usually, during Butterflies, market shows 0.618-0.786 retracements.
but for better confidence I prefer to see couple of things before enter short:
1. reaching of some strong resistance on hourly chart;
2. Moving market below pivot again and shifting trend to bearish.
Only after that, probably it will be relatively safe to try enter short. But, again, will market have enough of time to show all these things till the close - who knows...
")