Sive Morten
Special Consultant to the FPA
- Messages
- 18,669
Monthly
As Reuters reports, the dollar stayed firm on Friday as U.S. bond yields held steady, while sterling slipped from its recent peaks tied to expectations the Bank of England might raise interest rates by early 2015 on signs of a strengthening British economy. Reduced jitters about the fighting in Iraq also supported the dollar as traders trimmed their safe-haven holdings in gold, U.S. Treasuries and Japanese yen. "The dollar has drifted in a pretty small range," said Omer Esiner, chief market strategist at Commonwealth Foreign Exchange Inc. in Washington. The dollar index clung to a slim 0.07 percent gain at 80.39, shaving its weekly loss to 0.2 percent, still on track for its biggest one-week drop since the week ended May 2.
The benchmark 10-year Treasuries yield rose to 2.66 percent before easing to 2.63 percent in late U.S. trading, little changed on the day. The 10-year yield has bounced in a 10 basis point range established two weeks ago. Analysts said the greenback's move was limited by light trading volume and the absence of fresh U.S. economic data. "Until we get a surprise on the geopolitical front, most major currencies will be tracking bond yields in the near term," Esiner said.
The dollar index was poised for its worst week since early May after the Federal Reserve downgraded its long-term U.S. growth outlook and markets perceived comments by Fed Chair Janet Yellen as dovish. The gap between U.S. and German 10-year yields narrowed to 1.276 percentage points from 1.296 on Thursday, which was its widest since mid-1999, shortly after the euro debuted.
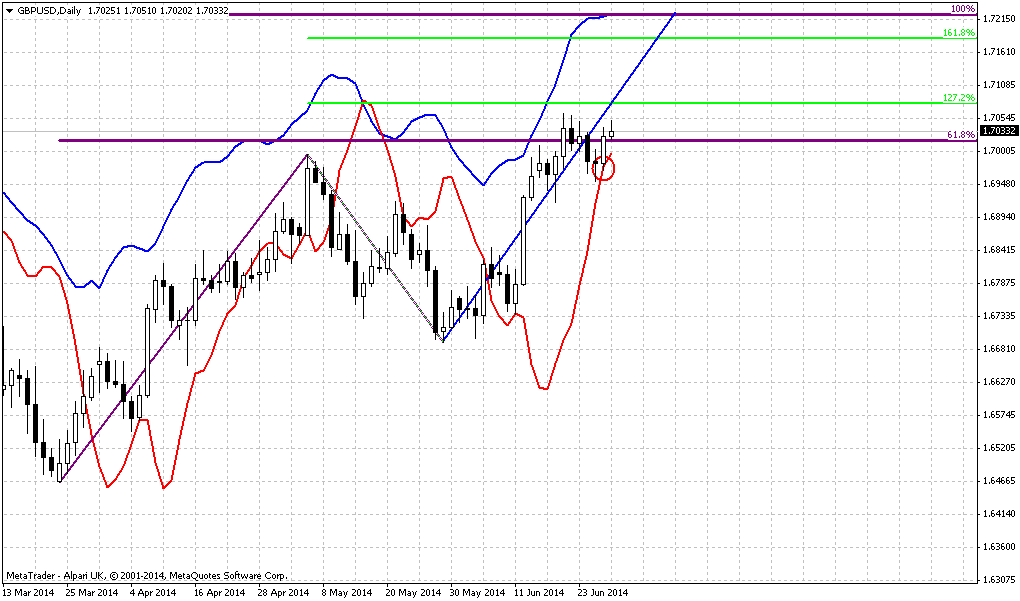
STERLING HOLDS SHINE
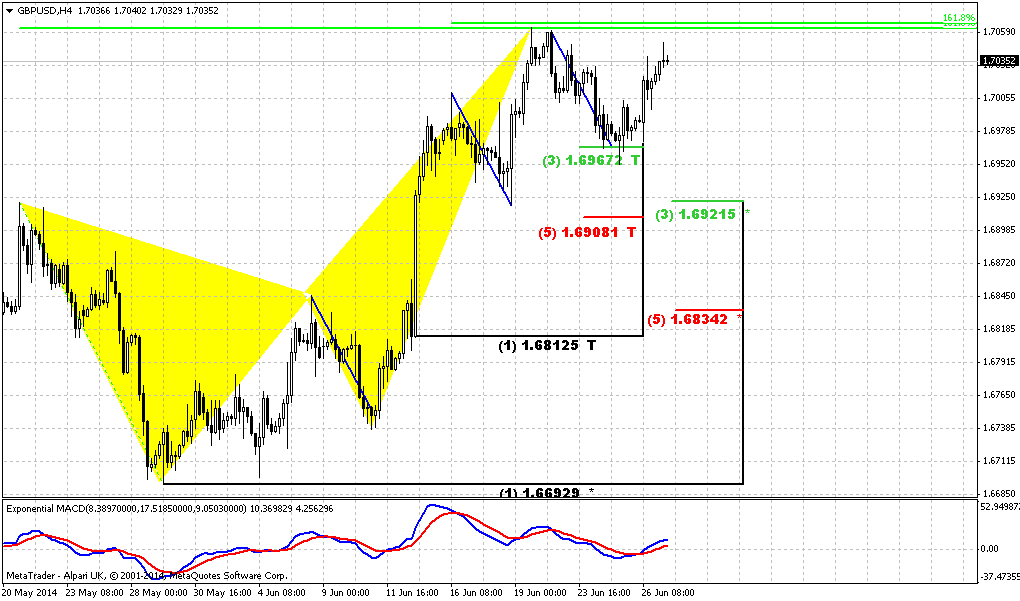
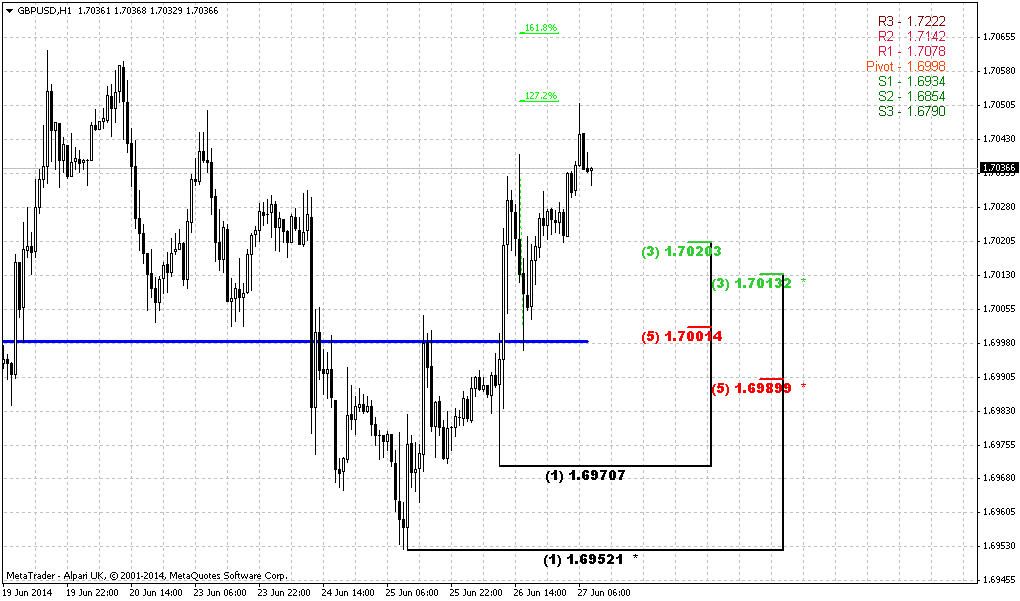
Sterling hovered within striking distance of Thursday's 5-1/2-year high of $1.7064 after data showed U.K. factory orders grew at their fastest pace in six months in June. The report highlighted the probability that the BoE may raise rates well before the Fed. "Sterling is a favorite right now, and the BoE seems to be the only major central bank that is likely to deliver on higher rates," said Niels Christensen, an FX strategist at Nordea in London. Analysts projected the BoE will likely raise policy rates in the first quarter of 2015 while the Fed will follow suit in the second half of next year. This view raised the yield premium on two-year British Gilts over two-year U.S. Treasuries to 0.44 percent, a level not seen since August 2011.
Technical
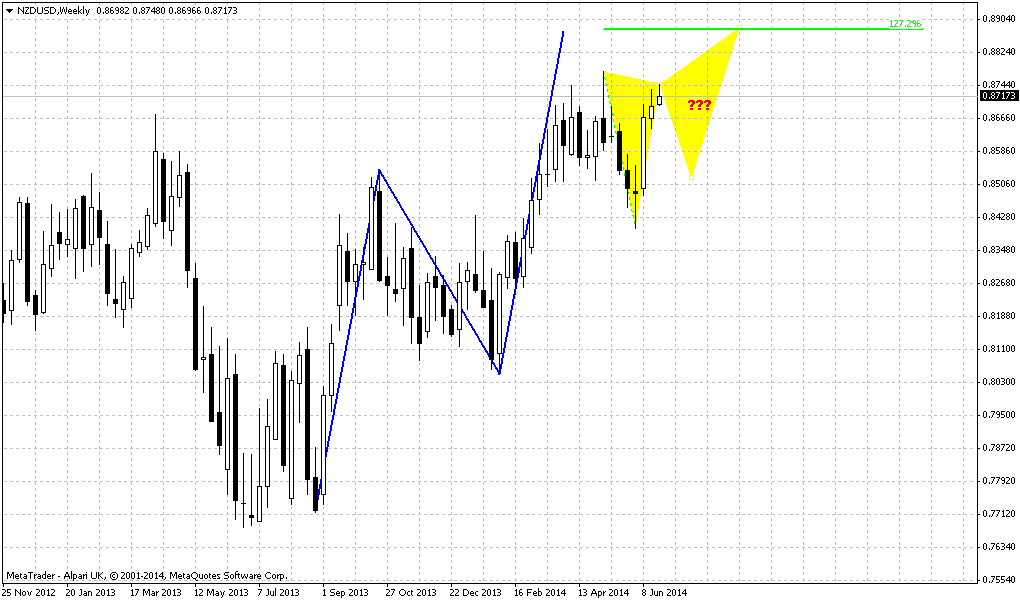
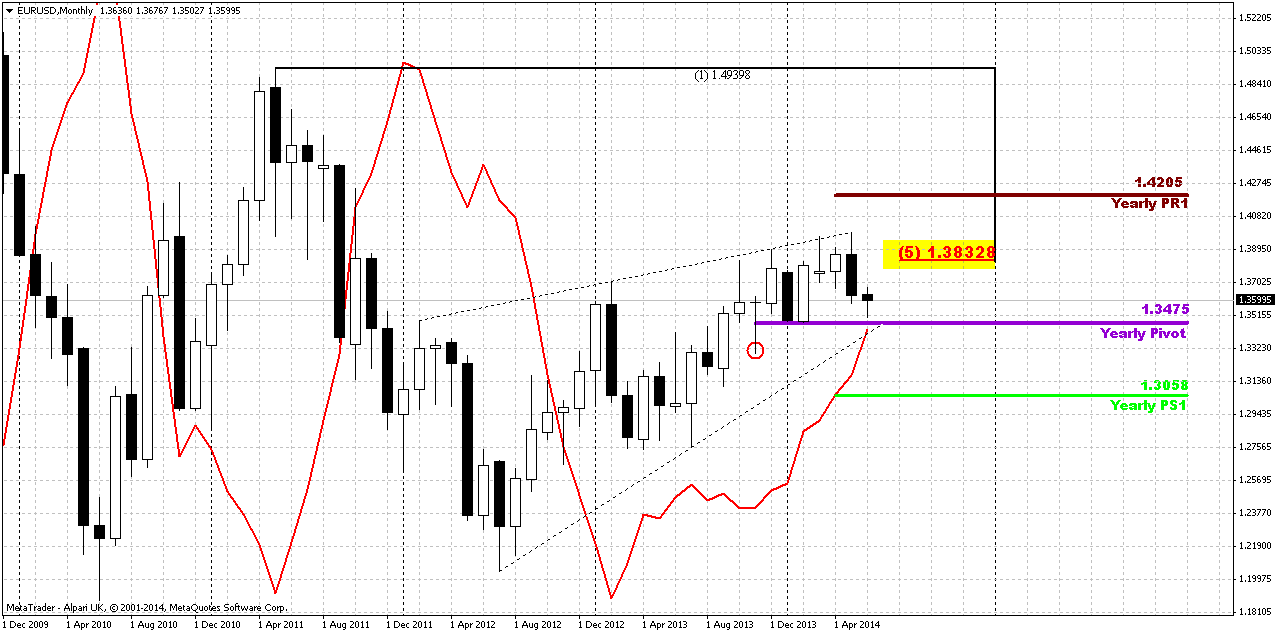
May action has shown its power. Although this has happened not quite independently but having ECB hand in EUR dynamic, still, technically we’ve got reversal bar on monthly chart. We saw something cognate on February action, but it didn’t lead to any downward continuation. At the same time, currently situation is slightly different because there was no solid upward action in April, and now we have a month candle that has moved above April high and close below it’s low and this could lead at least to some downward continuation. Recently market has returned right back down to YPP area and flirts around it since then. EUR now stands at very significant moment. It has closely approached to Yearly Pivot point and monthly MACDP. If we will get lucky, we could get clarification in June for extended period. Thus, appearing of bullish grabber right at YPP level definitely will tell us that market should exceed 1.40 level and probably even could reach YPR1~1.42 area. Conversely, failure at YPP will be great challenge on further downward action.
We’re speaking about both scenarios, because fundamental comments of current week do not show any agreement in investors’ opinion concerning EUR. Some analysts even think that until US applies dovish policy EUR depreciation will be limited despite how dovish ECB is, and now we see results of recent Yellen’s speech. Analysts suggest that Fed will keep rates low for longer period then they hint on. The same Bernanke said on private dinners, as we once discussed on our research. Thus, with fundamental indecision we have to closely watch for definite patterns and key levels. Now they are YPP and potential grabber.
By looking at bigger picture, market stands in tight range since 2014. Thus, 1.33-1.3850 is an area of “indecision”. While market stands inside of it we can talk about neither upward breakout nor downward reversal. At least, reversal identification could be done with yearly pivot – if market will move below it, this could be early sign of changing sentiment. But, as you can see, nothing among this issues have happened yet.
That’s being said, market stands around crucial area and June could clarify what will happen next.
Weekly
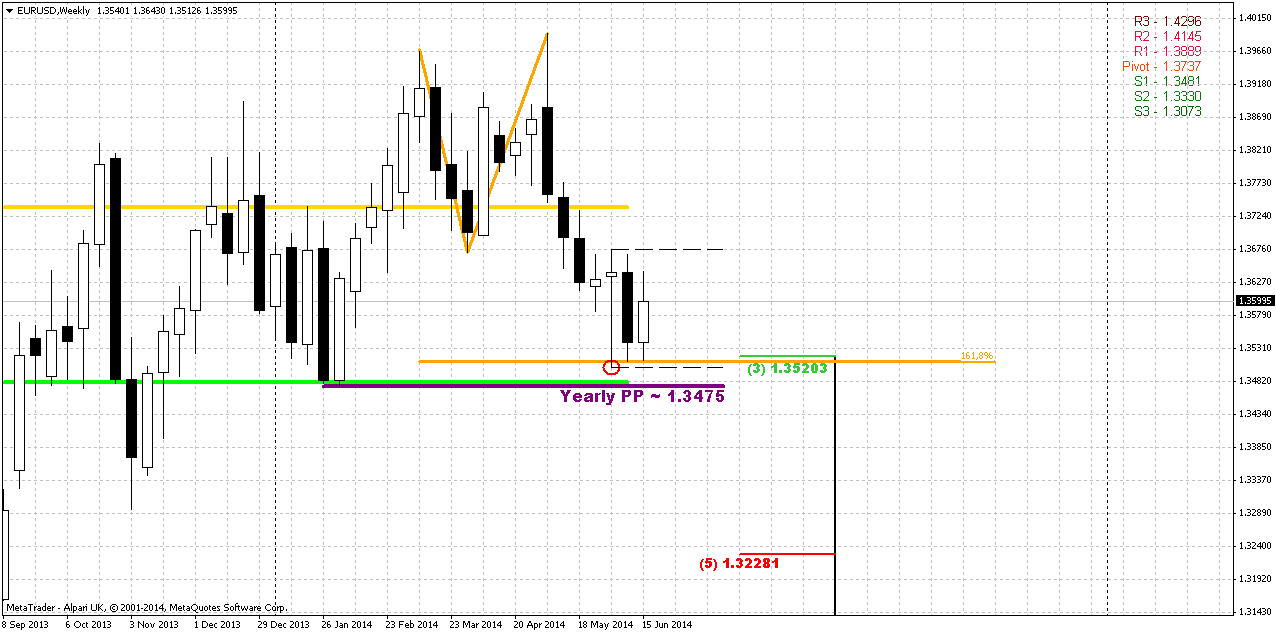
Weekly trend is bearish, but market is not at oversold. Previously market has made an attempt to return right back down to lows and formed inside week. Now we have another one – thus, EUR stands tight third week in a row. When market forms long candle it usually holds following price action for some time, because market needs to accustom to new range. At the same time this will increase potential energy of breakout. After flat placing market breaks with additional power.
Right now situation on weekly chart is relatively simple. We have solid hammer pattern that stands upon strong support area – YPP, MPS1 and Fib level. Nearest perspecitve that we will deal with is respect of this level, i.e. bounce up. Medium term task is choosing a direction.
We will point on bearish trend only if market will move below YPP and take out lows of hammer pattern. This also will mean that monthly trend shifts bearish. Otherwise bullish perspective will dominate over market and there are some reasons for that. First is – weekly butterfly. Yes, market has hit 1.27 and shown 3/8 retracement, but this is not neccesary means the end of the game. As market will return right back up – it could mean that price will proceed to 1.618 target. Second – patterns on monthly, that we’ve just spoken about. I mean bullish grabber. But if even we will not get it, but market will continue move up this still will suggest existing of bullish sentiment, since price still will be above YPP and grabber has chances to appear on July as well...
Fundamental speech relatively confirms this, because many analysts tell that this is not the question of dovish ECB and hawkish Fed – this is too simple, but the question of mismatch of Fed’s promises and real action on tighten policy. If it will appear that Fed is speaking and speaking on rising rates, but does not do this – this could shift force balance between EUR and USD.
We already see this. Despite recent nice economy data Fed does not hurry to hint on possible rate hiking, mostly because Yellen is a follower of theory that unemployment creates additional pressure on inflation. As more people remain unemployed as more supply on job market. This extraordinary supply presses on wages. As wages stand flat – no inflation appears, hence no neccesity in rate hiking. As a result, we can make a conclusion that Fed would like to get positive NFP data for longer period. they need to see contraction of extraordinary supply, and, wages in turn, will show some tendency to grow.
Currently, only geopolitical tensions, probably could drive dollar higher, mostly Iraq. But unfortunately we can’t estimate the strength and timing of this geoplitical impact.
Anyway, let’s trade what we already have in place and focus on first task – action around strong weekly support, while directional task we will monitor gradually through all following weekly researches.
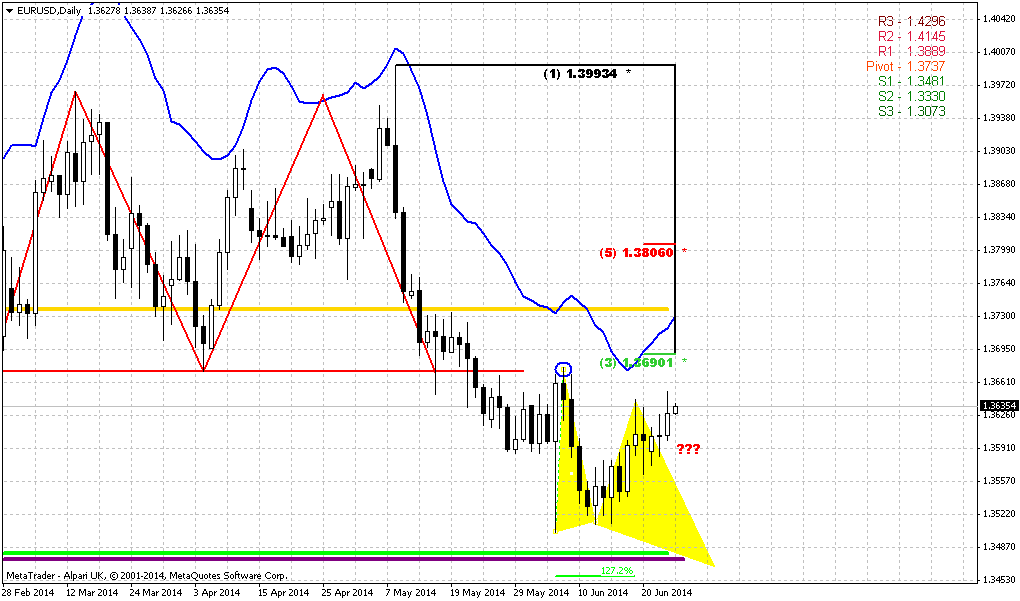
Daily
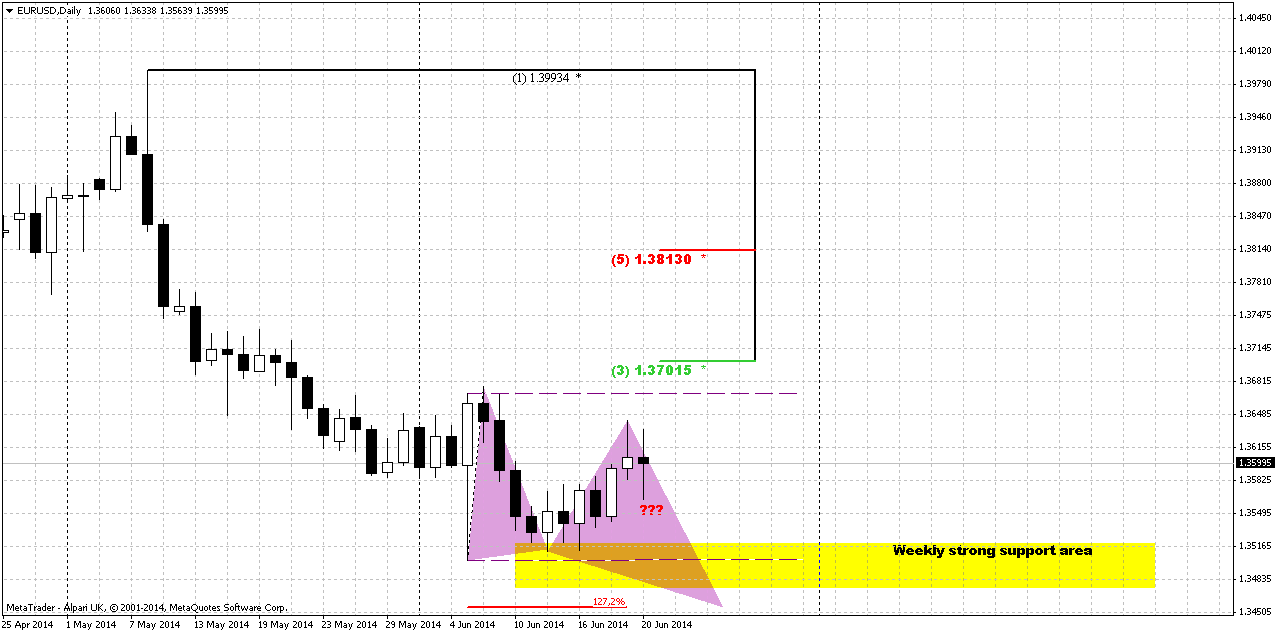
Daily progress is slow. Our major concern here is appearing of some reversal pattern that could trigger upward action as a respect of solid weekly support area. On previous week we’ve got only upward retracement. Currently we have only one pattern that looks relatively clear. This is Butterfly “buy”. And price action has not destroyed it, butterfly is still possible here.
Also situation has resolved with CHF grabbers – they have started to work:
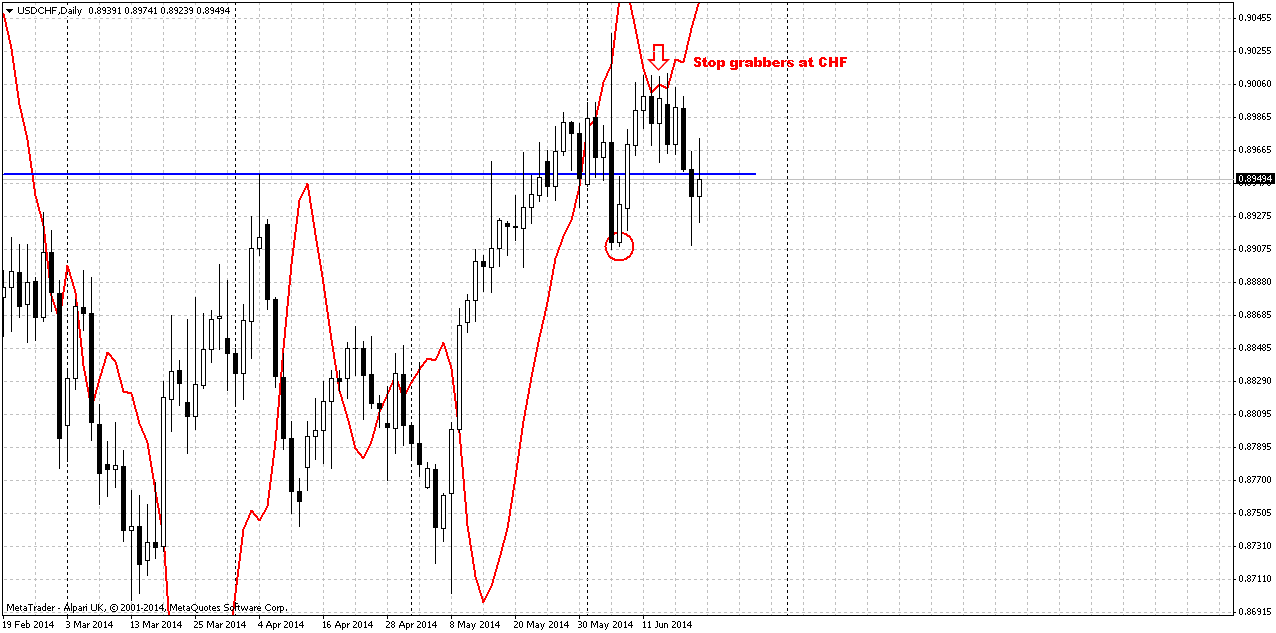
But still, they have not quite reached the target. It means that in the beginning of the week Franc probably will make an attempt to move slightly lower – trying to achieve grabbers’ target.
For us it means that EUR also could show shy upward continuation on intraday charts, before (and if) it will turn down to complete right wing of daily pattern. The major point that we want to see is price remains below 1.3676 top. Otherwise butterfly will be vanished.
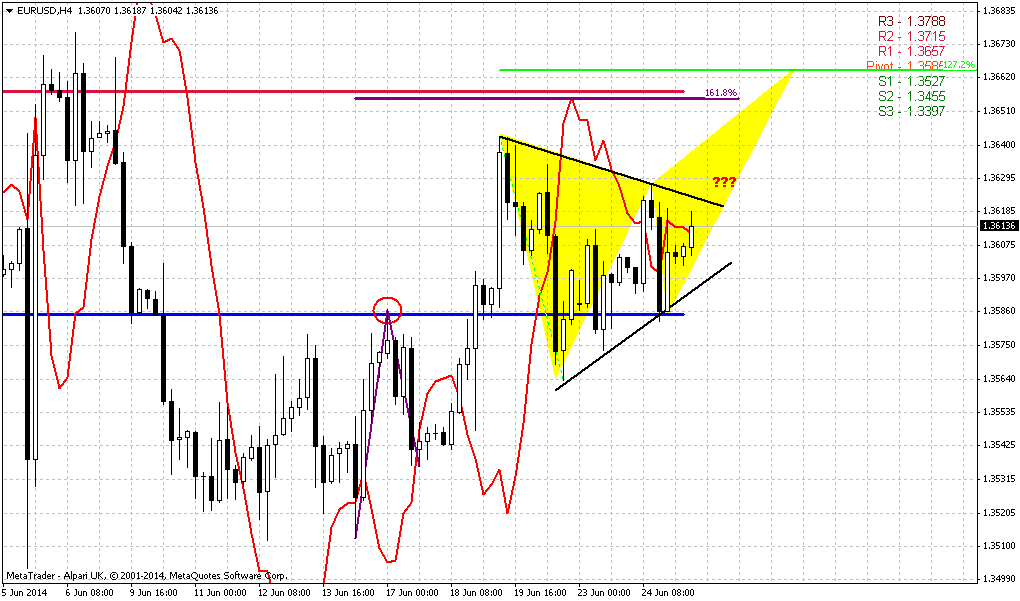
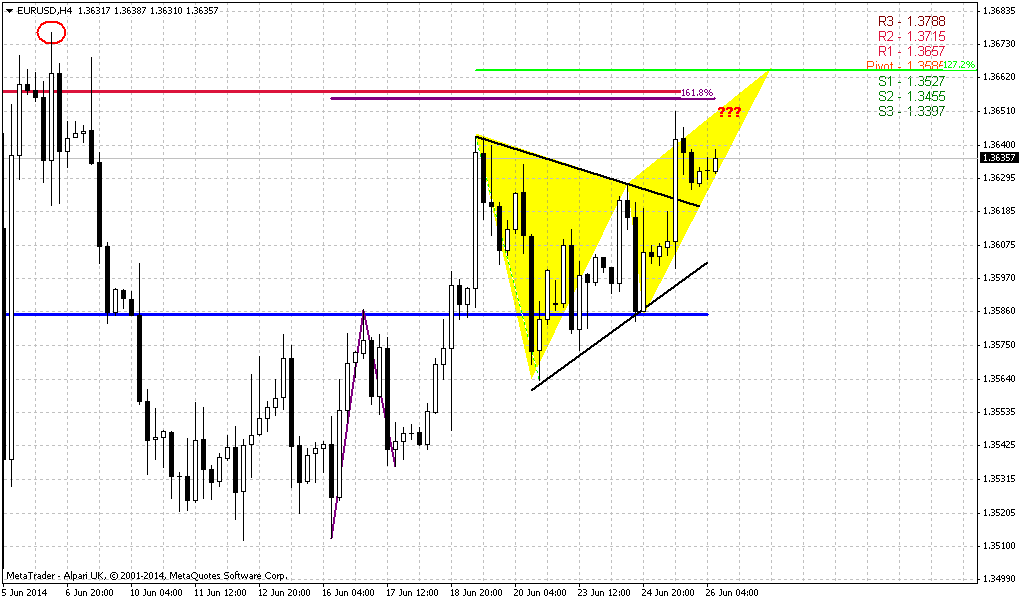
4-hour
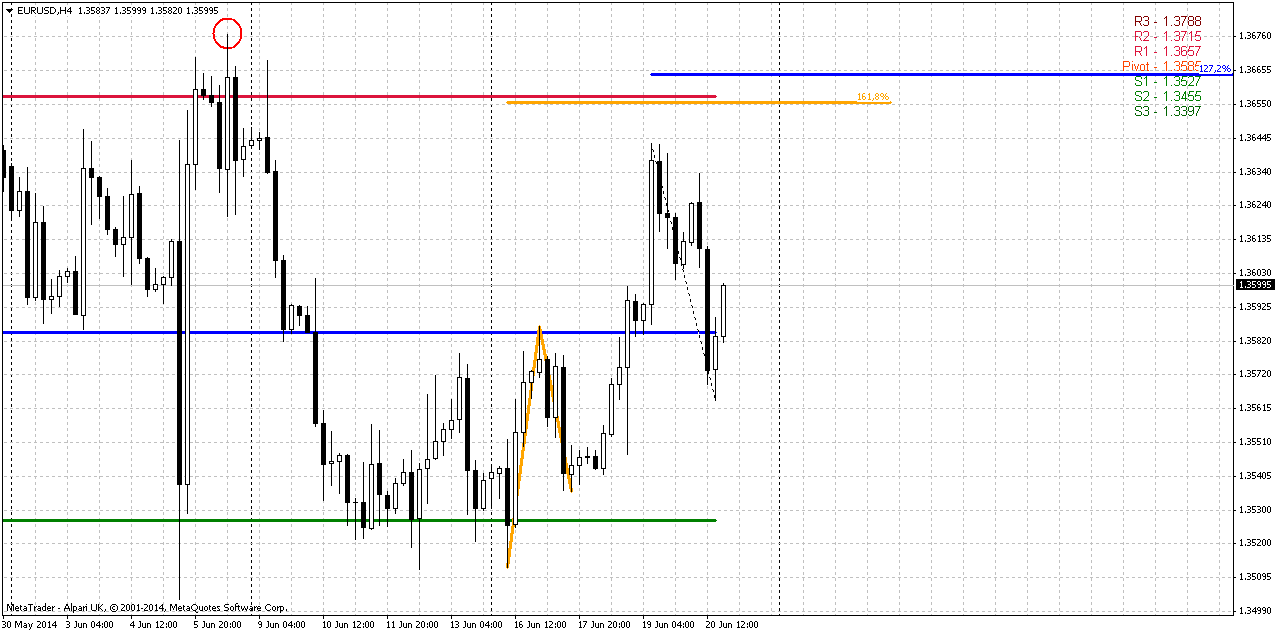
Actually, guys, we do not care much on how far EUR will move below 1.3676 level. For us major point – EUR should stay below this level. Still, 4-hour chart points that shy upward continuation is still possible. As we have fast upward acceleration, market probably will try to complete 1.618 AB=CD target and simultaneously test WPR1. This also could happen by appearing of Butterfly “Sell” pattern. 1.27 extension of recent retracement stands precisely at the same area. It’s not forbidden either trying to take short postion by this butterfly, since we will be able to place tight stop. But let’s not cook hare before catching him. The morn will come and the meat with it – the butterfly will come and the short position with it, right?
1-hour
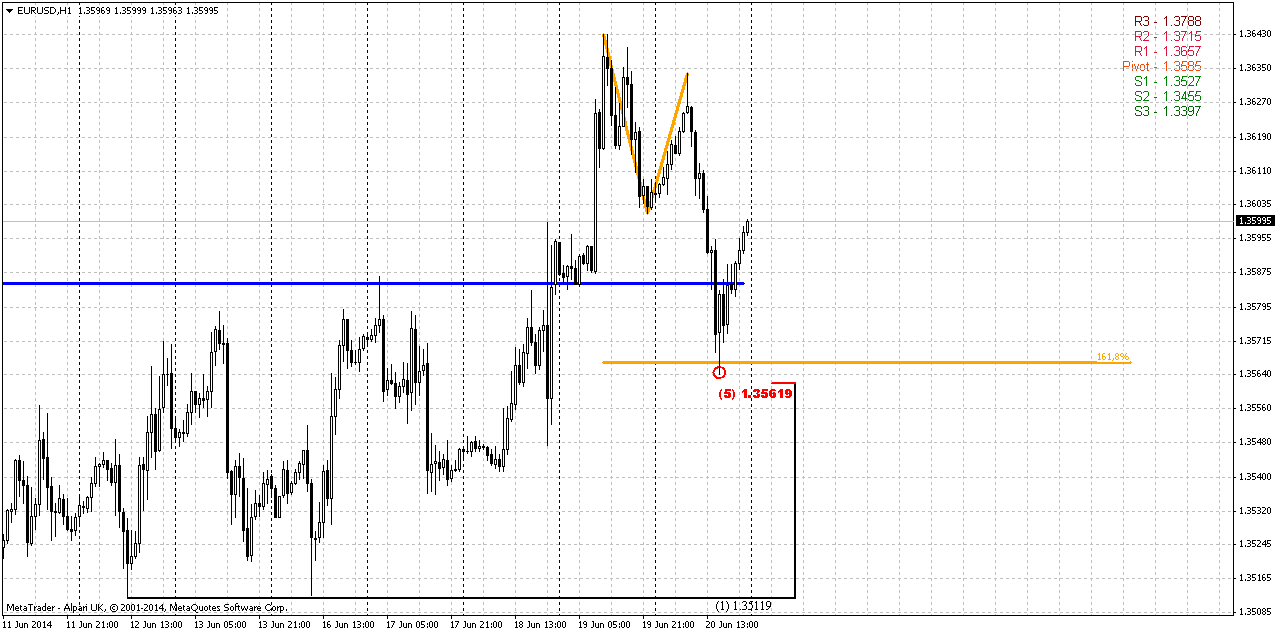
So, what else to watch on EUR? Hourly chart shows that current low is Agreement – combination of 1.618 AB=CD down and 5/8 Fib support. If market still has intension to move up – this level should hold and keep market from downward continuation. If it will happen so that price will start move down and break it, take out this low – it will probably mean that we will not get any upward action on 4-hour chart and market has started move down as right wing of daily butterfly pattern. Besides, if this will happen, market already will be below WPP and this is also will look bearish.
Conclusion:
While price stands in 1.33-1.38 area we can’t speak either on upward or downward breakout. To change really big picture market has to show breakout out of it. Still, market right now stands around crucial area – combination of YPP and monthly MACDP. Appearing of bullish grabber in June or July could resolve the riddle fast on further action. Conversely moving below YPP will shift monthly trend bearish as well and could lead to further EUR depreciation. Currently economy factors mostly point of further dollar weakness as Fed drags out even hints on possible rate hiking. Only some geopolitical tensions could support dollar as safe haven currency and particular the same tensions could lead to shy downward dive on EUR that we expect to see.
On coming week we mostly will deal with respect of current 1.3475-1.3520 support area. Progress here is very slow. The first part of our trading plan suggests monitoring of shy upward continuation and whether price will remain below 1.3676 level or not. Alternatively, we will look over 1.3571 low. This will also be a sign of downward reversal if market will break it instead of upward continuation. Second step of our plan – if any reversal pattern will be formed (say, butterfly “sell” on 4-hour chart), we can try to take scalp short position. This is a program for coming week.
But primary object on EUR is daily reversal pattern...
The technical portion of Sive's analysis owes a great deal to Joe DiNapoli's methods, and uses a number of Joe's proprietary indicators. Please note that Sive's analysis is his own view of the market and is not endorsed by Joe DiNapoli or any related companies.
As Reuters reports, the dollar stayed firm on Friday as U.S. bond yields held steady, while sterling slipped from its recent peaks tied to expectations the Bank of England might raise interest rates by early 2015 on signs of a strengthening British economy. Reduced jitters about the fighting in Iraq also supported the dollar as traders trimmed their safe-haven holdings in gold, U.S. Treasuries and Japanese yen. "The dollar has drifted in a pretty small range," said Omer Esiner, chief market strategist at Commonwealth Foreign Exchange Inc. in Washington. The dollar index clung to a slim 0.07 percent gain at 80.39, shaving its weekly loss to 0.2 percent, still on track for its biggest one-week drop since the week ended May 2.
The benchmark 10-year Treasuries yield rose to 2.66 percent before easing to 2.63 percent in late U.S. trading, little changed on the day. The 10-year yield has bounced in a 10 basis point range established two weeks ago. Analysts said the greenback's move was limited by light trading volume and the absence of fresh U.S. economic data. "Until we get a surprise on the geopolitical front, most major currencies will be tracking bond yields in the near term," Esiner said.
The dollar index was poised for its worst week since early May after the Federal Reserve downgraded its long-term U.S. growth outlook and markets perceived comments by Fed Chair Janet Yellen as dovish. The gap between U.S. and German 10-year yields narrowed to 1.276 percentage points from 1.296 on Thursday, which was its widest since mid-1999, shortly after the euro debuted.
STERLING HOLDS SHINE
Sterling hovered within striking distance of Thursday's 5-1/2-year high of $1.7064 after data showed U.K. factory orders grew at their fastest pace in six months in June. The report highlighted the probability that the BoE may raise rates well before the Fed. "Sterling is a favorite right now, and the BoE seems to be the only major central bank that is likely to deliver on higher rates," said Niels Christensen, an FX strategist at Nordea in London. Analysts projected the BoE will likely raise policy rates in the first quarter of 2015 while the Fed will follow suit in the second half of next year. This view raised the yield premium on two-year British Gilts over two-year U.S. Treasuries to 0.44 percent, a level not seen since August 2011.
Technical
May action has shown its power. Although this has happened not quite independently but having ECB hand in EUR dynamic, still, technically we’ve got reversal bar on monthly chart. We saw something cognate on February action, but it didn’t lead to any downward continuation. At the same time, currently situation is slightly different because there was no solid upward action in April, and now we have a month candle that has moved above April high and close below it’s low and this could lead at least to some downward continuation. Recently market has returned right back down to YPP area and flirts around it since then. EUR now stands at very significant moment. It has closely approached to Yearly Pivot point and monthly MACDP. If we will get lucky, we could get clarification in June for extended period. Thus, appearing of bullish grabber right at YPP level definitely will tell us that market should exceed 1.40 level and probably even could reach YPR1~1.42 area. Conversely, failure at YPP will be great challenge on further downward action.
We’re speaking about both scenarios, because fundamental comments of current week do not show any agreement in investors’ opinion concerning EUR. Some analysts even think that until US applies dovish policy EUR depreciation will be limited despite how dovish ECB is, and now we see results of recent Yellen’s speech. Analysts suggest that Fed will keep rates low for longer period then they hint on. The same Bernanke said on private dinners, as we once discussed on our research. Thus, with fundamental indecision we have to closely watch for definite patterns and key levels. Now they are YPP and potential grabber.
By looking at bigger picture, market stands in tight range since 2014. Thus, 1.33-1.3850 is an area of “indecision”. While market stands inside of it we can talk about neither upward breakout nor downward reversal. At least, reversal identification could be done with yearly pivot – if market will move below it, this could be early sign of changing sentiment. But, as you can see, nothing among this issues have happened yet.
That’s being said, market stands around crucial area and June could clarify what will happen next.
Weekly
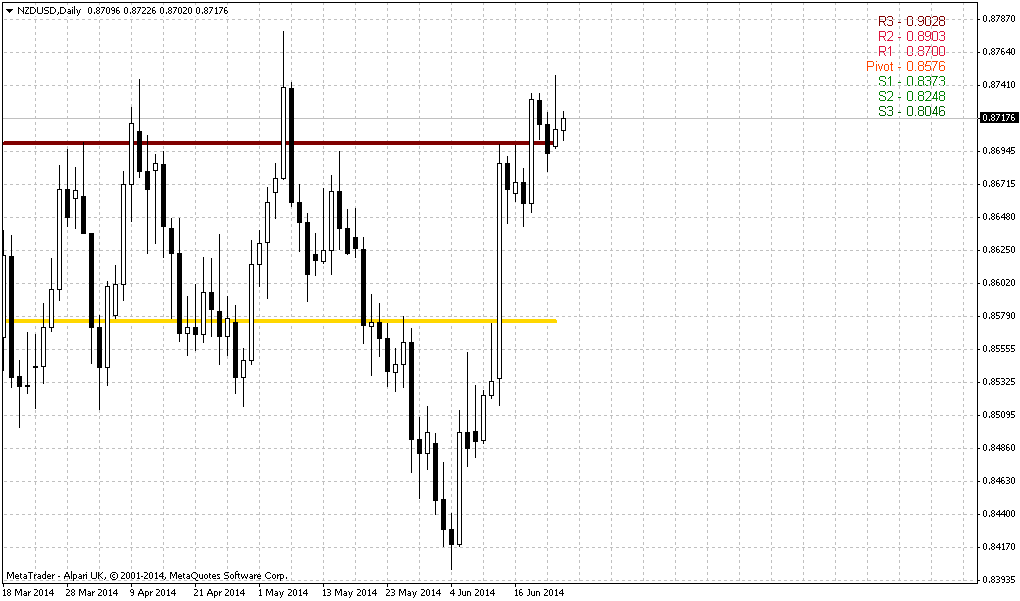
Weekly trend is bearish, but market is not at oversold. Previously market has made an attempt to return right back down to lows and formed inside week. Now we have another one – thus, EUR stands tight third week in a row. When market forms long candle it usually holds following price action for some time, because market needs to accustom to new range. At the same time this will increase potential energy of breakout. After flat placing market breaks with additional power.
Right now situation on weekly chart is relatively simple. We have solid hammer pattern that stands upon strong support area – YPP, MPS1 and Fib level. Nearest perspecitve that we will deal with is respect of this level, i.e. bounce up. Medium term task is choosing a direction.
We will point on bearish trend only if market will move below YPP and take out lows of hammer pattern. This also will mean that monthly trend shifts bearish. Otherwise bullish perspective will dominate over market and there are some reasons for that. First is – weekly butterfly. Yes, market has hit 1.27 and shown 3/8 retracement, but this is not neccesary means the end of the game. As market will return right back up – it could mean that price will proceed to 1.618 target. Second – patterns on monthly, that we’ve just spoken about. I mean bullish grabber. But if even we will not get it, but market will continue move up this still will suggest existing of bullish sentiment, since price still will be above YPP and grabber has chances to appear on July as well...
Fundamental speech relatively confirms this, because many analysts tell that this is not the question of dovish ECB and hawkish Fed – this is too simple, but the question of mismatch of Fed’s promises and real action on tighten policy. If it will appear that Fed is speaking and speaking on rising rates, but does not do this – this could shift force balance between EUR and USD.
We already see this. Despite recent nice economy data Fed does not hurry to hint on possible rate hiking, mostly because Yellen is a follower of theory that unemployment creates additional pressure on inflation. As more people remain unemployed as more supply on job market. This extraordinary supply presses on wages. As wages stand flat – no inflation appears, hence no neccesity in rate hiking. As a result, we can make a conclusion that Fed would like to get positive NFP data for longer period. they need to see contraction of extraordinary supply, and, wages in turn, will show some tendency to grow.
Currently, only geopolitical tensions, probably could drive dollar higher, mostly Iraq. But unfortunately we can’t estimate the strength and timing of this geoplitical impact.
Anyway, let’s trade what we already have in place and focus on first task – action around strong weekly support, while directional task we will monitor gradually through all following weekly researches.
Daily
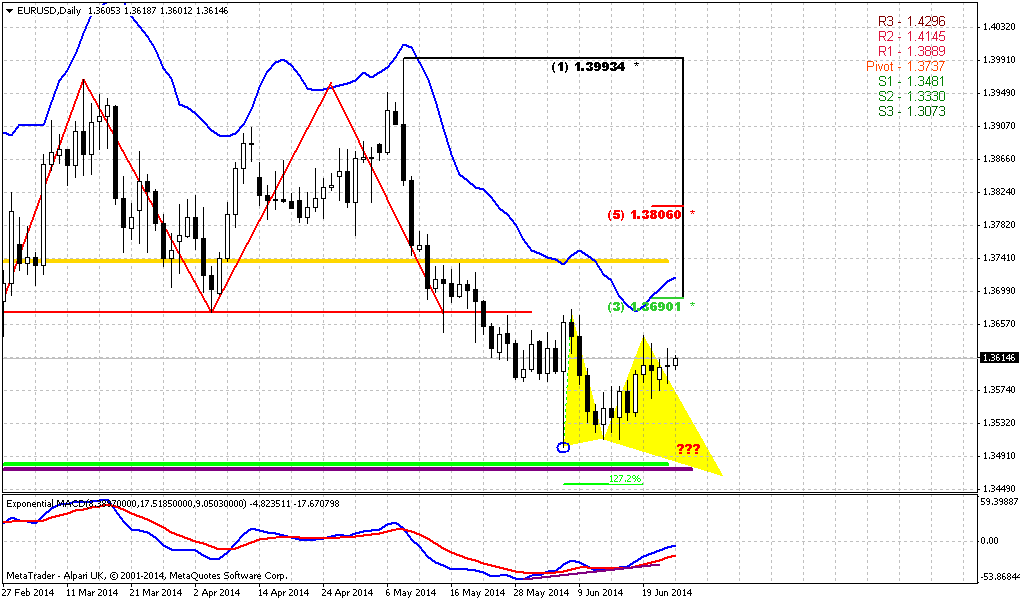
Daily progress is slow. Our major concern here is appearing of some reversal pattern that could trigger upward action as a respect of solid weekly support area. On previous week we’ve got only upward retracement. Currently we have only one pattern that looks relatively clear. This is Butterfly “buy”. And price action has not destroyed it, butterfly is still possible here.
Also situation has resolved with CHF grabbers – they have started to work:
But still, they have not quite reached the target. It means that in the beginning of the week Franc probably will make an attempt to move slightly lower – trying to achieve grabbers’ target.
For us it means that EUR also could show shy upward continuation on intraday charts, before (and if) it will turn down to complete right wing of daily pattern. The major point that we want to see is price remains below 1.3676 top. Otherwise butterfly will be vanished.
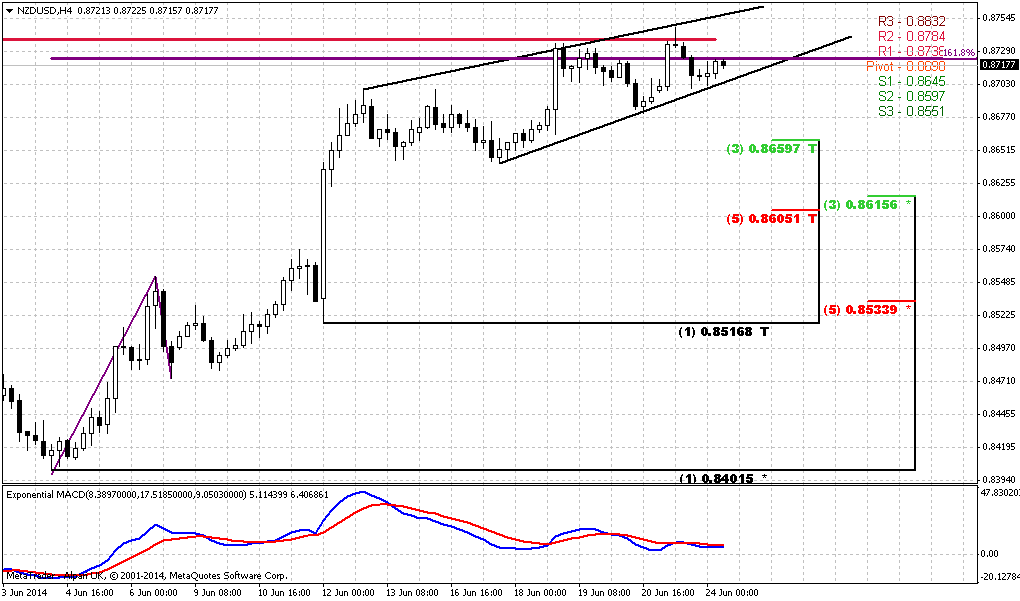
4-hour
Actually, guys, we do not care much on how far EUR will move below 1.3676 level. For us major point – EUR should stay below this level. Still, 4-hour chart points that shy upward continuation is still possible. As we have fast upward acceleration, market probably will try to complete 1.618 AB=CD target and simultaneously test WPR1. This also could happen by appearing of Butterfly “Sell” pattern. 1.27 extension of recent retracement stands precisely at the same area. It’s not forbidden either trying to take short postion by this butterfly, since we will be able to place tight stop. But let’s not cook hare before catching him. The morn will come and the meat with it – the butterfly will come and the short position with it, right?
1-hour
So, what else to watch on EUR? Hourly chart shows that current low is Agreement – combination of 1.618 AB=CD down and 5/8 Fib support. If market still has intension to move up – this level should hold and keep market from downward continuation. If it will happen so that price will start move down and break it, take out this low – it will probably mean that we will not get any upward action on 4-hour chart and market has started move down as right wing of daily butterfly pattern. Besides, if this will happen, market already will be below WPP and this is also will look bearish.
Conclusion:
While price stands in 1.33-1.38 area we can’t speak either on upward or downward breakout. To change really big picture market has to show breakout out of it. Still, market right now stands around crucial area – combination of YPP and monthly MACDP. Appearing of bullish grabber in June or July could resolve the riddle fast on further action. Conversely moving below YPP will shift monthly trend bearish as well and could lead to further EUR depreciation. Currently economy factors mostly point of further dollar weakness as Fed drags out even hints on possible rate hiking. Only some geopolitical tensions could support dollar as safe haven currency and particular the same tensions could lead to shy downward dive on EUR that we expect to see.
On coming week we mostly will deal with respect of current 1.3475-1.3520 support area. Progress here is very slow. The first part of our trading plan suggests monitoring of shy upward continuation and whether price will remain below 1.3676 level or not. Alternatively, we will look over 1.3571 low. This will also be a sign of downward reversal if market will break it instead of upward continuation. Second step of our plan – if any reversal pattern will be formed (say, butterfly “sell” on 4-hour chart), we can try to take scalp short position. This is a program for coming week.
But primary object on EUR is daily reversal pattern...
The technical portion of Sive's analysis owes a great deal to Joe DiNapoli's methods, and uses a number of Joe's proprietary indicators. Please note that Sive's analysis is his own view of the market and is not endorsed by Joe DiNapoli or any related companies.