Sive Morten
Special Consultant to the FPA
- Messages
- 18,654
EUR/USD Daily Update, Tue 28, June 2011
Good morning,
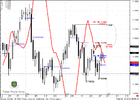
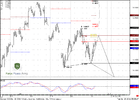
Current situation on market is skewed by news. From the one point of view, market has already shown retracement on daily time frame, after it has hit 0.618 target from big AB=CD and now should continue move down.
But it suddenly stops and turns into consolidation.
One of the reasons for that is a long nasty black candle on daily time frame. Very often, when such days appears - market stands in the range of that day fo some time. That is currently happens. That's from technical point of view.
From fundamental point of view it tells, that market is indecision.
And we could see some different scenarios:
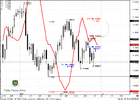
1. Butterfly buy 1.3940;
2. Gartley "222" 1.4430.
Let's speak first about Butterfly.
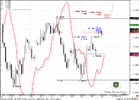
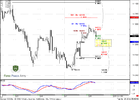
Just above the market is 1.4340 area. This area is extremely important for us. Because this is weekly pivot resistance 1, 0.786 Fib resistance and 1.618 target of AB-CD on houlry chart.
But mostly because this is a breakeven point for daily trend. If market will pass through it, then daily trend will turn bullish and more probable will become "222" pattern.
Also 0.786 level is very typical for Butterflies. So, first and primary task for us today is to watch for 1.4340. I think that it will be hit, if take in account strength of momentum on hourly chart.
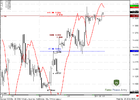
Second, if market still will pass it. Then, the next target is Agreement at 1.4440 - that will be also Gartley "222".
It's imossible to predict something with more precise right now. That's why I offer you to follow the market tactics and not run ahead of it. What does it mean?
For instance market has hit 1.4340 level. Do not just jump in. Wait reversal, and acceleration down, 4-hour and hourly trend turns bearish, market will move below pivot again - and only after that enter on some retracement.
Otherwise, you can become great loss catcher.
Good morning,
Current situation on market is skewed by news. From the one point of view, market has already shown retracement on daily time frame, after it has hit 0.618 target from big AB=CD and now should continue move down.
But it suddenly stops and turns into consolidation.
One of the reasons for that is a long nasty black candle on daily time frame. Very often, when such days appears - market stands in the range of that day fo some time. That is currently happens. That's from technical point of view.
From fundamental point of view it tells, that market is indecision.
And we could see some different scenarios:
1. Butterfly buy 1.3940;
2. Gartley "222" 1.4430.
Let's speak first about Butterfly.
Just above the market is 1.4340 area. This area is extremely important for us. Because this is weekly pivot resistance 1, 0.786 Fib resistance and 1.618 target of AB-CD on houlry chart.
But mostly because this is a breakeven point for daily trend. If market will pass through it, then daily trend will turn bullish and more probable will become "222" pattern.
Also 0.786 level is very typical for Butterflies. So, first and primary task for us today is to watch for 1.4340. I think that it will be hit, if take in account strength of momentum on hourly chart.
Second, if market still will pass it. Then, the next target is Agreement at 1.4440 - that will be also Gartley "222".
It's imossible to predict something with more precise right now. That's why I offer you to follow the market tactics and not run ahead of it. What does it mean?
For instance market has hit 1.4340 level. Do not just jump in. Wait reversal, and acceleration down, 4-hour and hourly trend turns bearish, market will move below pivot again - and only after that enter on some retracement.
Otherwise, you can become great loss catcher.
")