Sive Morten
Special Consultant to the FPA
- Messages
- 18,621
Monthly
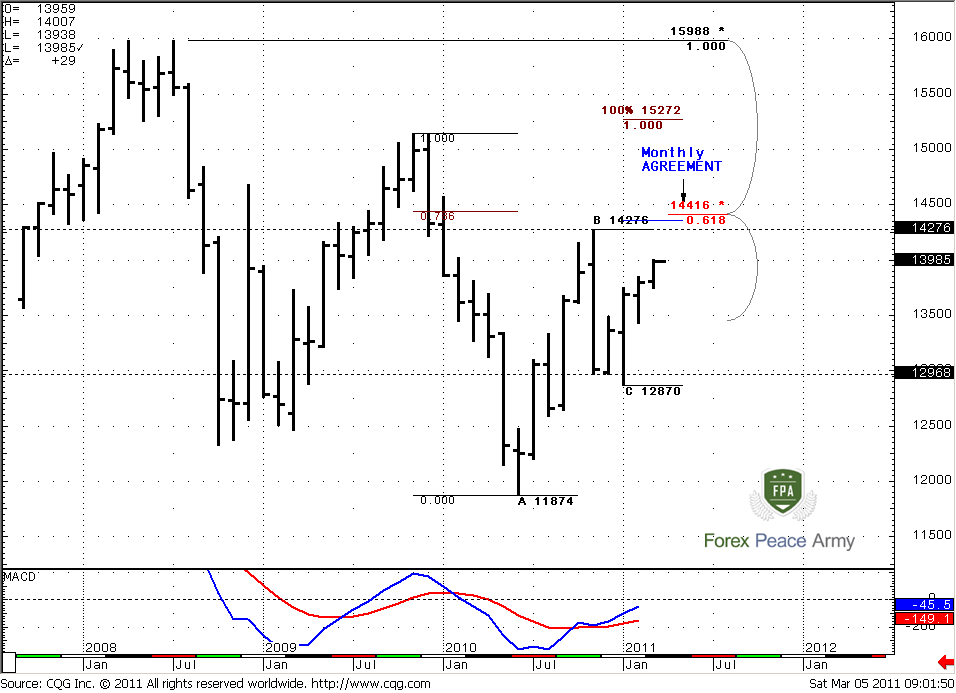
Since market continues to move higher, there are some more important details we can add currently. First of all, monthly trend is clearly bullish, price action is bullish also. One important moment here is that when market has shown retracement to “C” point=1.2870 – trend has not been broken, so it has held this 0.618 retracement to the downside.
I still show you the range of this nasty down bar with black dash lines. Currently is a fourth consecutive month of increasing up move, so market almost erase this down bar. But still, major events will happen when (and if) it will reach 1.4276.
Now take a look at monthly ABC pattern. The nearest target is 0.618 Fib expansion stands at 1.4354 – just above the highs at 1.4276. I suppose, you can imagine what will happen, when market will trigger stops that had been placed their – in most unwelcome place. But I’m not done yet. Just above it – strong Fib resistance stands. This is major 5/8 resistance at 1.4416 from all time high. The coincidence of Target and Fib resistance creates Agreement. Also 1.4444 is 0.786 Fib resistance from the recent swing down. What all this stuff means for us?
First, 1.4350-1.44 is a nearest monthly target. Second, the probability suggests that stops above 1.4276 will be triggered, if market will continue move up. Third – market can show W&R due to strong resistance just above the previous highs, or, at least, bounce to the downside during first touch of this area.
Taking into account some fundamental thoughts about difficulties with supporting the same economy growth as for EU Core, as Periphery, I suppose, that W&R has more probability to happen, rather then further EUR upmove.
Weekly
Weekly trend is also bullish. Let’s start from the targets first. Look at initial ABC pattern – 1.272 expansion target stands at 1.4443. Meantime the most recent AB-CD pattern has a 100% target at 1.4410 – also at Agreement with monthly Fib resistance. So, at 1.4350-1.4440 are stand – three different ABC targets (1.4354; 1.4443; 1.4410), monthly major 5/8 Fib resistance (1.4416) and 0.786 Fib resistance 1.4444. So, I do not how you, guys, are but I definitely will not want to buy in 1.4350-1.4440 area and will close any Long positions if I’ll have any. So, that’s the target.
#1
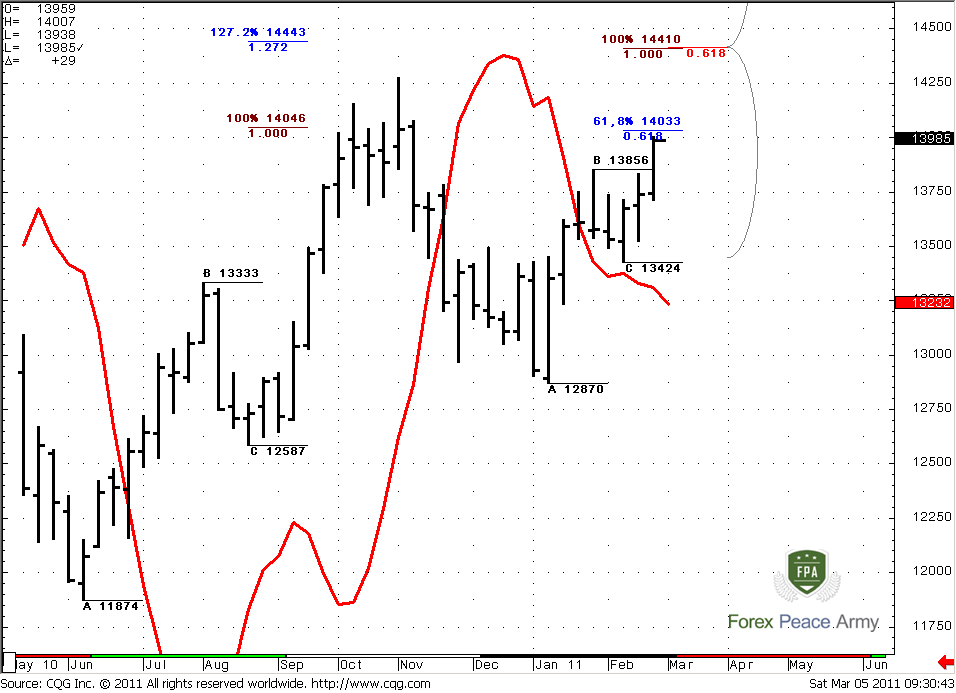
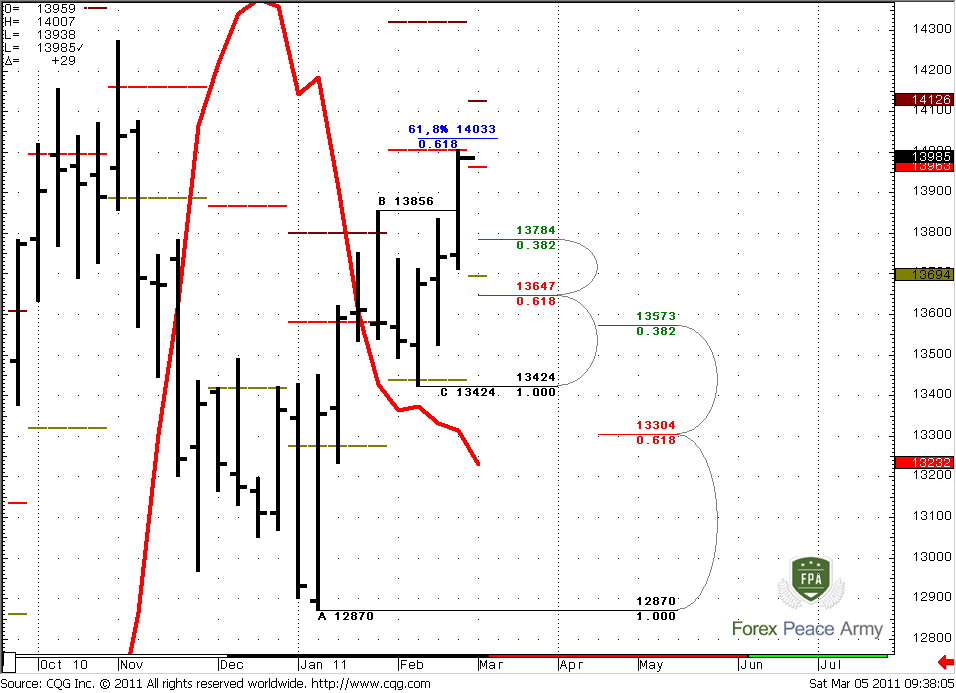
On the chart #2 let’s take a look, where we can enter. This will be very useful for position traders, who trade based on monthly and weekly time frames. First, we see that both trends are bullish - as monthly, as weekly. It means that we have only single long-term context – Buy. At the same time, we can see, that market has hit monthly pivot resistance 1 (red dash line) and 1.4033 – is 0.618 Fib expansion target. The odds suggest that market could bounce from there, so it’s not the time to buy right now. The fact, that market neither oversold nor overbought as on weekly as on monthly tells us, that we should use for enter the nearest Fib support. This moment also is confirmed by shallow B-C retracement. So, this support is 1.3784. Just below this area – Weekly Confluence support 1.3573-1.3647 – it could be used for placing stop just below it.
#2
Daily
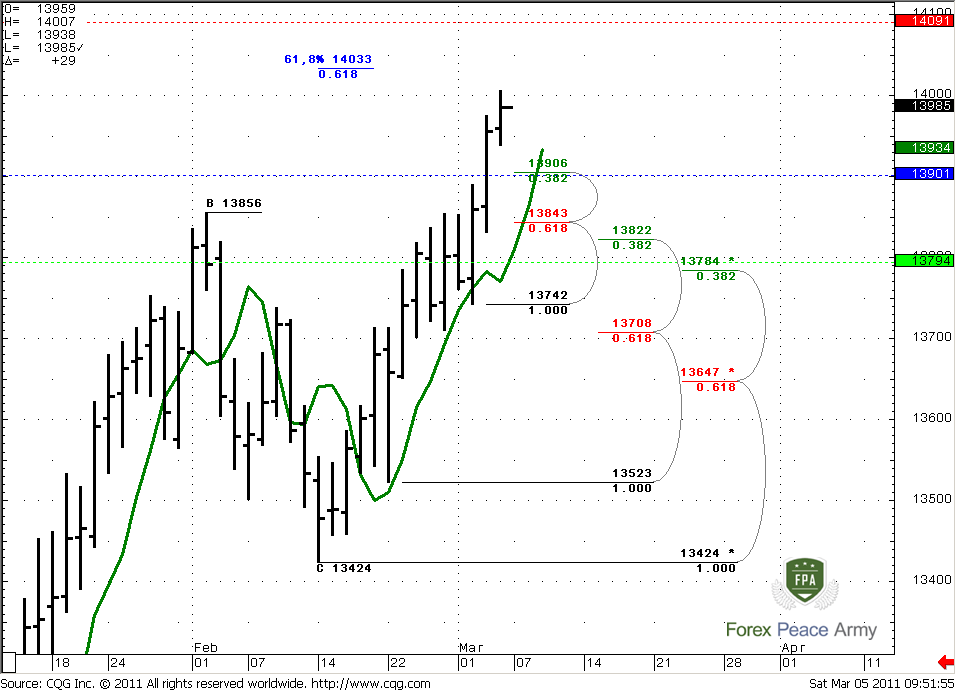
Daily trend is bullish also, market neither overbought nor oversold. The colored lines are pivot levels, as usual – blue stands for pivot point = 1.3901, lime for pivot support 1=1.3794, and red one for resistance 1=1.4091.
The major nuance that could become important for coming week is that market has not quite reached 1.4033 target from Gartley ‘222’ pattern, that we’ve talked about on previous week. So, I think that this should happen before any retracement to the downside. May be market even will reach pivot resistance 1, I don’t know. But assumption of bouncing from target seems logical. Whatever bouncing will be – we should use it to enter long. That’s clear.
Talking about supports, we have three level, that strong enough to look at for possible enter. First one is 1.3906 that includes 3/8 Fib support and pivot point. Second is daily Confluence support 1.3822-1.3843 and the last one is 1.3784 that also coincides with pivot support 1. So, which one we should choose? Currently it’s impossible to say, because it will depend from the retracement style – it could be twofold.
Look at price behavior – we see excellent thrust with good separation from green line that is 3x3 SMA. Take a note that market did not show any meaningful (at least 3/8) retracement during this move. It means that there are a lot of stops somewhere below the market. So, we have a context for daily B&B “Buy” or DRPO “Sell” pattern and depending on which one will happen – there will be different levels for enter long. If it will be B&B “Buy” then I think, that we can use 1.3906 or K-area to enter. If it will be DRPO – then deeper level should be chosen – 1.3784. Anyway, I do not want to buy right now, because 1.4033-1.4091 is an area of resistance. If you still want to do it – try to answer on the simple question – “Where will you place your stop from the daily time frame point of view?” My answer is the nearest logical area is below weekly pivot, but in this case risk/reward ratio is awful. So, my decision is here – wait.
4-hour
Although I’ve said that soon retracement is probable, on intraday charts I do not see any reversal signs yet. But couple of notices could be made. First, market has hit 1.618 Fib expansion target from initial ABC pattern at 1.3992 (this was our Friday’s target, by the way). Second, 4-hour time frame will be overbought at 1.4045 area on Monday – right at daily 1.4033 target.
Now pay attention to 1.39 area – this is 4-hour confluence support, 4-hour oversold and weekly pivot point. Also this is 50% support of strong up bar – so, I think that this is a nearest destination for retracement. But when this retracement will start – immediately in the beginning on Monday, or after reaching 1.4033-1.4045 area first – I do not know. Market does not show any signs that could allow us to make judgment about it. So, as we can’t tell now – will it stop at 1.39 or show deeper retracement.
All that I see, currently is that market has hit intraday target and stands just below daily target. So retracement is probable here. And the first solid support is 1.39.
Conclusion:
Position traders:
Market has bullish context, but it stands at resistance – wait the shallow pullback
Buy 1.3784, S/L 1.3550, T/P 1.4350
Intraday traders:
No signs of retracement yet, but market has hit intraday 1.3992 target and very close to daily 1.4033 target. Retracement down could start from 1.4033-1.4045 area on Monday. The nearest target of this possible retracement is 1.39 area.
Also there is no problem, if you will try to trade this retracement. But wait for clear Sell signals before entering.
The technical portion of Sive's analysis owes a great deal to Joe DiNapoli's methods, and uses a number of Joe's proprietary indicators. Please note that Sive's analysis is his own view of the market and is not endorsed by Joe DiNapoli or any related companies.
Since market continues to move higher, there are some more important details we can add currently. First of all, monthly trend is clearly bullish, price action is bullish also. One important moment here is that when market has shown retracement to “C” point=1.2870 – trend has not been broken, so it has held this 0.618 retracement to the downside.
I still show you the range of this nasty down bar with black dash lines. Currently is a fourth consecutive month of increasing up move, so market almost erase this down bar. But still, major events will happen when (and if) it will reach 1.4276.
Now take a look at monthly ABC pattern. The nearest target is 0.618 Fib expansion stands at 1.4354 – just above the highs at 1.4276. I suppose, you can imagine what will happen, when market will trigger stops that had been placed their – in most unwelcome place. But I’m not done yet. Just above it – strong Fib resistance stands. This is major 5/8 resistance at 1.4416 from all time high. The coincidence of Target and Fib resistance creates Agreement. Also 1.4444 is 0.786 Fib resistance from the recent swing down. What all this stuff means for us?
First, 1.4350-1.44 is a nearest monthly target. Second, the probability suggests that stops above 1.4276 will be triggered, if market will continue move up. Third – market can show W&R due to strong resistance just above the previous highs, or, at least, bounce to the downside during first touch of this area.
Taking into account some fundamental thoughts about difficulties with supporting the same economy growth as for EU Core, as Periphery, I suppose, that W&R has more probability to happen, rather then further EUR upmove.
Weekly
Weekly trend is also bullish. Let’s start from the targets first. Look at initial ABC pattern – 1.272 expansion target stands at 1.4443. Meantime the most recent AB-CD pattern has a 100% target at 1.4410 – also at Agreement with monthly Fib resistance. So, at 1.4350-1.4440 are stand – three different ABC targets (1.4354; 1.4443; 1.4410), monthly major 5/8 Fib resistance (1.4416) and 0.786 Fib resistance 1.4444. So, I do not how you, guys, are but I definitely will not want to buy in 1.4350-1.4440 area and will close any Long positions if I’ll have any. So, that’s the target.
#1
On the chart #2 let’s take a look, where we can enter. This will be very useful for position traders, who trade based on monthly and weekly time frames. First, we see that both trends are bullish - as monthly, as weekly. It means that we have only single long-term context – Buy. At the same time, we can see, that market has hit monthly pivot resistance 1 (red dash line) and 1.4033 – is 0.618 Fib expansion target. The odds suggest that market could bounce from there, so it’s not the time to buy right now. The fact, that market neither oversold nor overbought as on weekly as on monthly tells us, that we should use for enter the nearest Fib support. This moment also is confirmed by shallow B-C retracement. So, this support is 1.3784. Just below this area – Weekly Confluence support 1.3573-1.3647 – it could be used for placing stop just below it.
#2
Daily
Daily trend is bullish also, market neither overbought nor oversold. The colored lines are pivot levels, as usual – blue stands for pivot point = 1.3901, lime for pivot support 1=1.3794, and red one for resistance 1=1.4091.
The major nuance that could become important for coming week is that market has not quite reached 1.4033 target from Gartley ‘222’ pattern, that we’ve talked about on previous week. So, I think that this should happen before any retracement to the downside. May be market even will reach pivot resistance 1, I don’t know. But assumption of bouncing from target seems logical. Whatever bouncing will be – we should use it to enter long. That’s clear.
Talking about supports, we have three level, that strong enough to look at for possible enter. First one is 1.3906 that includes 3/8 Fib support and pivot point. Second is daily Confluence support 1.3822-1.3843 and the last one is 1.3784 that also coincides with pivot support 1. So, which one we should choose? Currently it’s impossible to say, because it will depend from the retracement style – it could be twofold.
Look at price behavior – we see excellent thrust with good separation from green line that is 3x3 SMA. Take a note that market did not show any meaningful (at least 3/8) retracement during this move. It means that there are a lot of stops somewhere below the market. So, we have a context for daily B&B “Buy” or DRPO “Sell” pattern and depending on which one will happen – there will be different levels for enter long. If it will be B&B “Buy” then I think, that we can use 1.3906 or K-area to enter. If it will be DRPO – then deeper level should be chosen – 1.3784. Anyway, I do not want to buy right now, because 1.4033-1.4091 is an area of resistance. If you still want to do it – try to answer on the simple question – “Where will you place your stop from the daily time frame point of view?” My answer is the nearest logical area is below weekly pivot, but in this case risk/reward ratio is awful. So, my decision is here – wait.
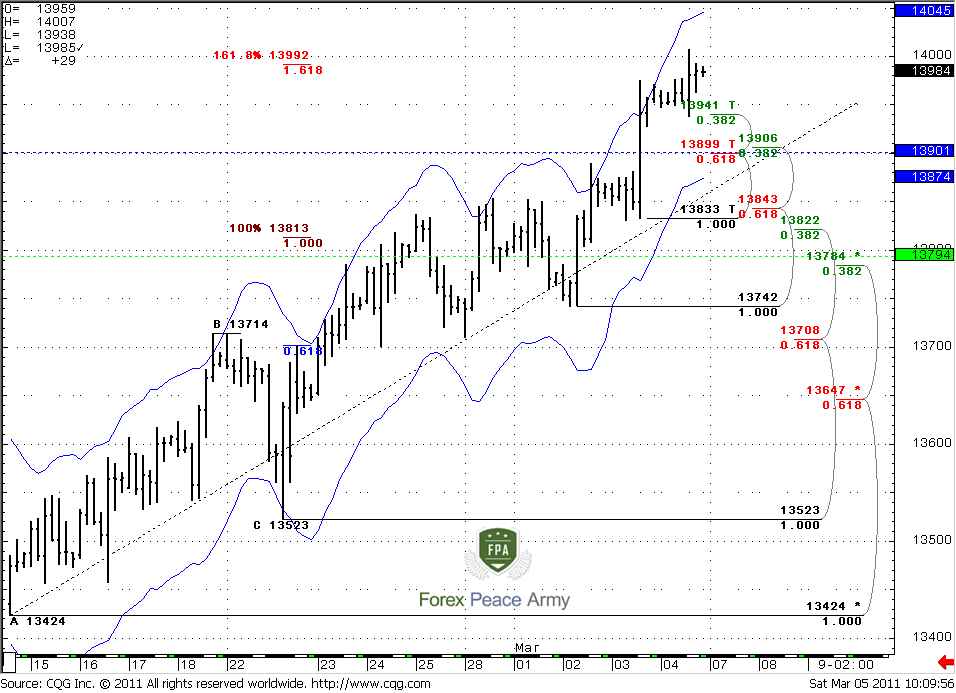
4-hour
Although I’ve said that soon retracement is probable, on intraday charts I do not see any reversal signs yet. But couple of notices could be made. First, market has hit 1.618 Fib expansion target from initial ABC pattern at 1.3992 (this was our Friday’s target, by the way). Second, 4-hour time frame will be overbought at 1.4045 area on Monday – right at daily 1.4033 target.
Now pay attention to 1.39 area – this is 4-hour confluence support, 4-hour oversold and weekly pivot point. Also this is 50% support of strong up bar – so, I think that this is a nearest destination for retracement. But when this retracement will start – immediately in the beginning on Monday, or after reaching 1.4033-1.4045 area first – I do not know. Market does not show any signs that could allow us to make judgment about it. So, as we can’t tell now – will it stop at 1.39 or show deeper retracement.
All that I see, currently is that market has hit intraday target and stands just below daily target. So retracement is probable here. And the first solid support is 1.39.
Conclusion:
Position traders:
Market has bullish context, but it stands at resistance – wait the shallow pullback
Buy 1.3784, S/L 1.3550, T/P 1.4350
Intraday traders:
No signs of retracement yet, but market has hit intraday 1.3992 target and very close to daily 1.4033 target. Retracement down could start from 1.4033-1.4045 area on Monday. The nearest target of this possible retracement is 1.39 area.
Also there is no problem, if you will try to trade this retracement. But wait for clear Sell signals before entering.
The technical portion of Sive's analysis owes a great deal to Joe DiNapoli's methods, and uses a number of Joe's proprietary indicators. Please note that Sive's analysis is his own view of the market and is not endorsed by Joe DiNapoli or any related companies.
") there some one thing i not able too understand
there some one thing i not able too understand