FOREX PRO Weekly, March 07-11, 2011

EUR/USD Daily Update, Fri 11, March 2011

Hello everybody,

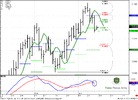
EUR has hit 1.38 area - 3/8 Fib support, weekly pivot support and 1.618 target of hourly batterfly. The nasty sell-off has come from fundamental news - Moody's has downgraded Spain rating to AA 2 (1 notch), also some speculation about future of Portugal, Greece and Ireland continues - as we've once said - the periphery problems will press EU economy, looks like this starts to happen.

Ok, let's move to pure technics...
Although daily trend turns bearish - B&B is directional trade, and Direction overrules trend. Daily context for B&B is still valid - just 2 closes below 3x3, market at strong support. If market will not hold here - possibly, context for B&B will be doomed. But now it still possible. The target - 1.3915. Still...

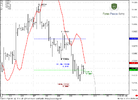
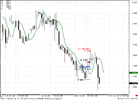
4-hour and 1 hour charts
We had strong sell off yesterday. Taking this into account, I prefer to see some clear Buy patterns on hourly time frame before enter in B&B trade. Currently I do not see any. After so strong sell off is too dangerous to buy blindly right from support area. May be it will be reverse H&S on daily, I do not know yet.
You can see, that 1.3740 AB=CD target stands just below the market. I prefer to see, that market will hit it, and then show some bullish reversal pattern or something, that gives me the confidence to enter Long

P.S.
By the way, The first part of Chapter 2 of Forex Military school has released today:
Forex Military School - Forex Peace Army Forum
 

Attachments

  • EUR_D_11_03_11.PNG
    EUR_D_11_03_11.PNG
    46.3 KB · Views: 101
  • EUR_4H_11_03_11.PNG
    EUR_4H_11_03_11.PNG
    42.7 KB · Views: 102
Sive,

I'm looking to BUY the BF just below the current market in the June contract. Do you have a S.L. recommendation. I like the DAILY B&B opportunity here.

Do you agree with the BF BUY

Thanks in advance, as always.

On the 1H chart

Hi Rick,
sorry for delay, possibly my comments will be too late.
What is BF?
I'll appreciate if you attach the chart with the post - then I can answer much faster...
 
I'm still looking for the hourly close but would this have enough thrust to be considered DRPO if we get the close above the 3x3 here? (3x3 is the white MA on chart)

Thanks for your great analysis. Do you see more downside risk for the EUR/USD now that we've moved below major support areas?

~Markus

Yes, Markus
this is nice DRPO. Although my comments are late...
If let me to say...
There are too many indicators on your chart. It looks heavy. Try use only those that are absolutely neccesary for particular analysis.
Here the chart of DRPO - you should enter after doji bar has been completed.
It almost hit 1.618 target
 

Attachments

  • AUD_1H_DRPO.PNG
    AUD_1H_DRPO.PNG
    32.5 KB · Views: 95
Last edited:
Hi sir, can you tell me where to find the futures prices, so I can see how the numbers you use for entry and exit on your charts correlate to the spot market prices? It looks like the .618 target of this up move would be around 1.3935 on MT4. Does that seem correct to you? I don't want to place my exit point too high and miss exiting in profit.

Hi Icarus,
Well, in fact you even don't need futures quotes. You can find the corresponding levels by applying the same tools that I do in research. For instance - you definitely see, my Fib levels and what extremes have been used for their calculation - use the same extremes and MT4 will show you correct numbers. The same with Fib extensions and other stuff. Because futures and spot markets show the same shapes of swings.
But if you still want the quotes - CME Group - Futures & Options Trading for Risk Management Find there EUR FX futures contract.


Hi Sive,

Is it possible to give us one sentence update on the current market development comparing with the trade plan for the day?

If you accept this idea, probably the best time for posting your comment could be just before USA open (13:30 GMT). That means 4-5 hours since your daily video research analysis had been distributed. What do you think?

Thanks.

Hi Alf,
I'll try to find time for that. But I can't promise the stability of updates.
 
4-hour chart
trend is clearly bearish, market has formed a stop grabber, that suggests taking out the lows - until this will happen, I will not even think about entering on long side.

So here is our trading plan:
1. Wait, when butterfly will reach the target at 1.3830 area.
2. Look for 60min buy signals in this area
3. It will be safer if we will recieve additional confirmation from hourly trend - when it will turn to bullish, enter on shallow retracement
....................
7. If market will break through 1.3830 - 1.618 target of Butterfly at 1.3800 area. This level also contains 3/8 Fib support and weekly pivot support. That's the next area to watch for.

Hi Sive,

As usual, thanks for your great analysis!

Question, do you think that your call of a potential B&B buy the last 2 days is a risky call, if you compare it to the conventional rule of not trading against the trend. As market has daily lower close the last few days.

What our forex teachers will tell us is to look for selling opportunities in a downtrend. For example, yesterday we could look for selling opportunities in the 1.3900-1.3950 area and target 1.3800-1.3750, which may be a 'safer' call than, buying at 1.3830-1.3800 area.

As usual, after watching your video i got too excited and entered long at 1.3830 area yesterday and was burned for 50pips when it dipped below 1.3800. of course it is my own fault to take the riskier option of anticipating the call. nevertheless would appreciate your view on my question

Hi Eric
All that I will say not for my discharge - I also make mistakes as any other trader. But let's move through our trade plan, that I've post - reread points 1-3.
Now, look at hourly chart and tell me do you see this one:
1. - Completed
2. - I do not see any - just strong nasty bars to the downside
3. - Never happened - till now. Trend was strongly bearish.
7.- has achieved and we are watching currently for this area.

Sorry, If I've confused you with my comments. Really...
Now about trading with the trend. You're absolutely right - we have to follow the trend. But what trend - monthly, daily, 60-min? How we identify it?

When I make an analysis - I just share with you with my thoughts, and hope that they could be useful for you. But to agree or not - this is up to you.
That IS your homework - to use my help, if you agree with me, but to have your own opinion.

Hi Sive,
you did not confuse me, its my own impatience n greed that made me jumped in. (J pal u are right there wasnt any buy signal) i think i am hyper hank.

you asked a profound question about trend that really make me think.. i guess as intra day traders maybe we look at 1hr or 4hr chart. i guess no
definite answer.

Eric
Grateful 'Recruit'
 
Great analysis sir .. :D but as per my strategy :err: i am going in here :( not risking much .

Sir really like too show you something ... after learning harmonic and DiNapoli from you(i hardly understand the book,Ur analysis and Visual make things all clear) this is my Balance Graph on real account :) Made a solid return of 300%+ in 4 months :) :) all becoz of you .. thanks a lot sir
 

Attachments

  • ficci.gif
    ficci.gif
    14.9 KB · Views: 78
  • trecy.jpg
    trecy.jpg
    22.4 KB · Views: 78
Last edited:
Hi Sive,
you did not confuse me, its my own impatience n greed that made me jumped in. (J pal u are right there wasnt any buy signal) i think i am hyper hank.

you asked a profound question about trend that really make me think.. i guess as intra day traders maybe we look at 1hr or 4hr chart. i guess no
definite answer.

Eric
Grateful 'Recruit'

All We are Hyper Hanks sometime...
I'm sorry, If my analysis has pushed you to loss. May be I should not post definite levels, because many of forumers follow them blindly, - but this is not what I want, and this is not in a row with this forum purposes...
 
Great analysis sir .. :D but as per my strategy :err: i am going in here :( not risking much .

Sir really like too show you something ... after learning harmonic and DiNapoli from you(i hardly understand the book,Ur analysis and Visual make things all clear) this is my Balance Graph on real account :) Made a solid return of 300%+ in 4 months :) :) all becoz of you .. thanks a lot sir

Hi Jyotiprakash Pal
I'm also carefully long now. Let's see - will EUR be able to hold above 1.38...

Well done! (about balance) But this is not my servises...
I'm happy that my 2 cents were useful and had help you to achive such result.
 
Back
Top