Sive Morten
Special Consultant to the FPA
- Messages
- 18,644
Unfortunately our cooperation with CQG is over and now I can do nothing except start using of MT 4 software for our researches. Although I have “Bloomberg” and “Reuters Data Stream” software, they are also very expensive and outstanding, but a bit for other purposes. They are not so good for technical analysis in general and for DiNapoli method in particular. I can say even that they absolutely not suitable for DiNapoli approach.
Still, let’s find positive even with negative. Now we can eliminate difference with futures quotes and spot quotes. It will be easier to track such indicators as pivot points, Fib levels etc. Also our forum member, Michael has programmed indicator that makes simpler drawing of 3/8 and 5/8 Fib levels. This also will be some help in our work.
Monthly
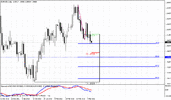
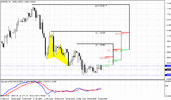
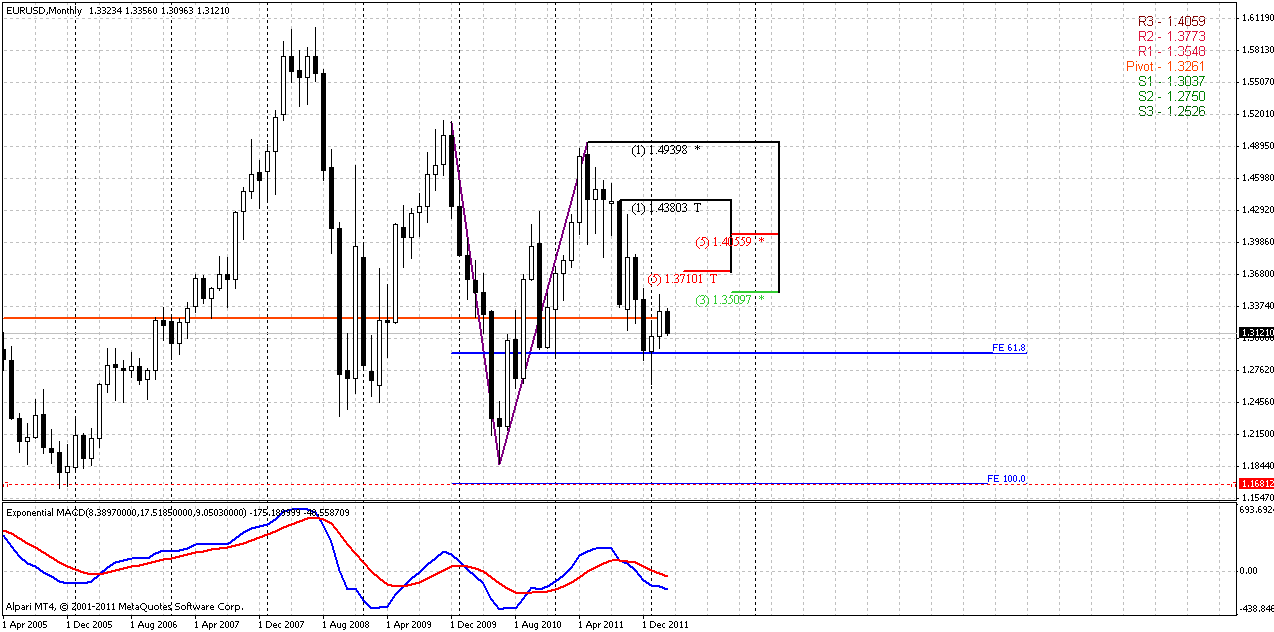
Current situation on monthly charts stands near perfect. After hitting of 0.618 Fib extension target market has shown 0.382 retracement and now is showing downward pullback. As we’ve said in previous research 1.3509-1.3709 is solid K-resistance at monthly chart and typically, price should not break it after just hitting of 0.618 target. Otherwise, it will be a strong sign that market sentiment has changed and bears’ power falls under question. So, now we can see that everything is according with bears plan and our long-term expectation of 1.1650 level. Also market has touched monthly pivot point and pulled back from it. This tells about long-term bearish sentiment on the market.
One thing that has to be mentioned here is possibility of not just A-B retracement but AB=CD retracement on lower time frames. In this case market could show a bit deeper move inside of K-resistance. Although this is not significant for monthly time frame, it could become very important for us, since we mostly trade at daily charts.
As a conclusion here we can point that overall context holds bearish and market shows absolutely normal and logical price action after reaching minor extension target.
Weekly
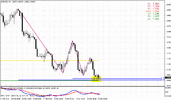
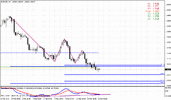
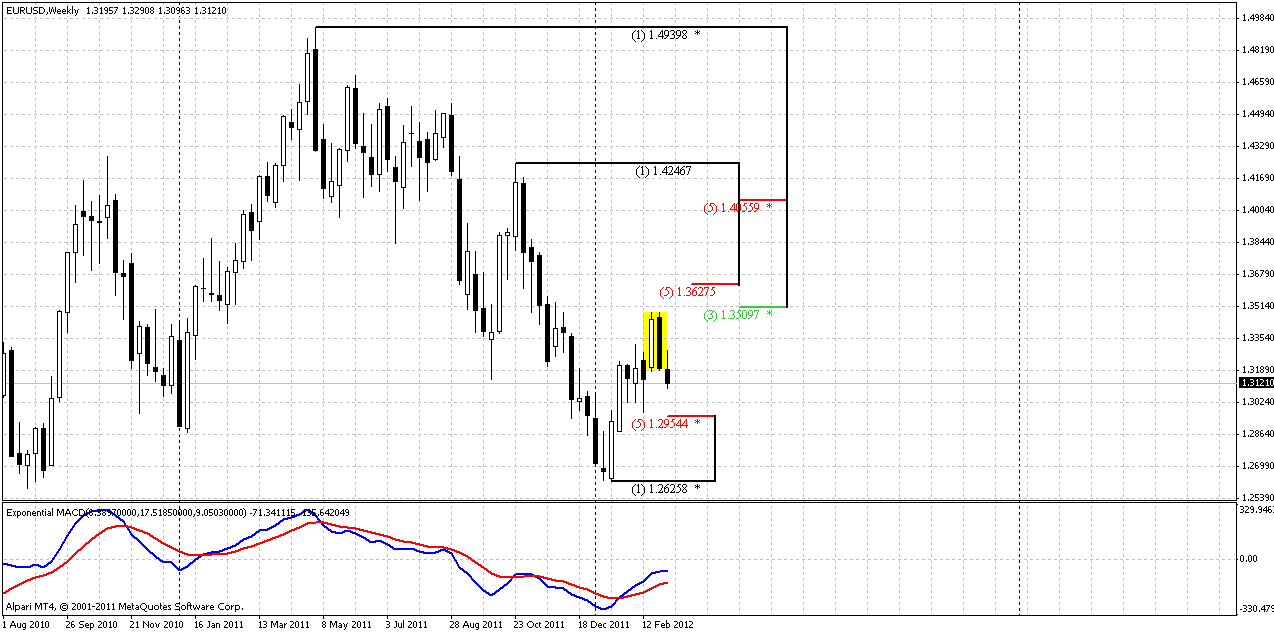
This time frame does not demand a lot of comments, I suppose. Currently situation is developing according with thoughts that we’ve discussed on previous week – market is reacting on bearish engulfing pattern. As we’ve said, this could become huge advantage for us, since we will know market’s direction for the whole week in advance.
Still, in the beginning of previous week we’ve expected some pullback up to enter short. This pullback has happened precisely as we wanted it – 0.382 resistance and weekly pivot point. This small retracement gives as additional confidence with bearish power possible continuation to 1.29-1.2950 area.
Here is you also can see that market holds below monthly pivot point at 1.3261.
So, all that we will have to do is to trade coming week on short side of the market. There is only one warning that should be made here – the same as we’ve made higher. Be careful to hold shorts below 1.29 level, because market still could turn to AB=CD retracement on weekly, because trend still holds bullish and current move down is just attempt to finish engulfing pattern’s target.
Daily
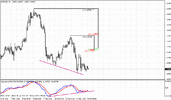
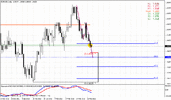
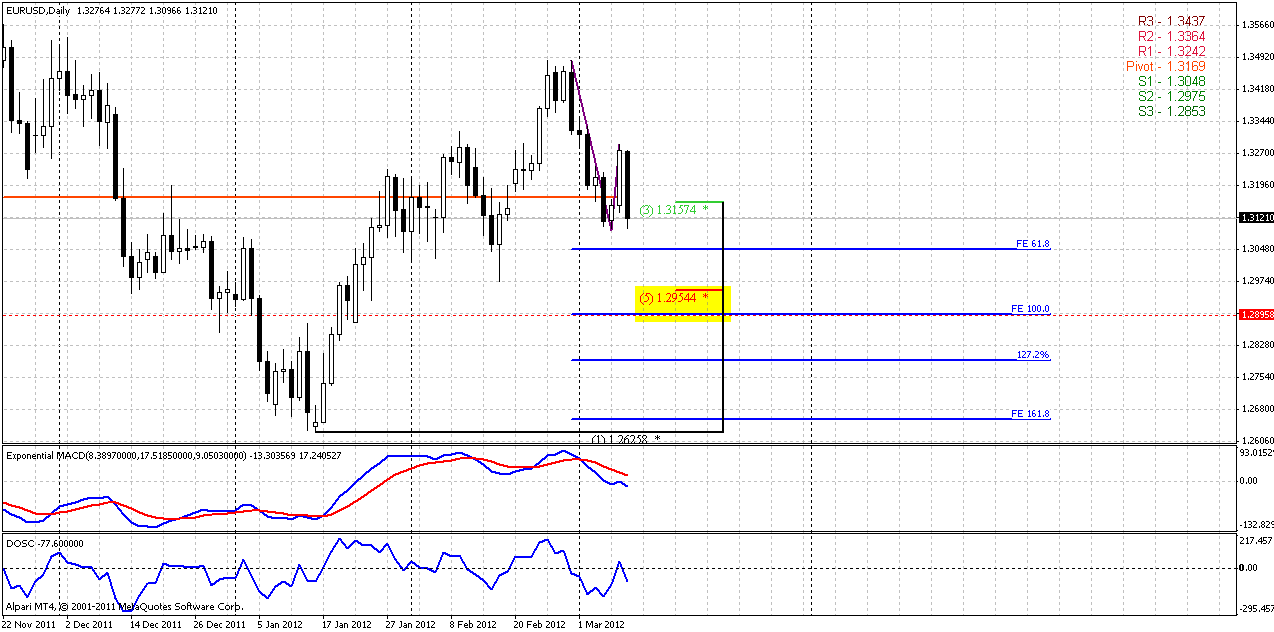
Trend holds bearish and covers previous 3/8 retracement, market is not at oversold by DOSC, so there is no solid barriers to stop market from further move down. Pay attention how strong pullback was from our resistance level. That is what we particularly want not see as downward continuation. Although current situation in EU holds unstable and anything could happen, but looking at the way how it is developing by now, I dare to suggest, that we should focus on downward continuation and search possibility to join with bearish trend. Target is the same, as we’ve specified already million of times – 1.29-1.2950 Agreement area.
Hourly and 4-hour
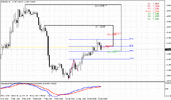
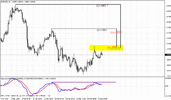
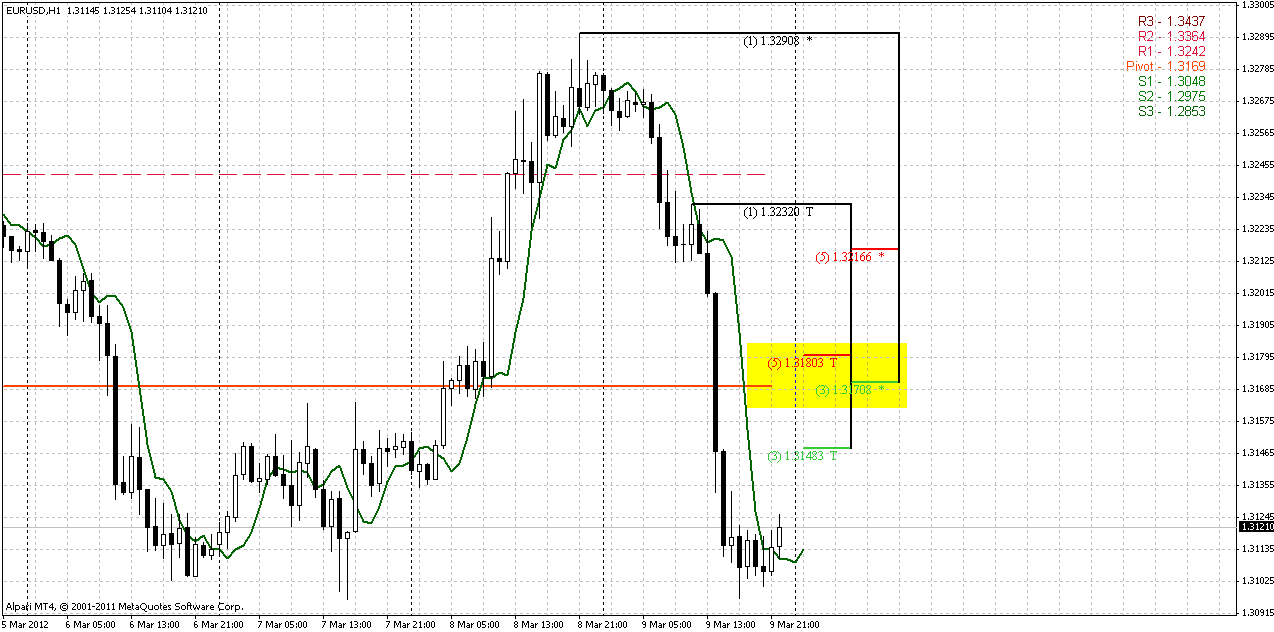
I do not have 4-hour chart, because there is nothing important, but only trend direction – it’s bearish. Most important events for us stand at hourly chart. I suppose, you can make right conclusion by yourself. Here we have context for 3 potential DiNapoli Directional trades – B&B “Sell”, DRPO “Buy” or DRPO “Buy Failure”. All of them could be used to enter short, but at different levels, and DRPO “Buy” could be traded separately, if you’re a scalper.
So, If it will be B&B, market probably will reach either 1.3150 level or even K-resistance and pivot at first penetration of 3x3 DMA. In this case we can enter short. If it will be DRPO “Buy”, then most probable that market will reach K-area 1.3170-1.3180 and pivot point. If it will be DRPO “Failure”, then market will hardly show any significant pullback to the upside and we have to be ready to enter short. Anyway retracement should not be too deep. How to enter is up to you. You may enter right at levels by some reversal patterns at lower time frames, you may wait when hourly trend will turn bearish again and then enter – as we’ve made on previous week and catch this plunge down.
If market will move above K-resistance and pivot point – hold on, do not enter short, wait for further clarification, because this will be not quite logical price action.
Conclusion:
Long-term bias holds bearish, but weekly time frame does not exclude some upward continuation in the way of AB=CD retracement. So, for positional traders will be safer to enter short, when and if weekly trend will turn bearish. Long-term target still stands at 1.16-1.1650 area
On short-term perspective we have weekly bearish engulfing pattern. We expect that by this pattern market could reach as far as 1.29-1.2950 area in nearest week or two.
The technical portion of Sive's analysis owes a great deal to Joe DiNapoli's methods, and uses a number of Joe's proprietary indicators. Please note that Sive's analysis is his own view of the market and is not endorsed by Joe DiNapoli or any related companies.
Still, let’s find positive even with negative. Now we can eliminate difference with futures quotes and spot quotes. It will be easier to track such indicators as pivot points, Fib levels etc. Also our forum member, Michael has programmed indicator that makes simpler drawing of 3/8 and 5/8 Fib levels. This also will be some help in our work.
Monthly
Current situation on monthly charts stands near perfect. After hitting of 0.618 Fib extension target market has shown 0.382 retracement and now is showing downward pullback. As we’ve said in previous research 1.3509-1.3709 is solid K-resistance at monthly chart and typically, price should not break it after just hitting of 0.618 target. Otherwise, it will be a strong sign that market sentiment has changed and bears’ power falls under question. So, now we can see that everything is according with bears plan and our long-term expectation of 1.1650 level. Also market has touched monthly pivot point and pulled back from it. This tells about long-term bearish sentiment on the market.
One thing that has to be mentioned here is possibility of not just A-B retracement but AB=CD retracement on lower time frames. In this case market could show a bit deeper move inside of K-resistance. Although this is not significant for monthly time frame, it could become very important for us, since we mostly trade at daily charts.
As a conclusion here we can point that overall context holds bearish and market shows absolutely normal and logical price action after reaching minor extension target.

Weekly
This time frame does not demand a lot of comments, I suppose. Currently situation is developing according with thoughts that we’ve discussed on previous week – market is reacting on bearish engulfing pattern. As we’ve said, this could become huge advantage for us, since we will know market’s direction for the whole week in advance.
Still, in the beginning of previous week we’ve expected some pullback up to enter short. This pullback has happened precisely as we wanted it – 0.382 resistance and weekly pivot point. This small retracement gives as additional confidence with bearish power possible continuation to 1.29-1.2950 area.
Here is you also can see that market holds below monthly pivot point at 1.3261.
So, all that we will have to do is to trade coming week on short side of the market. There is only one warning that should be made here – the same as we’ve made higher. Be careful to hold shorts below 1.29 level, because market still could turn to AB=CD retracement on weekly, because trend still holds bullish and current move down is just attempt to finish engulfing pattern’s target.

Daily
Trend holds bearish and covers previous 3/8 retracement, market is not at oversold by DOSC, so there is no solid barriers to stop market from further move down. Pay attention how strong pullback was from our resistance level. That is what we particularly want not see as downward continuation. Although current situation in EU holds unstable and anything could happen, but looking at the way how it is developing by now, I dare to suggest, that we should focus on downward continuation and search possibility to join with bearish trend. Target is the same, as we’ve specified already million of times – 1.29-1.2950 Agreement area.

Hourly and 4-hour
I do not have 4-hour chart, because there is nothing important, but only trend direction – it’s bearish. Most important events for us stand at hourly chart. I suppose, you can make right conclusion by yourself. Here we have context for 3 potential DiNapoli Directional trades – B&B “Sell”, DRPO “Buy” or DRPO “Buy Failure”. All of them could be used to enter short, but at different levels, and DRPO “Buy” could be traded separately, if you’re a scalper.
So, If it will be B&B, market probably will reach either 1.3150 level or even K-resistance and pivot at first penetration of 3x3 DMA. In this case we can enter short. If it will be DRPO “Buy”, then most probable that market will reach K-area 1.3170-1.3180 and pivot point. If it will be DRPO “Failure”, then market will hardly show any significant pullback to the upside and we have to be ready to enter short. Anyway retracement should not be too deep. How to enter is up to you. You may enter right at levels by some reversal patterns at lower time frames, you may wait when hourly trend will turn bearish again and then enter – as we’ve made on previous week and catch this plunge down.
If market will move above K-resistance and pivot point – hold on, do not enter short, wait for further clarification, because this will be not quite logical price action.

Conclusion:
Long-term bias holds bearish, but weekly time frame does not exclude some upward continuation in the way of AB=CD retracement. So, for positional traders will be safer to enter short, when and if weekly trend will turn bearish. Long-term target still stands at 1.16-1.1650 area
On short-term perspective we have weekly bearish engulfing pattern. We expect that by this pattern market could reach as far as 1.29-1.2950 area in nearest week or two.
The technical portion of Sive's analysis owes a great deal to Joe DiNapoli's methods, and uses a number of Joe's proprietary indicators. Please note that Sive's analysis is his own view of the market and is not endorsed by Joe DiNapoli or any related companies.
