Sive Morten
Special Consultant to the FPA
- Messages
- 18,621
Monthly
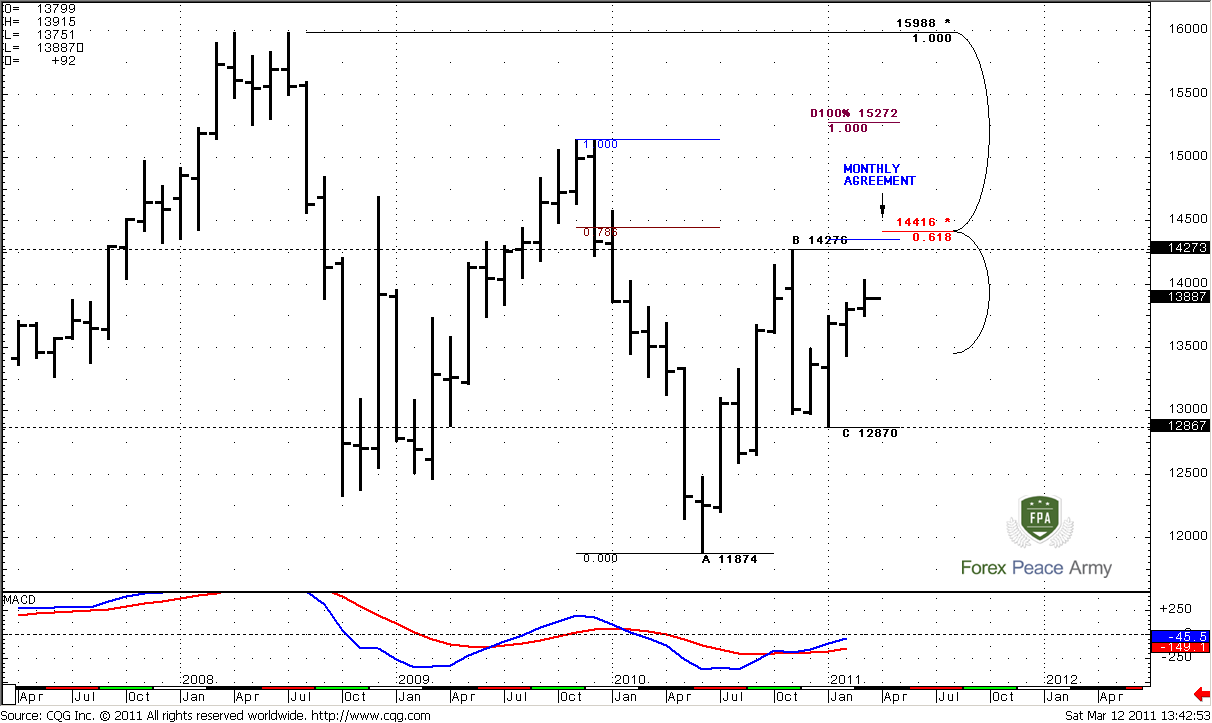
Well, I have nothing to add to monthly and weekly analysis from previous research. The price action during the recent week was shallow, so I leave previous analysis intact.
First of all, monthly trend is clearly bullish, price action is bullish also. One important moment here is that when market has shown retracement to “C” point=1.2870 – trend has not been broken, so it has held this 0.618 retracement to the downside.
I still show you the range of this nasty down bar with black dash lines. Currently is a fourth consecutive month of increasing up move, so market almost erase this down bar. But still, major events will happen when (and if) it will reach 1.4276.
Now take a look at monthly ABC pattern. The nearest target is 0.618 Fib expansion stands at 1.4354 – just above the highs at 1.4276. I suppose, you can imagine what will happen, when market will trigger stops that had been placed their – in most unwelcome place. Just above it – strong Fib resistance stands. This is major 5/8 resistance at 1.4416 from all time high. The coincidence of Target and Fib resistance creates Agreement. Also 1.4444 is 0.786 Fib resistance from the recent swing down. What all this stuff means for us?
First, 1.4350-1.44 is a nearest monthly target. Second, the probability suggests that stops above 1.4276 will be triggered, if market will continue move up. Third – market can show W&R due to strong resistance just above the previous highs, or, at least, bounce to the downside during first touch of this area.
Taking into account some fundamental thoughts about difficulties with supporting the same economy growth as for EU Core, as Periphery, I suppose, that W&R has more probability to happen, rather then further EUR up move.
Weekly
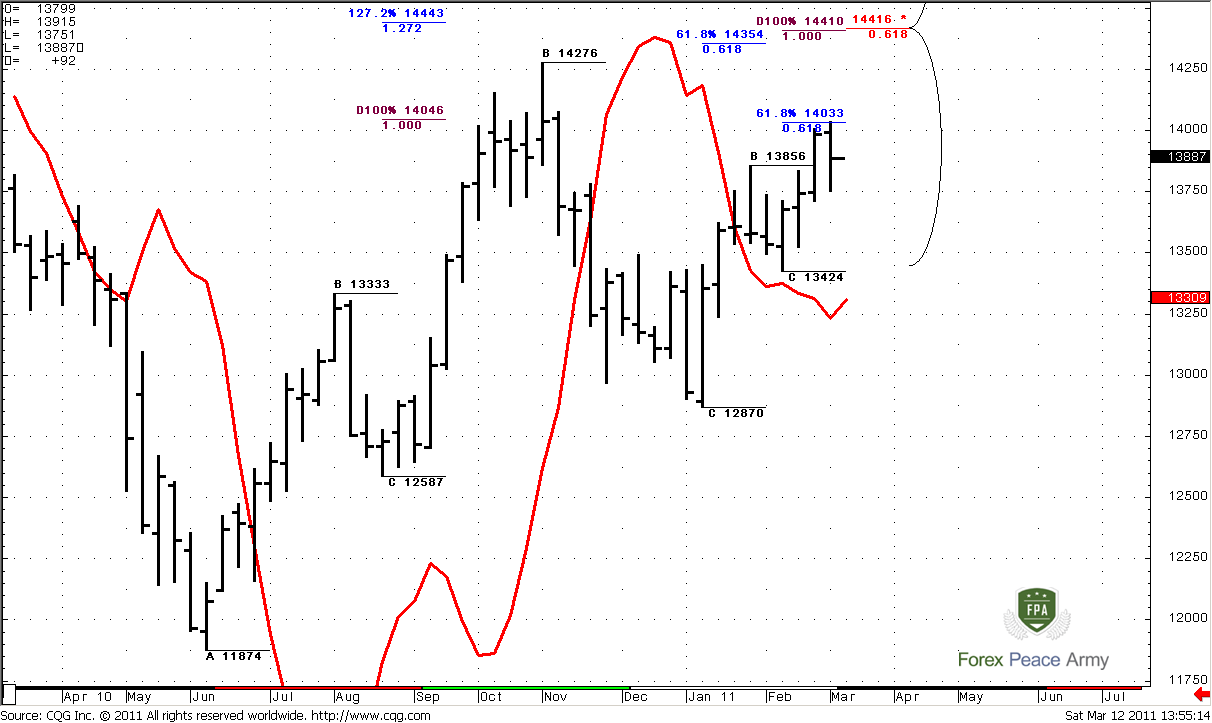
Weekly trend is also bullish. Let’s start from the targets first. Look at initial ABC pattern – 1.272 expansion target stands at 1.4443. Meantime the most recent AB-CD pattern has a 100% target at 1.4410 – also at Agreement with monthly Fib resistance. So, at 1.4350-1.4440 are stand – three different ABC targets (1.4354; 1.4443; 1.4410), monthly major 5/8 Fib resistance (1.4416) and 0.786 Fib resistance 1.4444. So, I do not how you, guys, are but I definitely will not want to buy in 1.4350-1.4440 area and will close any Long positions if I’ll have any. So, that’s the target.
Also, here we can see that market has hit the target that we’ve discussed on previous week at 1.4033.
#1
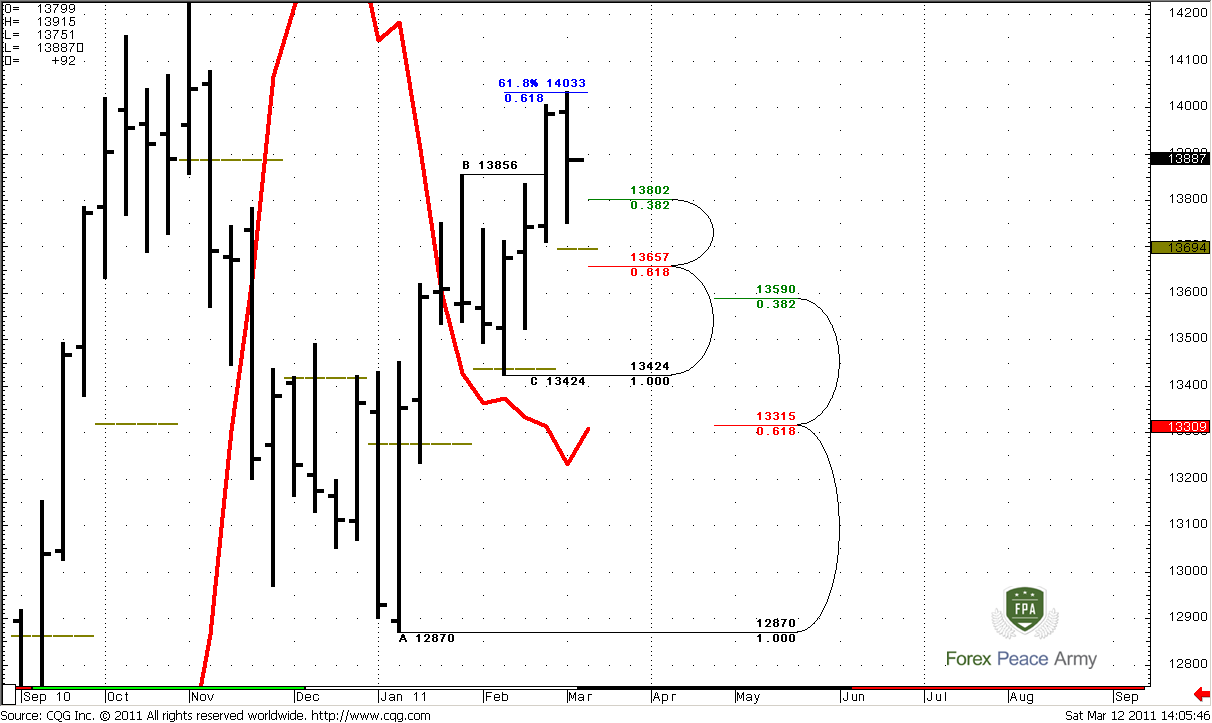
On the chart #2 let’s take a look, where we can enter. This will be very useful for position traders, who trade based on monthly and weekly time frames. First, we see that both trends are bullish - as monthly, as weekly. It means that we have only single long-term context – Buy. At the same time, we can see, that market has hit monthly pivot resistance 1 and 1.4033 – is 0.618 Fib expansion target. Previously we’ve said that market could bounce to the downside, so that has happened. The fact, that market neither oversold nor overbought as on weekly as on monthly tells us, that we should use for enter the nearest Fib support. This moment also is confirmed by shallow B-C retracement. So, this support is 1.3802 and market stands here currently. Just below this area – Weekly Confluence support 1.3590-1.3657 – it could be used for placing stop just below it.
#2
Daily
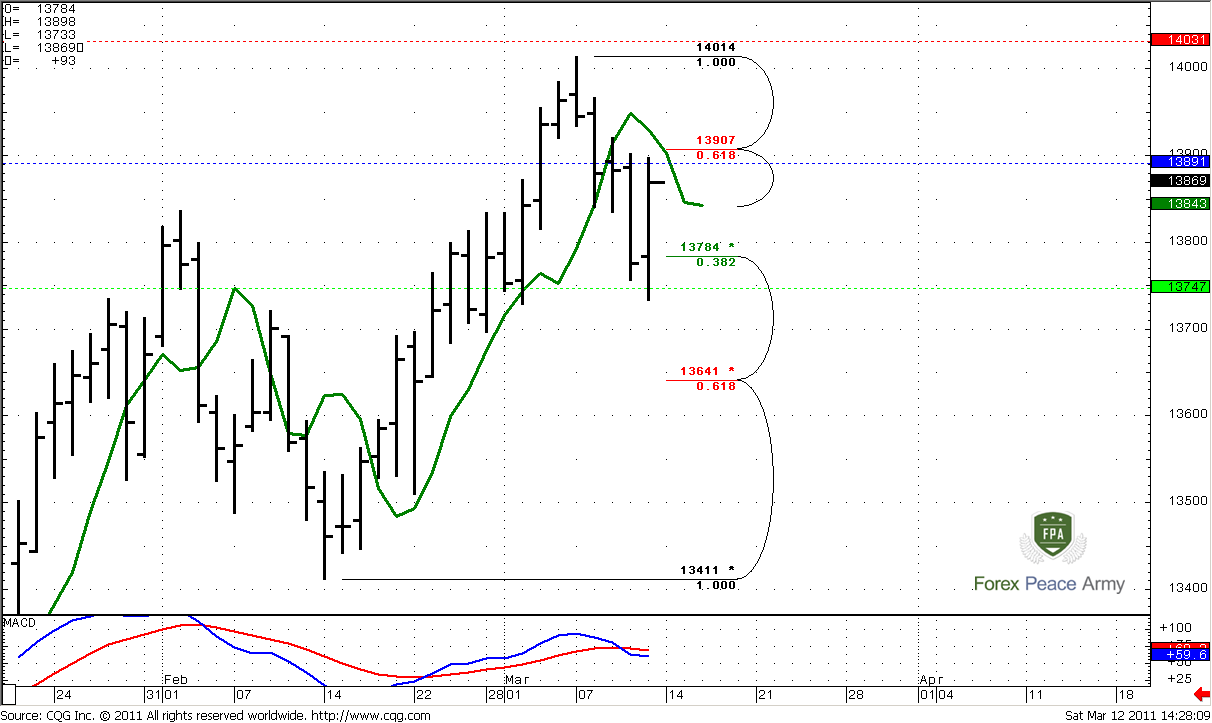
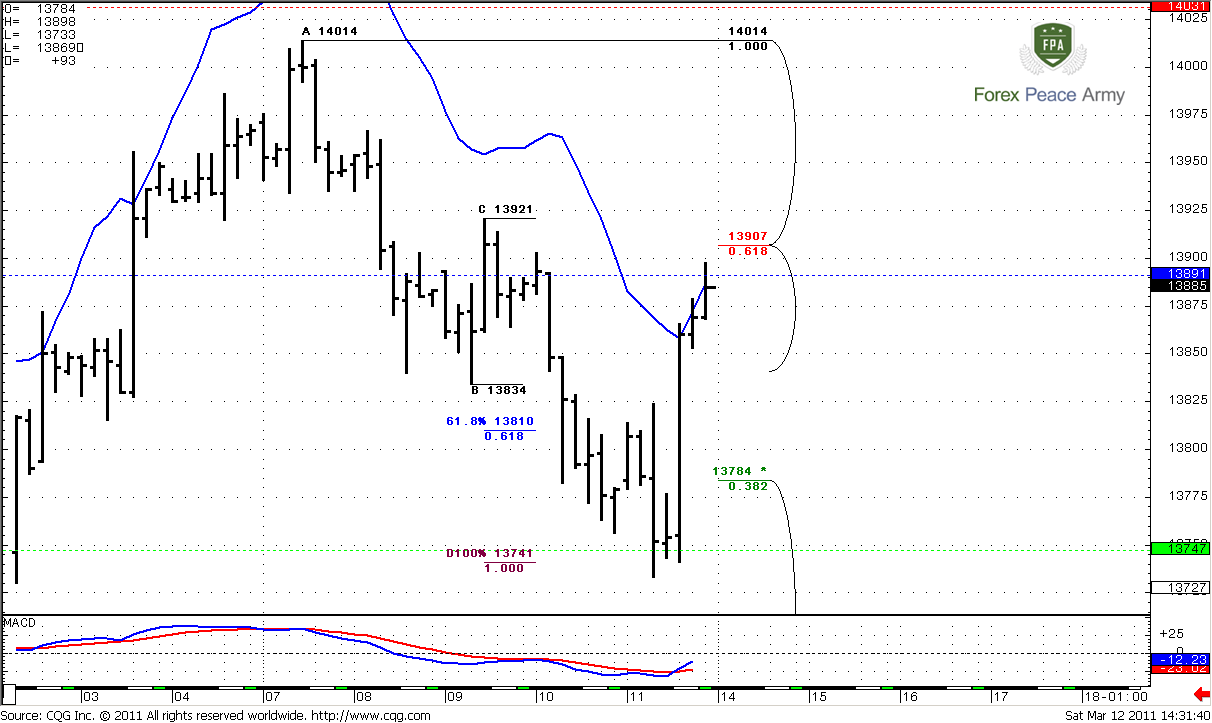
Daily trend has turned bearish, market neither overbought nor oversold. The colored lines are pivot levels, as usual – blue stands for pivot point = 1.3891, lime for pivot support 1=1.3747, and red one for resistance 1=1.4031.
During the week market has hit our 1.4033 target from Gartley ‘222’ pattern that we’ve talked about on previous week and turned to retracement. Our trading plan for the week was to wait for directional trade – Bread & Butter or DPRO. Finally, on Friday, B&B has started from our second possible level – 1.3784, that is 0.382 Fib support from the whole move up. In fact, this is shallow retracement in terms of swing up. The target of this trade is 1.3907 that was not hit yet by the market for some pips. So, what kind of conclusion could be made for daily time frame?
For positional traders (who trade at daily and higher time frames)
1. If you have no positions currently and didn’t enter in B&B trade according our Friday’s trading plan you may stay flat or drop to intraday time frame and try to enter long from retracement;
2. If you’ve entered long and still hold this position – you may tight your stops and try to hold in some time further, because, as we’ve estimated already – monthly and weekly trends are bullish. So, current move down is just a retracement in longer time frame periods.
Intraday
Let’s start from 4-hour chart. Looks like our breakeven point for possible B&B start has worked perfectly. We’ve said on Friday, that B&B could start, when market has accomplished AB-CD pattern to 1.3740 area. So, that has happened. We see strong bull bar to the upside, so, that market has almost reached the target of B&B at 1.3907. 4-hour trend is bullish. Also you can see that market stands at 4-hour overbought (blue line) and very close to weekly pivot. Possibly, this is another Gartley ‘222’ pattern from the recent daily swing, because currently market has finished AB-CD retracement and confirmed daily Fib support with strong up movement. This situation allows positional traders enter Long in longer term bullish context with very tight stops.
Meantime, if you’re intraday trader – you have no context to buy, because daily trend is bearish and market stands and 4-hour overbought. So your context is bearish.
So, depending on your preferable trading time you will act differently – let’s take a look how it could be.
4-hour
Here is hourly chart. Trend is bullish. If you’re positional trader, and search for possibility to enter long, then here is my point how it could be done. First of all, current strong move up is a first thrust after move down. Hence, I expect deeper retracement first – somewhere to 1.3800 area, that is 5/8 support or even lower – 0.786, 0.886 Fib supports. Anyway, your stop should be placed below the low of current thrust up – around 1.3720.
There is quite another way of trading, if you’re intraday trader. Your context is bearish. Market is overbought at 4-hour chart near Fib resistance – this is “Stretch” DiNapoli Directional pattern. Wait, when market will hit 1.3910 area and look for bearish reversal patterns on 30-min, may be even on 15-min charts. Then wait when market will move below weekly pivot point, 15-min trend should confirm this reversal. Then you may enter on nearest Fib retracement up. Your initial target will be 1.38 area.
1-hour
Conclusion:
Position traders:
Buy 1.3740-1.3780, S/L below 1.3720, T/P 1.4350
Intraday traders:
There is a potential for DiNapoli “Stretch” Sell pattern.
1. Wait when market will hit 1.3910
2. Drop to 15-min chart – look for bearish reversal patterns
3. Wait beginning of move down, when market will move below weekly pivot – 1.3891
4. 15-min trend should turn bearish and confirm down move
5. Enter on shallow Fib retracement up on 15-min chart.
6. Initial target – 1.38 area.
The technical portion of Sive's analysis owes a great deal to Joe DiNapoli's methods, and uses a number of Joe's proprietary indicators. Please note that Sive's analysis is his own view of the market and is not endorsed by Joe DiNapoli or any related companies.
Well, I have nothing to add to monthly and weekly analysis from previous research. The price action during the recent week was shallow, so I leave previous analysis intact.
First of all, monthly trend is clearly bullish, price action is bullish also. One important moment here is that when market has shown retracement to “C” point=1.2870 – trend has not been broken, so it has held this 0.618 retracement to the downside.
I still show you the range of this nasty down bar with black dash lines. Currently is a fourth consecutive month of increasing up move, so market almost erase this down bar. But still, major events will happen when (and if) it will reach 1.4276.
Now take a look at monthly ABC pattern. The nearest target is 0.618 Fib expansion stands at 1.4354 – just above the highs at 1.4276. I suppose, you can imagine what will happen, when market will trigger stops that had been placed their – in most unwelcome place. Just above it – strong Fib resistance stands. This is major 5/8 resistance at 1.4416 from all time high. The coincidence of Target and Fib resistance creates Agreement. Also 1.4444 is 0.786 Fib resistance from the recent swing down. What all this stuff means for us?
First, 1.4350-1.44 is a nearest monthly target. Second, the probability suggests that stops above 1.4276 will be triggered, if market will continue move up. Third – market can show W&R due to strong resistance just above the previous highs, or, at least, bounce to the downside during first touch of this area.
Taking into account some fundamental thoughts about difficulties with supporting the same economy growth as for EU Core, as Periphery, I suppose, that W&R has more probability to happen, rather then further EUR up move.
Weekly
Weekly trend is also bullish. Let’s start from the targets first. Look at initial ABC pattern – 1.272 expansion target stands at 1.4443. Meantime the most recent AB-CD pattern has a 100% target at 1.4410 – also at Agreement with monthly Fib resistance. So, at 1.4350-1.4440 are stand – three different ABC targets (1.4354; 1.4443; 1.4410), monthly major 5/8 Fib resistance (1.4416) and 0.786 Fib resistance 1.4444. So, I do not how you, guys, are but I definitely will not want to buy in 1.4350-1.4440 area and will close any Long positions if I’ll have any. So, that’s the target.
Also, here we can see that market has hit the target that we’ve discussed on previous week at 1.4033.
#1
On the chart #2 let’s take a look, where we can enter. This will be very useful for position traders, who trade based on monthly and weekly time frames. First, we see that both trends are bullish - as monthly, as weekly. It means that we have only single long-term context – Buy. At the same time, we can see, that market has hit monthly pivot resistance 1 and 1.4033 – is 0.618 Fib expansion target. Previously we’ve said that market could bounce to the downside, so that has happened. The fact, that market neither oversold nor overbought as on weekly as on monthly tells us, that we should use for enter the nearest Fib support. This moment also is confirmed by shallow B-C retracement. So, this support is 1.3802 and market stands here currently. Just below this area – Weekly Confluence support 1.3590-1.3657 – it could be used for placing stop just below it.
#2
Daily
Daily trend has turned bearish, market neither overbought nor oversold. The colored lines are pivot levels, as usual – blue stands for pivot point = 1.3891, lime for pivot support 1=1.3747, and red one for resistance 1=1.4031.
During the week market has hit our 1.4033 target from Gartley ‘222’ pattern that we’ve talked about on previous week and turned to retracement. Our trading plan for the week was to wait for directional trade – Bread & Butter or DPRO. Finally, on Friday, B&B has started from our second possible level – 1.3784, that is 0.382 Fib support from the whole move up. In fact, this is shallow retracement in terms of swing up. The target of this trade is 1.3907 that was not hit yet by the market for some pips. So, what kind of conclusion could be made for daily time frame?
For positional traders (who trade at daily and higher time frames)
1. If you have no positions currently and didn’t enter in B&B trade according our Friday’s trading plan you may stay flat or drop to intraday time frame and try to enter long from retracement;
2. If you’ve entered long and still hold this position – you may tight your stops and try to hold in some time further, because, as we’ve estimated already – monthly and weekly trends are bullish. So, current move down is just a retracement in longer time frame periods.
Intraday
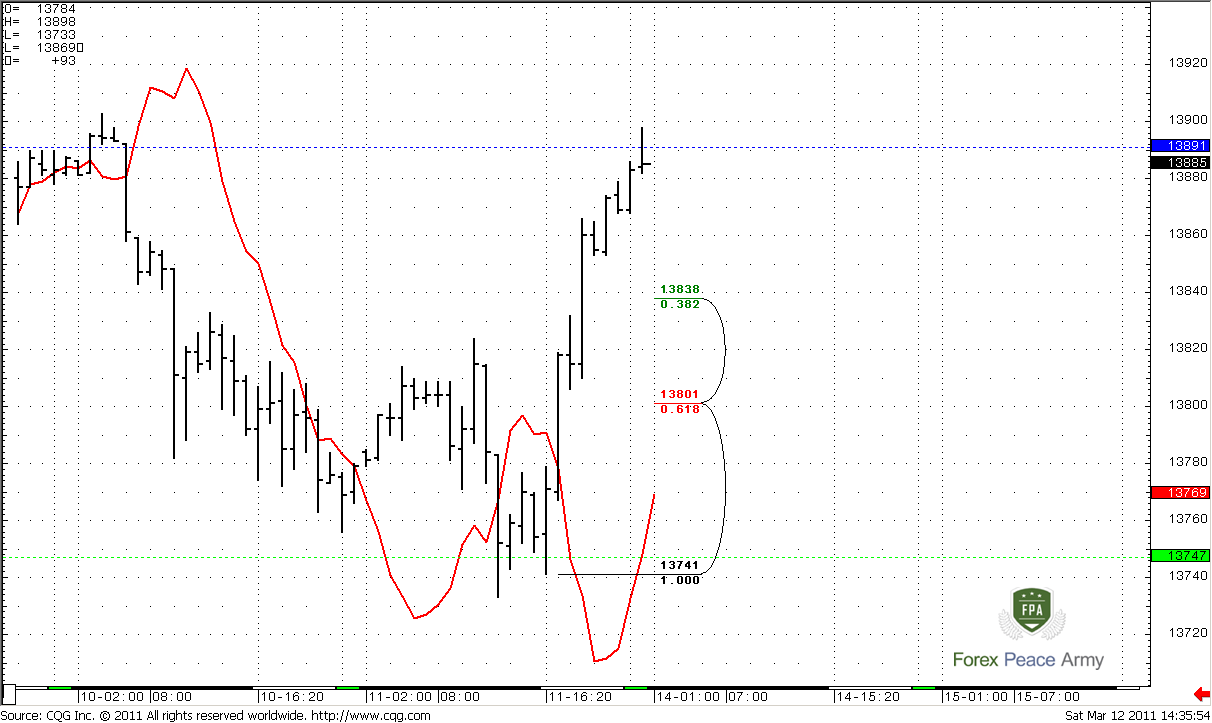
Let’s start from 4-hour chart. Looks like our breakeven point for possible B&B start has worked perfectly. We’ve said on Friday, that B&B could start, when market has accomplished AB-CD pattern to 1.3740 area. So, that has happened. We see strong bull bar to the upside, so, that market has almost reached the target of B&B at 1.3907. 4-hour trend is bullish. Also you can see that market stands at 4-hour overbought (blue line) and very close to weekly pivot. Possibly, this is another Gartley ‘222’ pattern from the recent daily swing, because currently market has finished AB-CD retracement and confirmed daily Fib support with strong up movement. This situation allows positional traders enter Long in longer term bullish context with very tight stops.
Meantime, if you’re intraday trader – you have no context to buy, because daily trend is bearish and market stands and 4-hour overbought. So your context is bearish.
So, depending on your preferable trading time you will act differently – let’s take a look how it could be.
4-hour
Here is hourly chart. Trend is bullish. If you’re positional trader, and search for possibility to enter long, then here is my point how it could be done. First of all, current strong move up is a first thrust after move down. Hence, I expect deeper retracement first – somewhere to 1.3800 area, that is 5/8 support or even lower – 0.786, 0.886 Fib supports. Anyway, your stop should be placed below the low of current thrust up – around 1.3720.
There is quite another way of trading, if you’re intraday trader. Your context is bearish. Market is overbought at 4-hour chart near Fib resistance – this is “Stretch” DiNapoli Directional pattern. Wait, when market will hit 1.3910 area and look for bearish reversal patterns on 30-min, may be even on 15-min charts. Then wait when market will move below weekly pivot point, 15-min trend should confirm this reversal. Then you may enter on nearest Fib retracement up. Your initial target will be 1.38 area.
1-hour
Conclusion:
Position traders:
Buy 1.3740-1.3780, S/L below 1.3720, T/P 1.4350
Intraday traders:
There is a potential for DiNapoli “Stretch” Sell pattern.
1. Wait when market will hit 1.3910
2. Drop to 15-min chart – look for bearish reversal patterns
3. Wait beginning of move down, when market will move below weekly pivot – 1.3891
4. 15-min trend should turn bearish and confirm down move
5. Enter on shallow Fib retracement up on 15-min chart.
6. Initial target – 1.38 area.
The technical portion of Sive's analysis owes a great deal to Joe DiNapoli's methods, and uses a number of Joe's proprietary indicators. Please note that Sive's analysis is his own view of the market and is not endorsed by Joe DiNapoli or any related companies.
Last edited: