Sive Morten
Special Consultant to the FPA
- Messages
- 18,648
Monthly
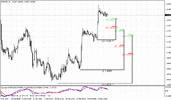
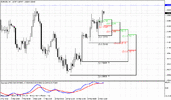
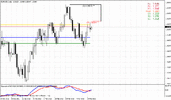
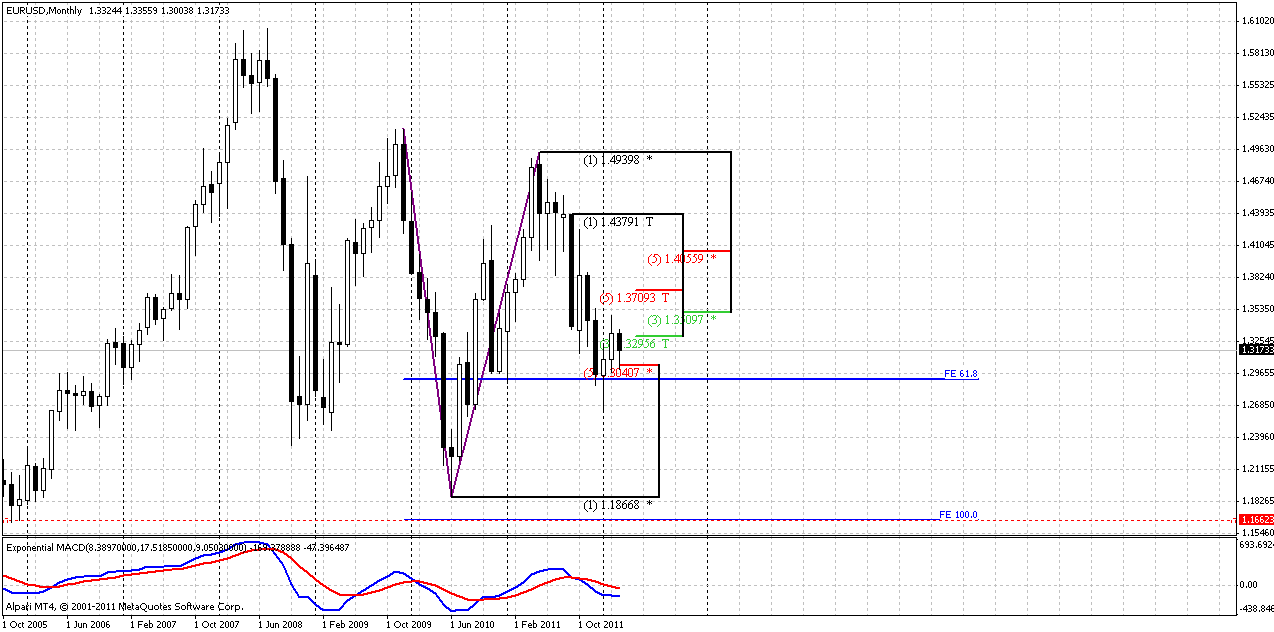
Price action during previous week was in the same range of monthly bar – we just see some pullback from month’s low. The major interest here, as previously, stands with price behavior around Agreement support from one side and K-resistance area from the other. After hitting of 0.618 Fib extension target and Agreement market has shown retracement to 1.3509-1.3709 that is solid K-resistance at monthly chart and typically, price should not break it after just hitting of 0.618 target. Otherwise, it will be a strong sign that market sentiment has changed and bears’ power falls under question
Still, as we’ve mentioned previously there is a possibility of AB=CD retracement on lower time frames. In this case market could show a bit deeper move inside of K-resistance. Although this is not significant for monthly time frame, it could become very important for us, since we mostly trade at daily charts.
Currently there are no significant changes on monthly time frame. All that we’ve said previously still in place.
Weekly
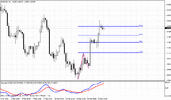
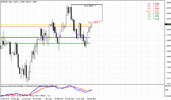
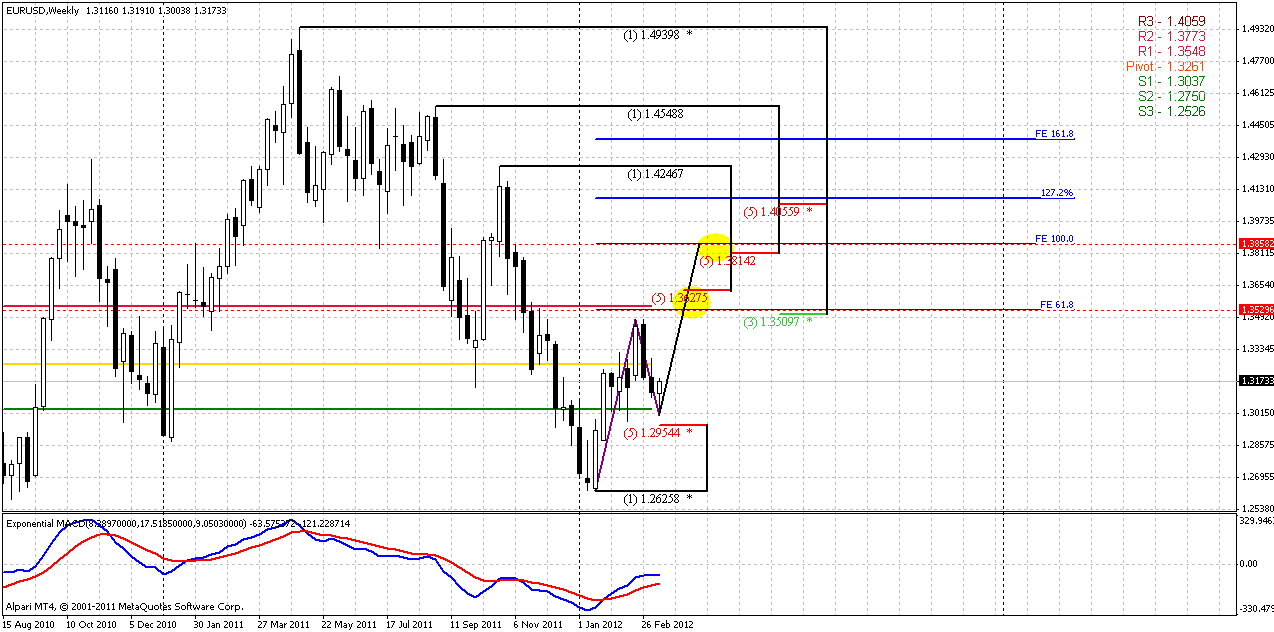
Weekly trend holds bullish. Our major question to weekly time frame is will AB-CD retracement happen or not. Although market has not quite reached our predefined target at 1.2950 area for 70 pips, still it has shown nice move down due bearish engulfing pattern and has allowed us to trade on short side almost whole week. But now this context is mostly exhausted and if market will proceed move lower – this will probably happen by some other reason.
In fact, we can see that market has reached only 50% support and not quite reached 0.618 level. Based on technical picture AB-CD retracement looks probable. If it will happen, then we have two potential targets. First one comes at retesting of K-resistance 1.3509-1.3627 level. This target is 0.618 extension at 1.3530 level and creates an Agreement with K-area. Also pay attention that this target stands higher than tops of bearish engulfing, so if market will start move up – this high will not hold. Don’t place stops just above it! By the way, here monthly pivot resistance 1 stands also – 1.3548.
Next and major target of this potential retracement also creates an Agreement with weekly Fib resistance level at 1.3814-1.3858.
As we’ve estimated potential targets – how we will possess ourselves on them? Unfortunately we can’t answer on this question just using of weekly time frame – we need lower ones. Here we just can say that since bearish engulfing context exhausted, trend still holds bullish and market has found some support precisely at levels from which most AB-CD patterns starts – we have bullish context for daily time frame.
Daily
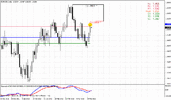
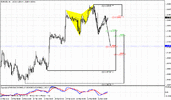
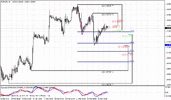
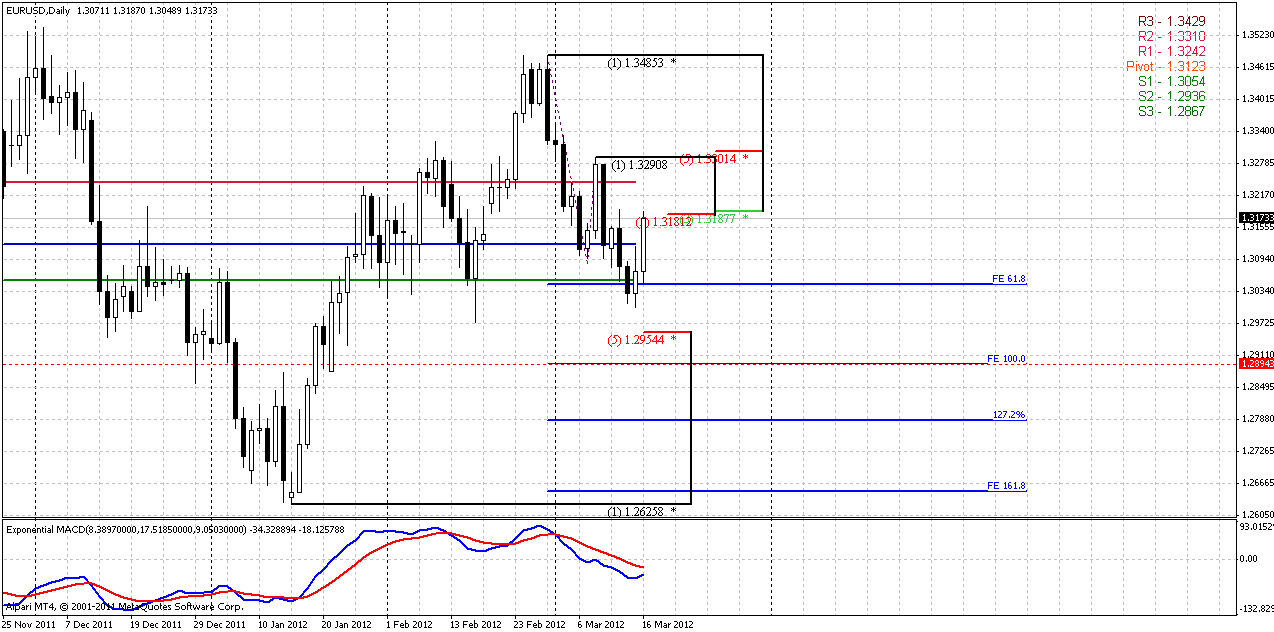
Trend holds bearish, market is not at oversold. Unfortunately, even daily chart does not totally clarify overall picture. Here is why… This is in fact, the same situation as on monthly chart, but in lower scale. We see stepped move down by the market and hitting significant support area, that includes 0.618 AB-CD extension target, monthly and weekly pivot supports and 50% Fib support. On Friday market has shown retracement. Although it looks solid on hourly and 4-hour time frames, but on daily chart this is just 0.382 retracement from downward swing that is also K-resistance area 1.3181-1.3187. Is it normal 0.382 retracement after hitting 0f 0.618 target? Absolutely. Does this retracement eliminate continuation to AB=CD target at 1.29? Definitely not. So, what we have to do then?
Answer is the same as on monthly chart. Initially we have to keep an eye on price action around K-area. While reaching of 0.382 retracement is typical after hitting of just 0.618 target, breaking K-area is untypical. That will be the first clue. If market will break this area and continue move up – this will be the first sign of possible AB-CD retracement on weekly. If market will show solid thrust down from here, as it was a bit earlier then reaching of 1.29 is still possible.
Secondly, if market will break K-area to upside, it will be safer to wait trend shifting on bullish side. This will be just safer. When and if it will happen, our context will be completed and we can calmly search the possibility for enter long.
So, our week will probably start just with monitoring of price action around 1.3190 level.
4-hour
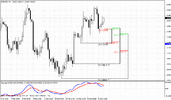
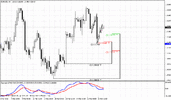
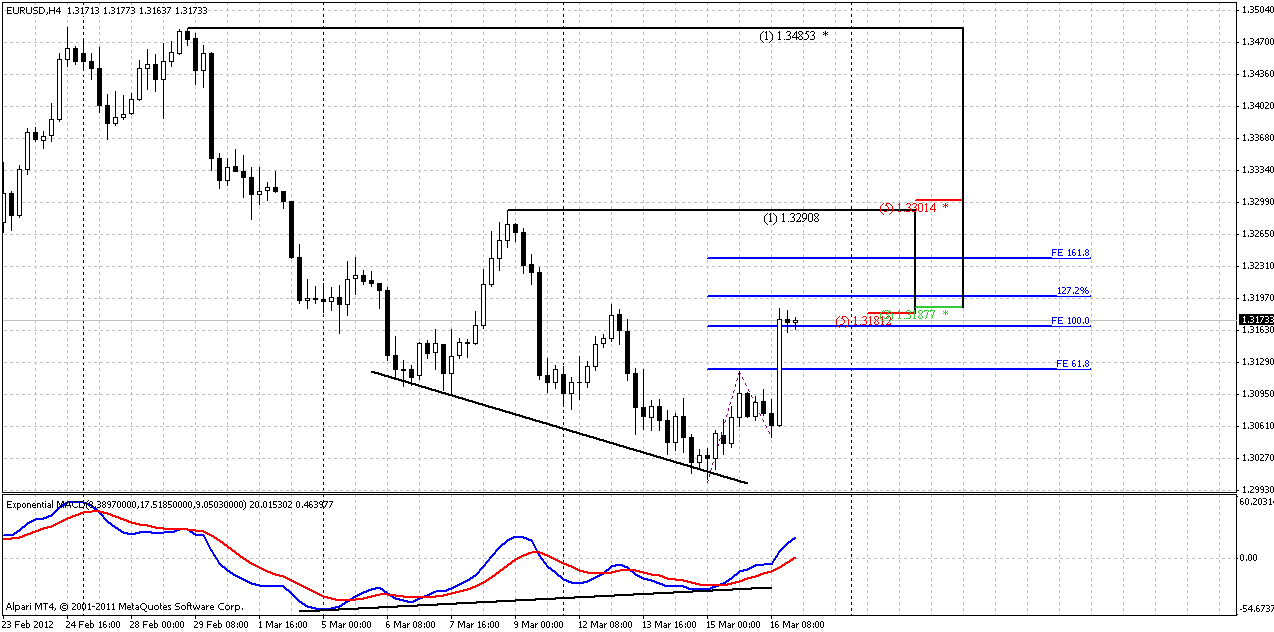
May be you will find something else interesting here, because current situation on intraday charts shows a lot of different patterns and opportunities for trading. On 4-hour chart we see situation that we’ve discussed on Friday – possible breakout of 1.3119 level. Here we can say even more – there was nice thrusting move up and acceleration right to 1.0 extension target of AB=CD. Theoretically market should show some pullback (usually to 0.618 support) and then continue move to 1.618 extension at 1.3240 level.
1-hour
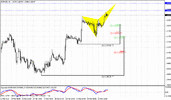
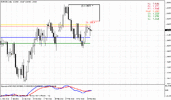
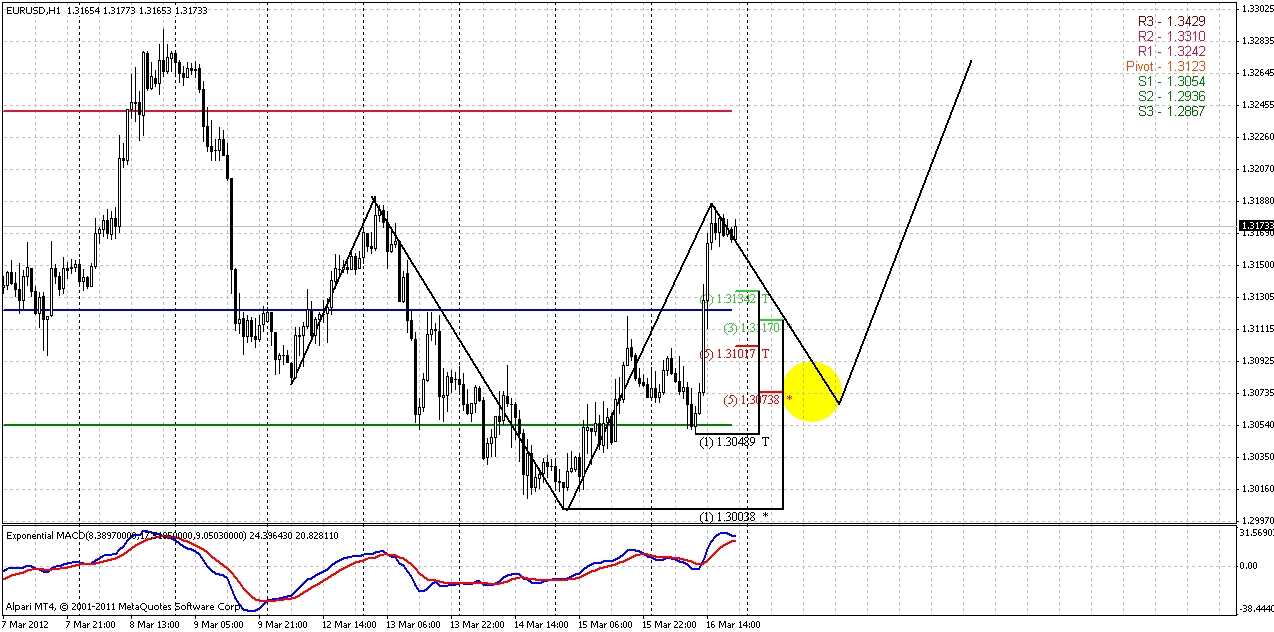
Due to solid upward move on Friday – on hourly chart we see nice possibility for reverse H&S pattern (that is what probably our forum member, Venelin, talking about). The point is that Head stands right at 1.618 extension of left shoulder, and 1.618 ratio is very typical for H&S patterns. Second – harmony of the head is nice. Third moment, potential retracement to 0.618 support is in a row with 4-hour AB=CD pattern. That is what I particularly will be watch in the beginning of the week. The one moment still that has to be noted here is that H&S patterns fails oftener than works on intraday charts. How to trade it? Here is a lot of ways. If you’re scalper, you may trade this reversal pattern. If you’re day trader – watch, will market fail to proceed lower to enter short, or if daily trend will shift bullish – enter long with weekly AB=CD.
Conclusion:
Long-term bias holds bearish, but weekly time frame does not exclude some upward continuation in the way of AB=CD retracement. So, for positional traders will be safer to enter short, when and if weekly trend will turn bearish. Long-term target still stands at 1.16-1.1650 area
On short-term perspective we still need some more clarification from the market. Breakout of daily K-area could become one of them. Although market now is forming clear reversal pattern on intraday charts, these patterns very often fail. So, the major level to watch in the beginning of the week is 1.3070. If market will fail to complete H&S pattern on hourly chart, then reaching of daily AB=CD target at 1.29 becomes real.
If market will complete it and turn daily trend to bullish above K-resistance level on daily, then it could become the first sign of starting AB=CD move on weekly chart.
The technical portion of Sive's analysis owes a great deal to Joe DiNapoli's methods, and uses a number of Joe's proprietary indicators. Please note that Sive's analysis is his own view of the market and is not endorsed by Joe DiNapoli or any related companies.
Price action during previous week was in the same range of monthly bar – we just see some pullback from month’s low. The major interest here, as previously, stands with price behavior around Agreement support from one side and K-resistance area from the other. After hitting of 0.618 Fib extension target and Agreement market has shown retracement to 1.3509-1.3709 that is solid K-resistance at monthly chart and typically, price should not break it after just hitting of 0.618 target. Otherwise, it will be a strong sign that market sentiment has changed and bears’ power falls under question
Still, as we’ve mentioned previously there is a possibility of AB=CD retracement on lower time frames. In this case market could show a bit deeper move inside of K-resistance. Although this is not significant for monthly time frame, it could become very important for us, since we mostly trade at daily charts.
Currently there are no significant changes on monthly time frame. All that we’ve said previously still in place.

Weekly
Weekly trend holds bullish. Our major question to weekly time frame is will AB-CD retracement happen or not. Although market has not quite reached our predefined target at 1.2950 area for 70 pips, still it has shown nice move down due bearish engulfing pattern and has allowed us to trade on short side almost whole week. But now this context is mostly exhausted and if market will proceed move lower – this will probably happen by some other reason.
In fact, we can see that market has reached only 50% support and not quite reached 0.618 level. Based on technical picture AB-CD retracement looks probable. If it will happen, then we have two potential targets. First one comes at retesting of K-resistance 1.3509-1.3627 level. This target is 0.618 extension at 1.3530 level and creates an Agreement with K-area. Also pay attention that this target stands higher than tops of bearish engulfing, so if market will start move up – this high will not hold. Don’t place stops just above it! By the way, here monthly pivot resistance 1 stands also – 1.3548.
Next and major target of this potential retracement also creates an Agreement with weekly Fib resistance level at 1.3814-1.3858.
As we’ve estimated potential targets – how we will possess ourselves on them? Unfortunately we can’t answer on this question just using of weekly time frame – we need lower ones. Here we just can say that since bearish engulfing context exhausted, trend still holds bullish and market has found some support precisely at levels from which most AB-CD patterns starts – we have bullish context for daily time frame.

Daily
Trend holds bearish, market is not at oversold. Unfortunately, even daily chart does not totally clarify overall picture. Here is why… This is in fact, the same situation as on monthly chart, but in lower scale. We see stepped move down by the market and hitting significant support area, that includes 0.618 AB-CD extension target, monthly and weekly pivot supports and 50% Fib support. On Friday market has shown retracement. Although it looks solid on hourly and 4-hour time frames, but on daily chart this is just 0.382 retracement from downward swing that is also K-resistance area 1.3181-1.3187. Is it normal 0.382 retracement after hitting 0f 0.618 target? Absolutely. Does this retracement eliminate continuation to AB=CD target at 1.29? Definitely not. So, what we have to do then?
Answer is the same as on monthly chart. Initially we have to keep an eye on price action around K-area. While reaching of 0.382 retracement is typical after hitting of just 0.618 target, breaking K-area is untypical. That will be the first clue. If market will break this area and continue move up – this will be the first sign of possible AB-CD retracement on weekly. If market will show solid thrust down from here, as it was a bit earlier then reaching of 1.29 is still possible.
Secondly, if market will break K-area to upside, it will be safer to wait trend shifting on bullish side. This will be just safer. When and if it will happen, our context will be completed and we can calmly search the possibility for enter long.
So, our week will probably start just with monitoring of price action around 1.3190 level.

4-hour
May be you will find something else interesting here, because current situation on intraday charts shows a lot of different patterns and opportunities for trading. On 4-hour chart we see situation that we’ve discussed on Friday – possible breakout of 1.3119 level. Here we can say even more – there was nice thrusting move up and acceleration right to 1.0 extension target of AB=CD. Theoretically market should show some pullback (usually to 0.618 support) and then continue move to 1.618 extension at 1.3240 level.

1-hour
Due to solid upward move on Friday – on hourly chart we see nice possibility for reverse H&S pattern (that is what probably our forum member, Venelin, talking about). The point is that Head stands right at 1.618 extension of left shoulder, and 1.618 ratio is very typical for H&S patterns. Second – harmony of the head is nice. Third moment, potential retracement to 0.618 support is in a row with 4-hour AB=CD pattern. That is what I particularly will be watch in the beginning of the week. The one moment still that has to be noted here is that H&S patterns fails oftener than works on intraday charts. How to trade it? Here is a lot of ways. If you’re scalper, you may trade this reversal pattern. If you’re day trader – watch, will market fail to proceed lower to enter short, or if daily trend will shift bullish – enter long with weekly AB=CD.

Conclusion:
Long-term bias holds bearish, but weekly time frame does not exclude some upward continuation in the way of AB=CD retracement. So, for positional traders will be safer to enter short, when and if weekly trend will turn bearish. Long-term target still stands at 1.16-1.1650 area
On short-term perspective we still need some more clarification from the market. Breakout of daily K-area could become one of them. Although market now is forming clear reversal pattern on intraday charts, these patterns very often fail. So, the major level to watch in the beginning of the week is 1.3070. If market will fail to complete H&S pattern on hourly chart, then reaching of daily AB=CD target at 1.29 becomes real.
If market will complete it and turn daily trend to bullish above K-resistance level on daily, then it could become the first sign of starting AB=CD move on weekly chart.
The technical portion of Sive's analysis owes a great deal to Joe DiNapoli's methods, and uses a number of Joe's proprietary indicators. Please note that Sive's analysis is his own view of the market and is not endorsed by Joe DiNapoli or any related companies.
