Hi Sive,
Sure, Sir. I also noticed about that but on my chart it show thrust are 8 bars closed above 3x3 with the last candle was very near above 3x3. Maybe DRPO LAL at least?
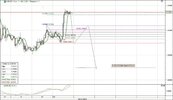
Another opinion ( if I'm not wrong) is H&S on daily but market should reach 1.33 area first to complete right shoulder. If market will exceed 1.4, then perhaps we can say goodbye to this H&S. Currently, from harmonic point of view on possible right shoulder, I'm not sure but maybe acceptable. Also if we look at the top, it is not quite harmonic because we have double top. The target is around 1.26 area. It's a little bit different from your analysis cause it will put aside for a while our bullish AB-CD on weekly.
So the idea is, in early next week, market will go south (around 1.307/8) to form reverse H&S's right shoulder then proceed with its target around 1.33 and at the same time right shoulder on daily H&S is manifested.
I know it is hard to answer based on current situation but any possibility, Sir (on daily H&S)?
Thanks and Best Regards.
Hm. If it will happen as you've described - market will reach 1.33, and if it will be rather gradually, then, probably this H&S on daily will get sufficient harmony. BTW, upward AB=CD attempt will not definitely mean that we will get pure AB=CD. Market could, for instance just retest 1.35 area and reach just 0.618. We do not know the power of this move yet. Anyway your scenario looks possible.
Hi Sive
I have a question about interpretation of open contracts on euro usd. I saw fridays The Commitments of Traders (COT) raport, that says that "strong hands" - Commercials have a lot more long positions (212,175) than short (83,411). Is it possible that market has change the sentiment and we should look for the long position (due to weekly analisys), than short to level of abcd daily pattern? I'am a bit confused about it. Is this strong friday's move up could be the answer to that question?
Sebastian
sive,
same question here re. the COT.
Hi guys,
here is last COT report on EUR, let's try to find out. (I rare use it in our researches, since it is more applicable to weekly/monthly context).
What do we have here:
Non-Commercial % of shorts (will take only futures, if you don't mind):
139661/(139661+40325)=77.59%. Not significant level of oversold, if we can call it like that. On Forex market extreme values for COT report stand above 80%, as a rule, when such an oscillator reaches 82-85% reversal becomes very probable.
With COT relative indicator is important but not number per se. Check example with GBP i our FPA Military School.
As I understand from the article, COT shows not just report but some retrospective analysis why Dollar has risen and about some perspectives of it - that it should continue its aprreciation. That's also in a row with our long-term analysis.
Speaking about drastical change in sentiment on weekly chart, I don't know. In fact we have bullish trend there for about a month or so - sentiment is already bullish there.
May be we should not over reacting on situation and proceed with our trading plan. In fact it includes this possibility of higher move, we just need to get technical confirmation of that.
") . I will now know what levels to wathch during the week. I am still confused when I see the different trend on the different time frames but your weekly and daily analysis helps me a lot to learn. I really appreciate your great work. Thank you very much.
. I will now know what levels to wathch during the week. I am still confused when I see the different trend on the different time frames but your weekly and daily analysis helps me a lot to learn. I really appreciate your great work. Thank you very much.