Sive Morten
Special Consultant to the FPA
- Messages
- 18,669
Monthly
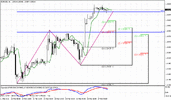
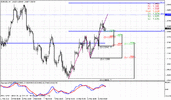
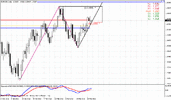
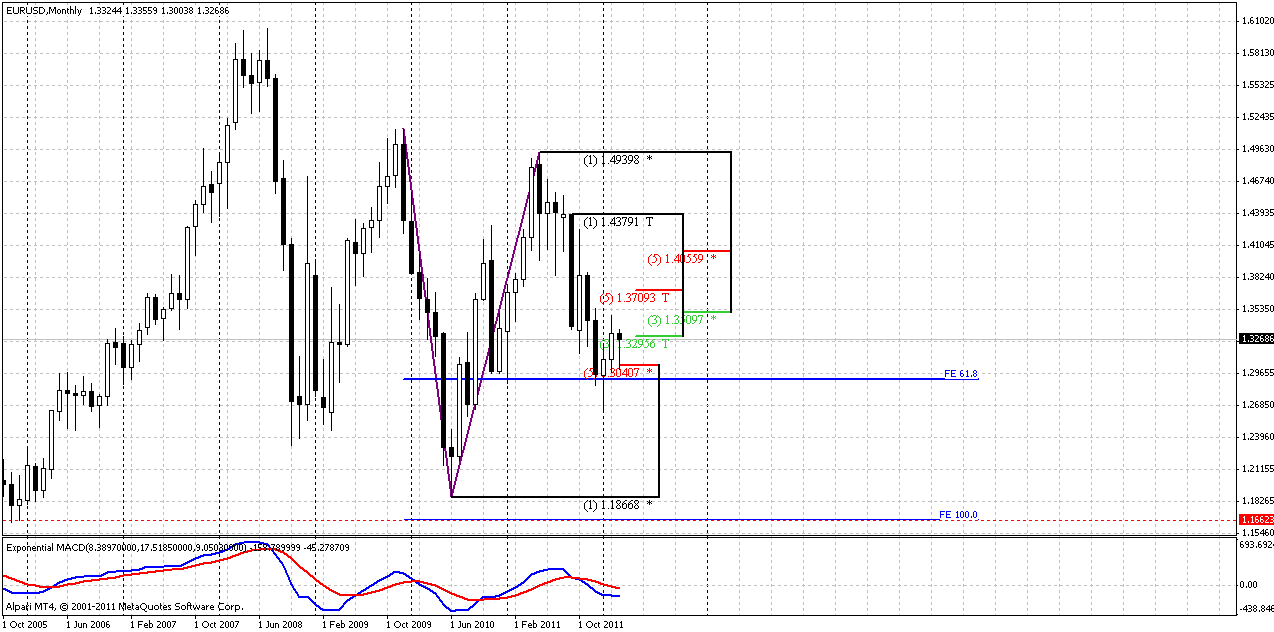
Well, it’s few that could be added on the monthly chart to previous analysis. Market continues retracement after hitting 0.618 Fib extension at 0.618 Fib support. So, I mostly hold previous analysis intact.
Price action during previous week was in the same range of monthly bar – we just see some pullback from month’s low. The major interest here, as previously, stands with price behavior around Agreement support from one side and K-resistance area from the other. After hitting of 0.618 Fib extension target and Agreement market has shown retracement to 1.3509-1.3709 that is solid K-resistance at monthly chart and typically, price should not break it after just hitting of 0.618 target. Otherwise, it will be a strong sign that market sentiment has changed and bears’ power falls under question
Still, as we’ve mentioned previously there is a possibility of AB=CD retracement on lower time frames. In this case market could show a bit deeper move inside of K-resistance. Although this is not significant for monthly time frame, it could become very important for us, since we mostly trade at daily charts.
Currently there are no significant changes on monthly time frame. All that we’ve said previously still in place.
Weekly
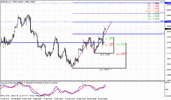
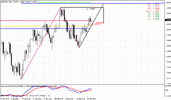
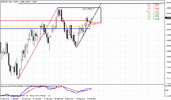
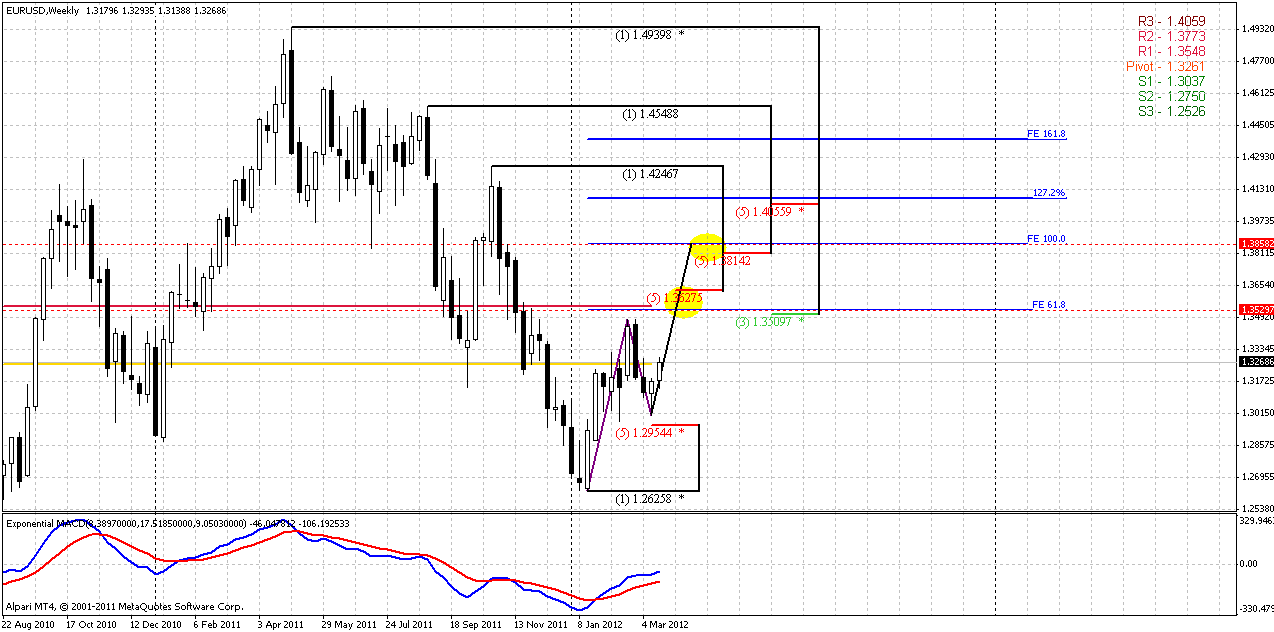
I intentionally leave the same chart with the same markings as on previous week. Weekly trend holds bullish. Recall that major question on previous week was - will AB-CD retracement happen or not?
Current price action tells us that this indeed could happen, and probably this CD move has started already. Still I would like to get some more confirmation from daily time frame. Weekly period is rather extended, so this move up could last 2-3 weeks and if we even will miss some entry at hot point, we will be more than just happy if we will enter a bit later but this entry point will be safer.
So, if we will get confirmation on daily time frame, then we have two potential targets. First one comes at retesting of K-resistance 1.3509-1.3627 level. This target is 0.618 extension at 1.3530 level and creates an Agreement with K-area. Also pay attention that this target stands higher than tops of bearish engulfing, so if market will start move up – this high will not hold. Don’t place stops just above it! By the way, here monthly pivot resistance 1 stands also – 1.3548.
Next and major target of this potential retracement also creates an Agreement with weekly Fib resistance level at 1.3814-1.3858.
Finally we can say, that this overall picture creates a bullish context for daily time frame, price action with this AB=CD is quite logical – initial AB swing then AB=CD retracement to 50% support that gives us “222” Buy pattern. Currently all looks more or less clear.
Daily
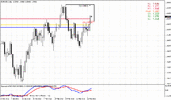
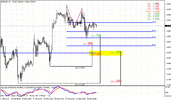
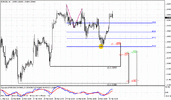
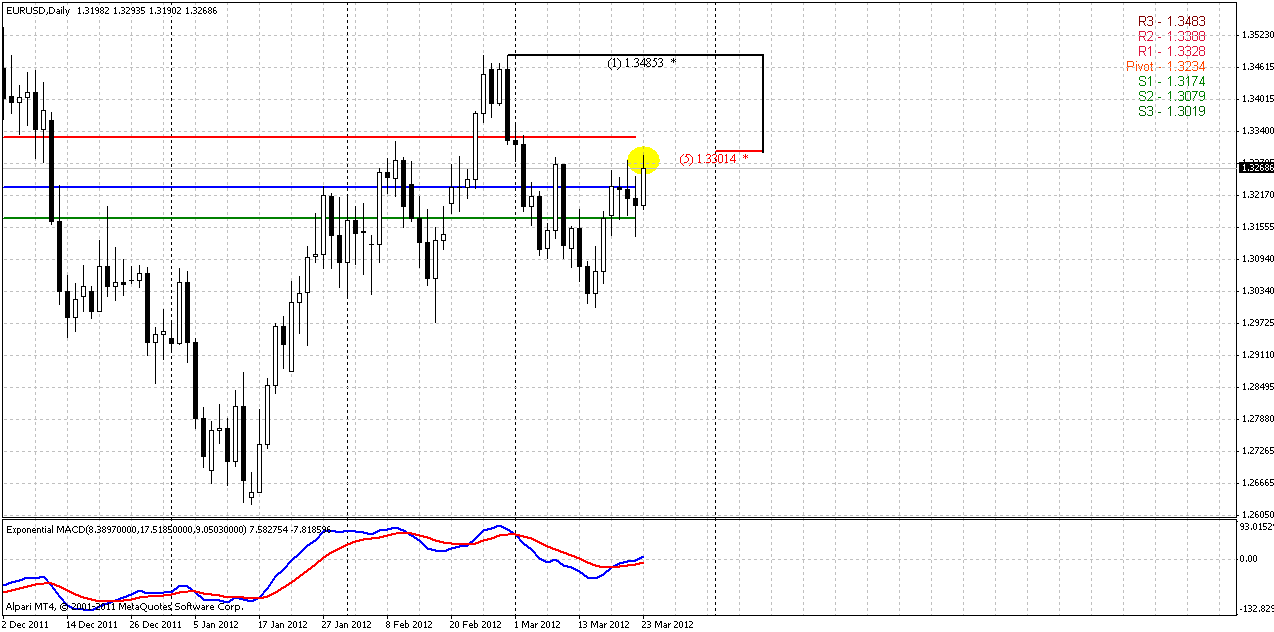
Although monthly and weekly analysis holds almost the same, now we’re passing to most interesting stuff. In the beginning I would like to share with some educational moments that could be extremely useful. In fact, here you see nothing but perfect example of DiNapoli “Minesweeper” entry technique. This also explains why I suppose that upward move has a lot chances to continue. So, how does minesweeper work? This technique applies in trend trading. First, we need initial thrusting move – this is AB leg of our potential AB-CD pattern on weekly chart. Then, we need price to reach some significant level of support, but weekly trend should hold bullish, or we might say “cover” this retracement. This is BC leg on weekly or downward AB=CD retracement on daily right to 50% support of AB move around 1.30. After that we have to wait and see – will market confirm this level and reestablish upward move. That has happened, but this is not sufficient to enter long. Second necessary moment is daily trend shifting bullish – in a row with weekly (higher) time frame. When market has shown all this price action – we need first retracement from starting move of CD leg (from 1.30 to 1.33) to enter long. That’s why on Thursday we’ve recommended to enter long at 1.3140. And now it looks like all this stuff has worked perfect. The one reason, why yesterday we’ve expressed some worries about upward reversal around 1.3140 - is strong black candle on intraday chart. In most cases market proceeds lower, but this happens not always, this is a probability game. Still, even this moment that I’ve become wrong with assumption of downward continuation on 4-hour chart and market acted in quite opposite way gives me another thought. Particularly, if market on 4-hour chart totally disrespect this huge black candle and drastically reversed to upside, although in most cases it proceeds lower – is it a sign of bullish strength? Does this moment give us additional confidence with upward continuation? I think this might be so.
At the same time, just to be absolutely sure, I would like to get one more action – breakout through 1.33 Fib resistance on daily and erasing of H&S pattern on daily. That will just destroy all barriers on the way of bulls. So, if you’ve entered long on Thursday and hold your position – that’s perfect. If you have not entered yet, then probably it is not needed to rush and enter after this final moment.
Colored lines on the chart as usual are weekly pivot levels for coming week.
4-hour
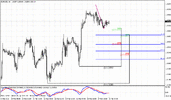
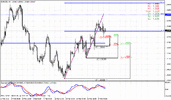
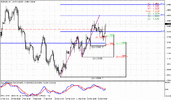
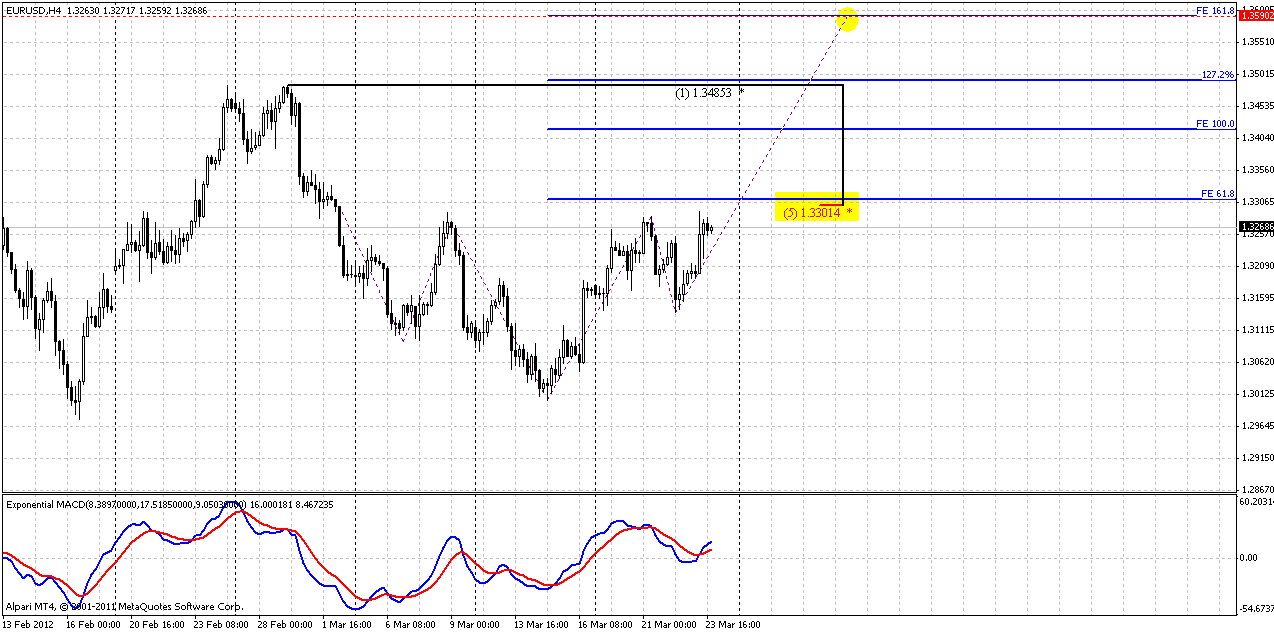
Trend holds bullish here as well. In fact we have strong bullish context. There is couple of interesting moments here. First of all, recent price action reminds reverse H&S pattern – I’ve just take a look at previous report and we have really discussed this, but on hourly chart... The more interesting though, is its target at 1.3590 stands almost at the same level as weekly 0.618 target of AB-CD pattern.
Second moment is Agreement at 1.33-1.3315. This is the last stand for bears and daily H&S pattern. Although I strongly do not recommend short current market, but if you have bearish view this is nice point for that purpose. If even you will be wrong, you will be able to place tight stop here.
1-hour
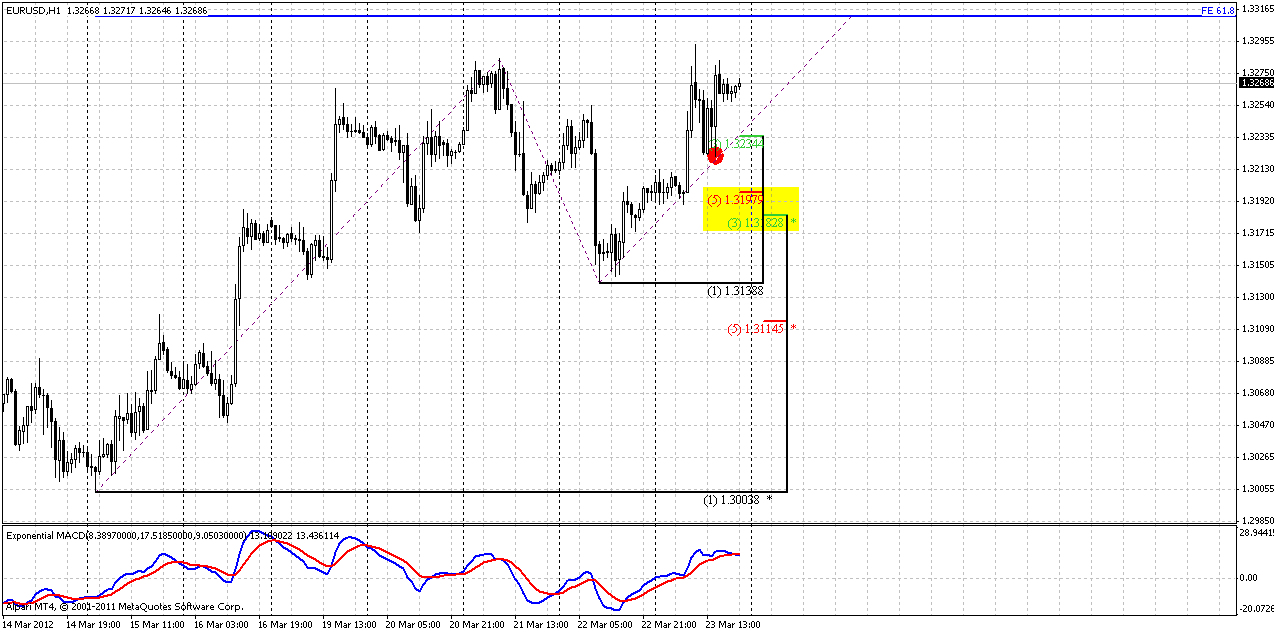
Here is also two moments that worthy to be mentioned. I’ve marked Stop Grabber pattern with red circle on hourly chart. It gives us some assurance that market will reached 1.33-1.3310 Agreement. Then, probably some retracement could follow. It has to be used differently, depending on what you will do around 1.33-1.3310 level. If you’re bearish, and will enter short there (although as I’ve said, I do not recommend it, since overall context is bullish), you may use this retracement to move your stop to breakeven.
If you will search possibility to enter long, then, probably nearest 3/8 support at 1.3234 and K-support 1.3182-1.3197 are levels to focus on. This will be just 0.618 target, so theoretically retracement should not break K-support level.
Conclusion:
Long-term traders should sit on hands and wait when weekly AB=CD retracement will be over to enter short.
Although overall analysis may look a bit complicated, in fact, there are only two moments to keep in mind now. First – overall weekly/daily context is bullish and we should search possibilities to enter long. Second – just for more safety it makes sense to wait breakout of 1.33-1.3310 level. But how to enter long or enter long at all – this choice is up to you, since risk aversion is different among us. In daily updates we will try to find appropriate moment.
The technical portion of Sive's analysis owes a great deal to Joe DiNapoli's methods, and uses a number of Joe's proprietary indicators. Please note that Sive's analysis is his own view of the market and is not endorsed by Joe DiNapoli or any related companies.
Well, it’s few that could be added on the monthly chart to previous analysis. Market continues retracement after hitting 0.618 Fib extension at 0.618 Fib support. So, I mostly hold previous analysis intact.
Price action during previous week was in the same range of monthly bar – we just see some pullback from month’s low. The major interest here, as previously, stands with price behavior around Agreement support from one side and K-resistance area from the other. After hitting of 0.618 Fib extension target and Agreement market has shown retracement to 1.3509-1.3709 that is solid K-resistance at monthly chart and typically, price should not break it after just hitting of 0.618 target. Otherwise, it will be a strong sign that market sentiment has changed and bears’ power falls under question
Still, as we’ve mentioned previously there is a possibility of AB=CD retracement on lower time frames. In this case market could show a bit deeper move inside of K-resistance. Although this is not significant for monthly time frame, it could become very important for us, since we mostly trade at daily charts.
Currently there are no significant changes on monthly time frame. All that we’ve said previously still in place.

Weekly
I intentionally leave the same chart with the same markings as on previous week. Weekly trend holds bullish. Recall that major question on previous week was - will AB-CD retracement happen or not?
Current price action tells us that this indeed could happen, and probably this CD move has started already. Still I would like to get some more confirmation from daily time frame. Weekly period is rather extended, so this move up could last 2-3 weeks and if we even will miss some entry at hot point, we will be more than just happy if we will enter a bit later but this entry point will be safer.
So, if we will get confirmation on daily time frame, then we have two potential targets. First one comes at retesting of K-resistance 1.3509-1.3627 level. This target is 0.618 extension at 1.3530 level and creates an Agreement with K-area. Also pay attention that this target stands higher than tops of bearish engulfing, so if market will start move up – this high will not hold. Don’t place stops just above it! By the way, here monthly pivot resistance 1 stands also – 1.3548.
Next and major target of this potential retracement also creates an Agreement with weekly Fib resistance level at 1.3814-1.3858.
Finally we can say, that this overall picture creates a bullish context for daily time frame, price action with this AB=CD is quite logical – initial AB swing then AB=CD retracement to 50% support that gives us “222” Buy pattern. Currently all looks more or less clear.

Daily
Although monthly and weekly analysis holds almost the same, now we’re passing to most interesting stuff. In the beginning I would like to share with some educational moments that could be extremely useful. In fact, here you see nothing but perfect example of DiNapoli “Minesweeper” entry technique. This also explains why I suppose that upward move has a lot chances to continue. So, how does minesweeper work? This technique applies in trend trading. First, we need initial thrusting move – this is AB leg of our potential AB-CD pattern on weekly chart. Then, we need price to reach some significant level of support, but weekly trend should hold bullish, or we might say “cover” this retracement. This is BC leg on weekly or downward AB=CD retracement on daily right to 50% support of AB move around 1.30. After that we have to wait and see – will market confirm this level and reestablish upward move. That has happened, but this is not sufficient to enter long. Second necessary moment is daily trend shifting bullish – in a row with weekly (higher) time frame. When market has shown all this price action – we need first retracement from starting move of CD leg (from 1.30 to 1.33) to enter long. That’s why on Thursday we’ve recommended to enter long at 1.3140. And now it looks like all this stuff has worked perfect. The one reason, why yesterday we’ve expressed some worries about upward reversal around 1.3140 - is strong black candle on intraday chart. In most cases market proceeds lower, but this happens not always, this is a probability game. Still, even this moment that I’ve become wrong with assumption of downward continuation on 4-hour chart and market acted in quite opposite way gives me another thought. Particularly, if market on 4-hour chart totally disrespect this huge black candle and drastically reversed to upside, although in most cases it proceeds lower – is it a sign of bullish strength? Does this moment give us additional confidence with upward continuation? I think this might be so.
At the same time, just to be absolutely sure, I would like to get one more action – breakout through 1.33 Fib resistance on daily and erasing of H&S pattern on daily. That will just destroy all barriers on the way of bulls. So, if you’ve entered long on Thursday and hold your position – that’s perfect. If you have not entered yet, then probably it is not needed to rush and enter after this final moment.
Colored lines on the chart as usual are weekly pivot levels for coming week.

4-hour
Trend holds bullish here as well. In fact we have strong bullish context. There is couple of interesting moments here. First of all, recent price action reminds reverse H&S pattern – I’ve just take a look at previous report and we have really discussed this, but on hourly chart... The more interesting though, is its target at 1.3590 stands almost at the same level as weekly 0.618 target of AB-CD pattern.
Second moment is Agreement at 1.33-1.3315. This is the last stand for bears and daily H&S pattern. Although I strongly do not recommend short current market, but if you have bearish view this is nice point for that purpose. If even you will be wrong, you will be able to place tight stop here.

1-hour
Here is also two moments that worthy to be mentioned. I’ve marked Stop Grabber pattern with red circle on hourly chart. It gives us some assurance that market will reached 1.33-1.3310 Agreement. Then, probably some retracement could follow. It has to be used differently, depending on what you will do around 1.33-1.3310 level. If you’re bearish, and will enter short there (although as I’ve said, I do not recommend it, since overall context is bullish), you may use this retracement to move your stop to breakeven.
If you will search possibility to enter long, then, probably nearest 3/8 support at 1.3234 and K-support 1.3182-1.3197 are levels to focus on. This will be just 0.618 target, so theoretically retracement should not break K-support level.

Conclusion:
Long-term traders should sit on hands and wait when weekly AB=CD retracement will be over to enter short.
Although overall analysis may look a bit complicated, in fact, there are only two moments to keep in mind now. First – overall weekly/daily context is bullish and we should search possibilities to enter long. Second – just for more safety it makes sense to wait breakout of 1.33-1.3310 level. But how to enter long or enter long at all – this choice is up to you, since risk aversion is different among us. In daily updates we will try to find appropriate moment.
The technical portion of Sive's analysis owes a great deal to Joe DiNapoli's methods, and uses a number of Joe's proprietary indicators. Please note that Sive's analysis is his own view of the market and is not endorsed by Joe DiNapoli or any related companies.
