Sive Morten
Special Consultant to the FPA
- Messages
- 18,664
Fundamentals
This week we've got a lot of important data that we have to combine correctly. Because if you look at it separately you do not see the whole picture that now stands in economy. Besides, with cross-country view on US and China together, the major tendencies could be seen better. Besides, there are few issues that were not covered in media absolutely. For example contradiction between CPI and PPI numbers that clearly point on destruction process in real economy sector.
Let's start from CPI number, which was just 0.1% better than in March, showing 4.9% annual rate. It was a lot of euphoria around this change, that inflation is stepping down. If we take a look at the components of the index, then we will see that the largest part comes from services and rent. Core Inflation remains stable around 5.5%
Inflation in the US slowed to 4.9% y/y (lowest since May 2021), while inflation excluding energy and food is 5.5% y/y, practically unchanged since December 2022.
The assessment of annual inflation captures the period of abnormally high price growth rates from May to June 2022, and if we evaluate the 6-month price impulse, a more significant slowdown is observed.
The headline CPI rose by 1.6% over 6 months (3.3% per annum), while the core CPI rose by 2.4% (4.8% per annum). In June 2022, the peak 6-month price growth rates were 4.9% and 3.1%, i.e. in 10 months , energy has become the main disinflationary component , and since December 2022, food products have been connected.
Price growth at a rate of 2% over 6 months is already in components that have a weight of almost 42% in the CPI. Food, education, information and communications are added to the above list. As demand for real estate declines, prices for furniture and items for the garden and home life are slowing down - 6M impulse of 2.3% compared to 6.3% at the beginning of 2022.
The main problem of inflation is concentrated in services in the industry of culture, sports and entertainment, as well as in household and personal services, where price growth remains abnormally high in the range of 5.7-7% y/y. However, the weight of these services is insignificant and does not exceed 9% in the CPI.
The most negative contribution is made by rent, which accounts for almost a third of the CPI with a growth rate of up to 8% y / y - a lot, plus this is the most inertial component in the CPI. Rentals are affected by real estate prices, which are declining, but with a lag of about 12-15 months.
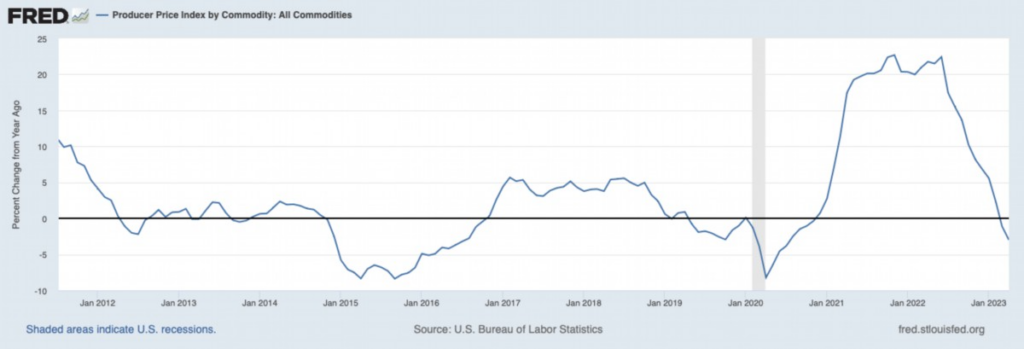
Meantime, all-commodity PPI clearly shows deflation of -3.0% for 3rd month in a row in production sector. How you could explain so significant divergence?
This situation can have only one explanation: the price reduction was either in intermediate industries, due to increased competition and falling demand. Or in the final ones, but there was also a decrease in demand due to increased competition with imports, for which prices have just increased. A fairly typical case: high-quality American-made goods began to sell worse, and cheap Chinese imports increased sales. And in connection with this, the growth of demand, sellers have increased prices. Indeed, take a look at recent US Import price index - first jump after few months of decreasing. Right after the moment when China ends Covid lockdown:
In any case, this is a clear indicator of the intensification of crisis processes in the American economy. It should be noted that similar processes are taking place in the Chinese economy. It seems that the pace of crisis processes is increasing. But here, most likely, politics makes its negative contribution. Take a look - we have the same dynamic in China. It seems that end of lockdown effect vapoured out fast. And this is with outstanding supportive measures and stimulus from PBOC. Drop of the import clearly shows that domestic consumption is dropping - absolutely the same as in the US.

PPI (Industrial Inflation Index) China -3.6% per year — the 7th negative in a row and a 3-year low, previously it was in 2015. Deflationary trends in China against the background of constant economic stimulation are a sure sign of very serious problems! Crisis stands under way. Last week we've talked about deterioration of manufacturing, washing out of whosale inventories in the US. But the same picture stands in other countries as well:

Personal consumption and Retail Sales are dropping across the Globe. If we take into account the systematically underestimated inflation (by 4-5 percent, at least), we get a very gloomy picture of the structural crisis in all its glory. Theoretically, the decline should be about 1% per month or 10% per year, but taking into account the colossal budget subsidies, it turns out less, 7-8% decline.
As a result, business and households' optimism is through the floor:

It is not surprising: the April CPI index in the USA (4.9%) is only symbolically less than the March indicator (5.0%), and the real figures in which citizens live are much higher. We do not think that consumer inflation in the US is less than 10% and this, of course, is an indicator of a very serious crisis. The overall picture looks depressing — and the question arises, maybe the acceleration of crisis processes really takes place? Well, for example, because of the fact that colossal resources are being withdrawn from the manufacturing economy and invested in defense production?
Second important event of passed week is a jump in Initial claims indicator. Unemployment starts moving from the dead point. First bell we've got last week when JOLT data surprisingly fell for solid amount. Besides, as we've said many times - employment data is adjusted hard by BLS, which is usually called as "Seasonal adjustments". Here is difference might be significant, and not in positive side.

And so what? Initial claims is very volatile indicator. But the trick stands if you take a look at unemployment and loan conditions for the business together. As Fathom shows, the lags between tighter credit standards spilling over from banks into the broader economy are somewhat longer, as the next chart suggests. It takes about a year for unemployment to peak after credit tightness is at its highest, as measured by the share of banks charging higher interest rates in excess of their cost of funding.
But the credit conditions' tightening is already underway. So, the surprising jump in Initial claims (Continues claims are rising for a long time already), is the first fruit and signal that unemployment should turn up soon.
Interest-rate risk has a habit of cascading into credit risk through the banking sector. For instance, in their search for higher yields many depositors are moving their money from US banks to money market funds. As banks lose deposits, their capacity to lend or renew existing loans is constrained. This means that borrowers must pay more for credit or may not get credit at all. This can create negative feedback loops for the real economy, as less credit means less spending, investment, and growth. As you probably get it - this has tight relation to slowdown of real production and explains why PPI starts dropping.
These effects are already happening. The next chart shows that there is a short lag between banks tightening their credit standards and small businesses noticing a lower availability and higher cost of credit. The latest data from America’s National Federation of Independent Business (NFIB) show that more firms are reporting a tougher credit environment since February.
A higher level of bankruptcies is one key mechanism through which tighter credit standards from banks spill over into higher unemployment. There are clear signs that this dynamic has already taken hold. Insolvencies appear to have bottomed in the US and have already started to rise in Europe and the UK. Moreover, decades of zero or negative interest rates coupled with generous pandemic support programmes have created large swathes of corporate zombies which could pose a severe risk to the global economy in the current cycle.
Following this economy sequence - "Fed rate jump -> Banks unrealized securities loss -> deposits withdrawal -> banking liquidity drought -> loans to the business drops -> slowdown of production -> producer deflation", the solution totally depends on the Fed, because problem stands with lack of banking liquidity due mark-to-market devalued US bonds and unrealized loss.
Thus, Fed and US Treasury somehow have to compensate this, to restore the Banking sector power to provide loans. In fact, they already start doing it with FDIC and special loan programme, backed by the same devalued US Bonds. Sounds great, but they need money to close these gaps and provide the cash. But particular with cash the Fed and US Treasury have big problems. Now, the cost of this problem is about $650-700 Bln. As we already mentioned. Seems not too much, even compares to JP Morgan cash position of ~ 950 Bln. But this is only on the first glance. Compensation of the banking securities portfolio float loss doesn't resolve the problem of interest rate. To ease loan conditions, banks have to have enough cash from households deposits. So the have to pay adequate deposit rate, which anyway makes loans to the business expensive. But banking crisis is not the hot problem by far. First is, it is controlled, because the Fed knew about problem in October 2022 and do nothing. Second - they still have time, because crisis spreading on real sector of economy comes slow.
Not only about Debt Ceil
Now the first results of the US budget become known, at least first data of tax collection has been published. Brief look over numbers shows that the US has big problems. US budget surplus in April fell by 43% due to lower tax revenues. The budget deficit reached $924.5 billion in the first seven months of the fiscal year, more than double the figure for the same period in 2022.

There are currently three vulnerable categories in the US that are eating into the budget:
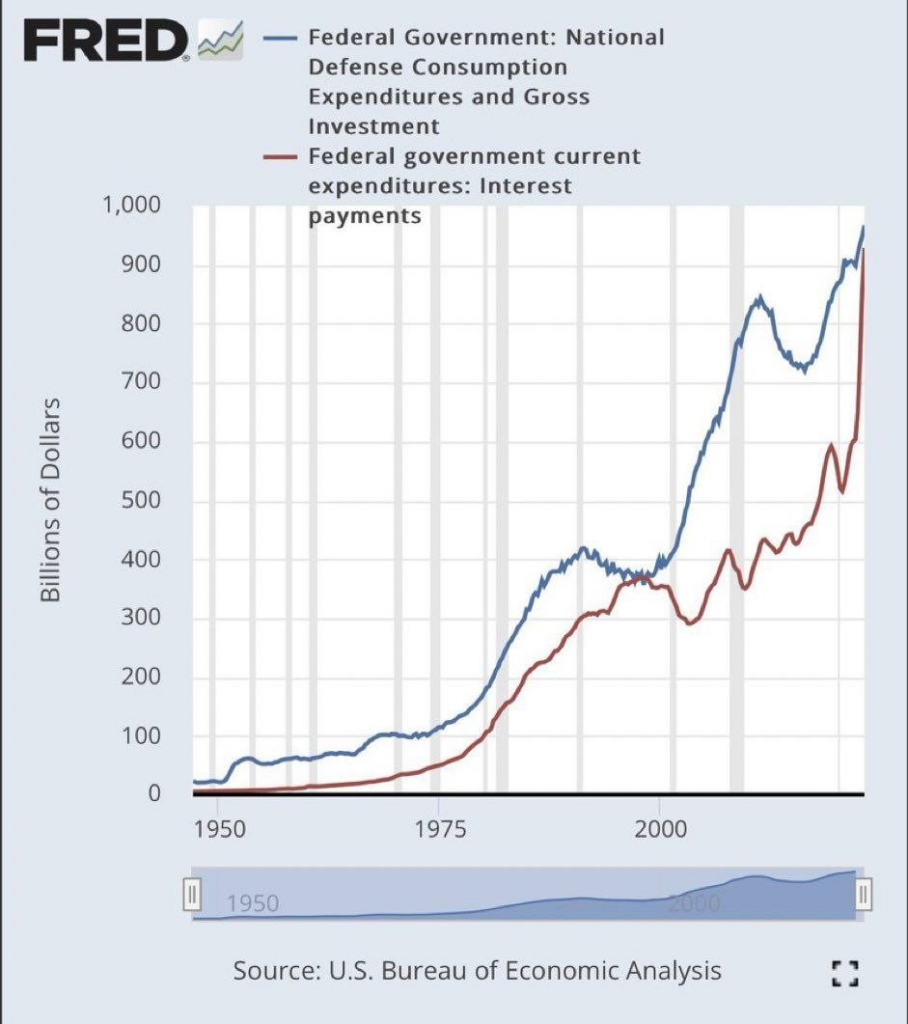
• Defense spending, which will continue to grow as the military-industrial complex is promoted and involved in international conflicts;
• Interest expenses that will continue to grow exponentially in an environment of extremely high rates;
• Social and medical costs - due to demographics.
Among the main changes in spending, it should be noted the extremely rising net interest expenses, which increased from 255.3 to 363.7 billion in the fiscal year.
As it is stated by Congressional Budget Office, the U.S. government is likely to need $1.9 trillion to $2.2 trillion in resources to fund operations through the end of the fiscal year on September 30. While the U.S. Treasury Department on Friday said it had just $88 billion in emergency measures to support government bill payments as of May 10. Oops...
J. Yellen is in total frustration and said that there was still uncertainty about exactly when Treasury would run out of cash to pay U.S. government debts, but she would keep Congress apprised of any change in the date, which could come as early as June 1. But, based on recent statement, we have at least two weeks until X-date. Probably more, because this is just until Congress notification.
Let's try to calculate - ~$2 Tln for US Budget, $700 Bln (at least) for banking sector and only $88 Bln in free cash on US Treasury account. Where to get money? Rising debt ceil or cut budget spending. Cash could be grabbed from other markets, such as stock and crypto. They just need to "crash the hopes" of fast rate cut. And US high persons already hint on it.
Why the Fed could keep raising rates?
If even when debt ceil will be increased, Fed will have to issue huge amount of bonds that could find no sufficient demand. Even historical allies decide to diversify investments in US debt. But US Treasury can't postpone this spending, they are needed "yesterday". The only source of cash, as we've talked about it already - stock and crypto markets. Now we already hear some warning notes.
Kashkari said, inflation has surprised policymakers with its persistence, and that the data push him toward the "hawkish" side of the Fed policy spectrum.
Besides, the speeches, there is another moment exist - inflation expectations are rising as well. While economists and futures traders expect Fed's cut and put it into the price, consumers and real sector expect rising of inflation in nearest few years. United States Michigan 5-Year Inflation expectations on the 15 year top.
And not only in the US - Euro zone consumers raised their inflation expectations in March for the first time since the autumn, even as the rate of price growth fell and the European Central Bank kept raising interest rates, an ECB survey showed on Thursday. The median respondent in the latest Consumer Expectation Survey saw prices growing by 5.0% in the coming 12 months, up from 4.6% in the previous survey round in February, the first increase since October.
Thus, The Federal Reserve is getting interest rates closer to where they need to be to win the battle against inflation, a pair of U.S. central bankers said on Friday, though neither gave a clear signal on whether they feel they have reached that point. Indeed a third U.S. central banker speaking early in the day, Governor Michelle Bowman, signaled she feels further policy tightening may yet be appropriate, unless inflation drops more convincingly.
Jefferson's remarks may draw particular attention after he was nominated earlier in the day by U.S. President Joe Biden to be the next Fed vice chair, a key role in shaping U.S. monetary policy.
Conclusion
Decreased tax revenue, rising budget spending and higher interest expense due to past monetary tightening cycle leads to US fiscal crisis. California already manifests. Treasury bond issuance is required to finance spending, but with reduced external demand for US government debt, this means that interest costs (premium) will rise which could lead to a new round of deficits and debt issuance.
The spiral can only be broken by the hands of the Fed, by turning on yield curve control (YCC), like in Japan, starting interest rate suppression / QE. Which, in turn, negatively affects the currency and leads to dollar devaluation [depreciation to any hard assets]. Given the country's dependence on imports, there will be a powerful surge in inflation. The system is coming to destruction rapidly. So moving the ceil is simple, but strategically useless. It's easier to sit in stagflation and fall by 10-15% in reality.
How it could impact the EUR/USD pair. Let's go with probability. Supposedly debt ceil should be raised. If this happens, US Treasury immediately pours markets with its bonds, pushing interest rates significantly higher as demand is depressed right now. This, in turn, should trigger demand for US Dollars and make negative effect on stocks and crypto markets. At the same time market expectations on fast Fed rate cut will be broken as well, because of jump in interest rates, and, in fact, printing another $2 Trln. Thus, before dollar collapse, it could show explosive rally. Other words, speaking, it might be a bit better before it turns much worse.
This week we've got a lot of important data that we have to combine correctly. Because if you look at it separately you do not see the whole picture that now stands in economy. Besides, with cross-country view on US and China together, the major tendencies could be seen better. Besides, there are few issues that were not covered in media absolutely. For example contradiction between CPI and PPI numbers that clearly point on destruction process in real economy sector.
Let's start from CPI number, which was just 0.1% better than in March, showing 4.9% annual rate. It was a lot of euphoria around this change, that inflation is stepping down. If we take a look at the components of the index, then we will see that the largest part comes from services and rent. Core Inflation remains stable around 5.5%
Inflation in the US slowed to 4.9% y/y (lowest since May 2021), while inflation excluding energy and food is 5.5% y/y, practically unchanged since December 2022.
The assessment of annual inflation captures the period of abnormally high price growth rates from May to June 2022, and if we evaluate the 6-month price impulse, a more significant slowdown is observed.
The headline CPI rose by 1.6% over 6 months (3.3% per annum), while the core CPI rose by 2.4% (4.8% per annum). In June 2022, the peak 6-month price growth rates were 4.9% and 3.1%, i.e. in 10 months , energy has become the main disinflationary component , and since December 2022, food products have been connected.
Price growth at a rate of 2% over 6 months is already in components that have a weight of almost 42% in the CPI. Food, education, information and communications are added to the above list. As demand for real estate declines, prices for furniture and items for the garden and home life are slowing down - 6M impulse of 2.3% compared to 6.3% at the beginning of 2022.
The main problem of inflation is concentrated in services in the industry of culture, sports and entertainment, as well as in household and personal services, where price growth remains abnormally high in the range of 5.7-7% y/y. However, the weight of these services is insignificant and does not exceed 9% in the CPI.
The most negative contribution is made by rent, which accounts for almost a third of the CPI with a growth rate of up to 8% y / y - a lot, plus this is the most inertial component in the CPI. Rentals are affected by real estate prices, which are declining, but with a lag of about 12-15 months.
Meantime, all-commodity PPI clearly shows deflation of -3.0% for 3rd month in a row in production sector. How you could explain so significant divergence?
This situation can have only one explanation: the price reduction was either in intermediate industries, due to increased competition and falling demand. Or in the final ones, but there was also a decrease in demand due to increased competition with imports, for which prices have just increased. A fairly typical case: high-quality American-made goods began to sell worse, and cheap Chinese imports increased sales. And in connection with this, the growth of demand, sellers have increased prices. Indeed, take a look at recent US Import price index - first jump after few months of decreasing. Right after the moment when China ends Covid lockdown:
In any case, this is a clear indicator of the intensification of crisis processes in the American economy. It should be noted that similar processes are taking place in the Chinese economy. It seems that the pace of crisis processes is increasing. But here, most likely, politics makes its negative contribution. Take a look - we have the same dynamic in China. It seems that end of lockdown effect vapoured out fast. And this is with outstanding supportive measures and stimulus from PBOC. Drop of the import clearly shows that domestic consumption is dropping - absolutely the same as in the US.
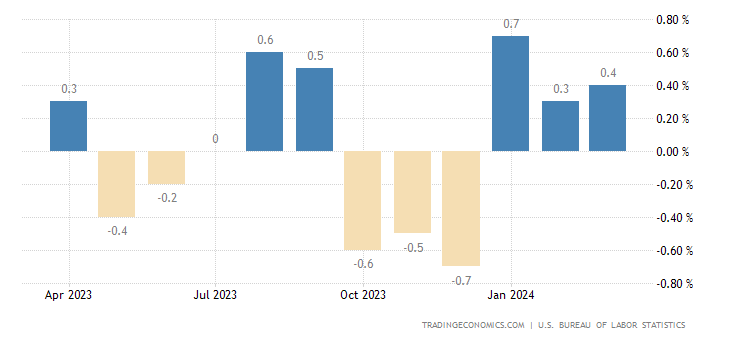
PPI (Industrial Inflation Index) China -3.6% per year — the 7th negative in a row and a 3-year low, previously it was in 2015. Deflationary trends in China against the background of constant economic stimulation are a sure sign of very serious problems! Crisis stands under way. Last week we've talked about deterioration of manufacturing, washing out of whosale inventories in the US. But the same picture stands in other countries as well:
Personal consumption and Retail Sales are dropping across the Globe. If we take into account the systematically underestimated inflation (by 4-5 percent, at least), we get a very gloomy picture of the structural crisis in all its glory. Theoretically, the decline should be about 1% per month or 10% per year, but taking into account the colossal budget subsidies, it turns out less, 7-8% decline.
As a result, business and households' optimism is through the floor:
It is not surprising: the April CPI index in the USA (4.9%) is only symbolically less than the March indicator (5.0%), and the real figures in which citizens live are much higher. We do not think that consumer inflation in the US is less than 10% and this, of course, is an indicator of a very serious crisis. The overall picture looks depressing — and the question arises, maybe the acceleration of crisis processes really takes place? Well, for example, because of the fact that colossal resources are being withdrawn from the manufacturing economy and invested in defense production?
Second important event of passed week is a jump in Initial claims indicator. Unemployment starts moving from the dead point. First bell we've got last week when JOLT data surprisingly fell for solid amount. Besides, as we've said many times - employment data is adjusted hard by BLS, which is usually called as "Seasonal adjustments". Here is difference might be significant, and not in positive side.
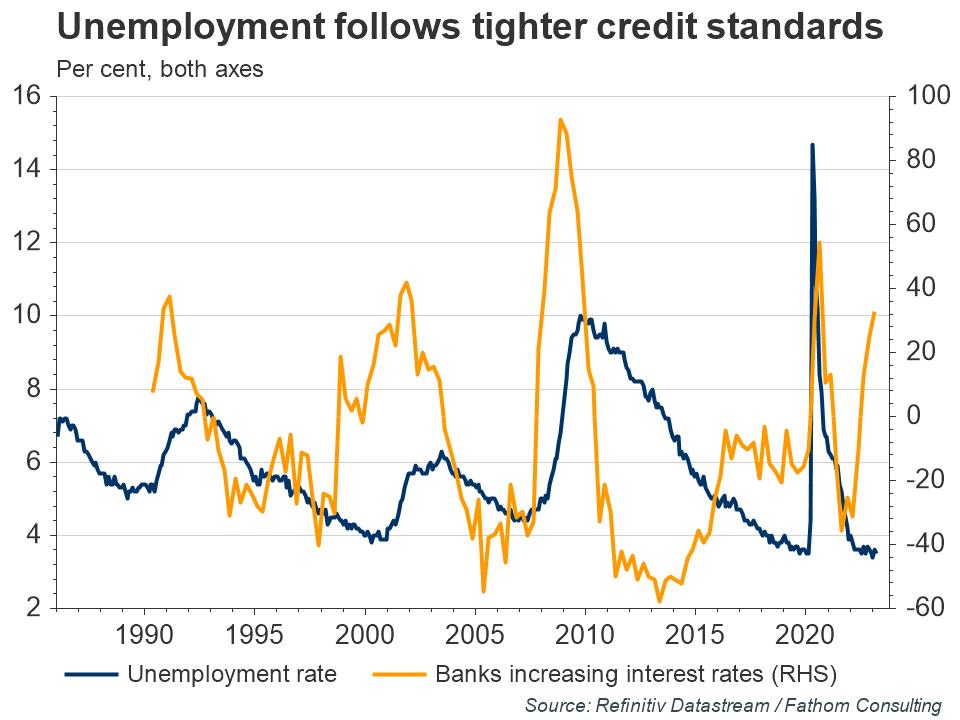
And so what? Initial claims is very volatile indicator. But the trick stands if you take a look at unemployment and loan conditions for the business together. As Fathom shows, the lags between tighter credit standards spilling over from banks into the broader economy are somewhat longer, as the next chart suggests. It takes about a year for unemployment to peak after credit tightness is at its highest, as measured by the share of banks charging higher interest rates in excess of their cost of funding.
But the credit conditions' tightening is already underway. So, the surprising jump in Initial claims (Continues claims are rising for a long time already), is the first fruit and signal that unemployment should turn up soon.
Interest-rate risk has a habit of cascading into credit risk through the banking sector. For instance, in their search for higher yields many depositors are moving their money from US banks to money market funds. As banks lose deposits, their capacity to lend or renew existing loans is constrained. This means that borrowers must pay more for credit or may not get credit at all. This can create negative feedback loops for the real economy, as less credit means less spending, investment, and growth. As you probably get it - this has tight relation to slowdown of real production and explains why PPI starts dropping.
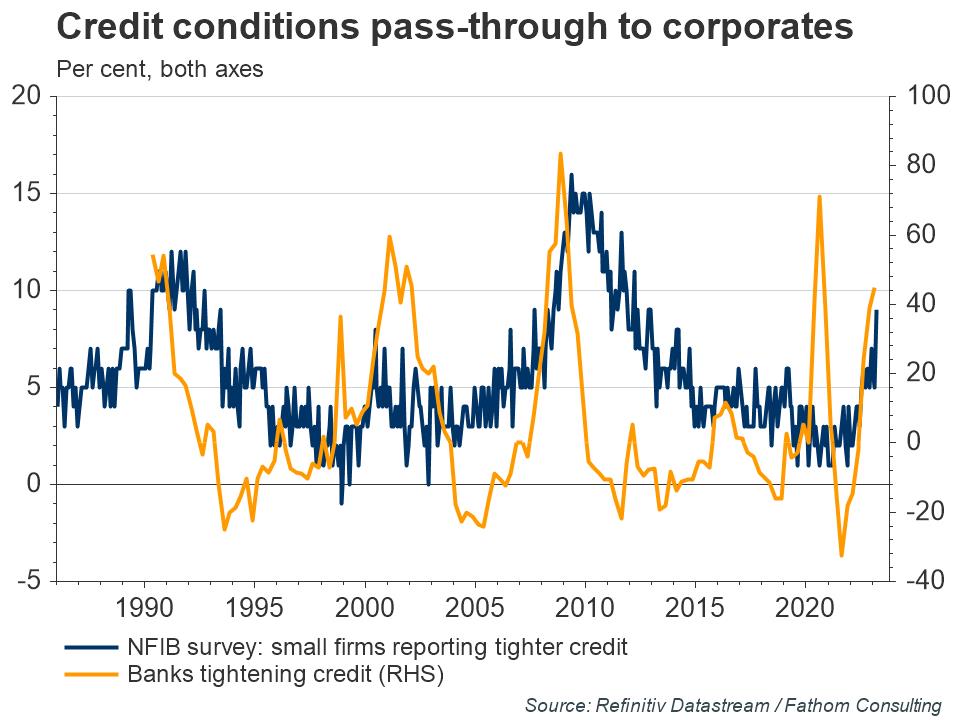
These effects are already happening. The next chart shows that there is a short lag between banks tightening their credit standards and small businesses noticing a lower availability and higher cost of credit. The latest data from America’s National Federation of Independent Business (NFIB) show that more firms are reporting a tougher credit environment since February.
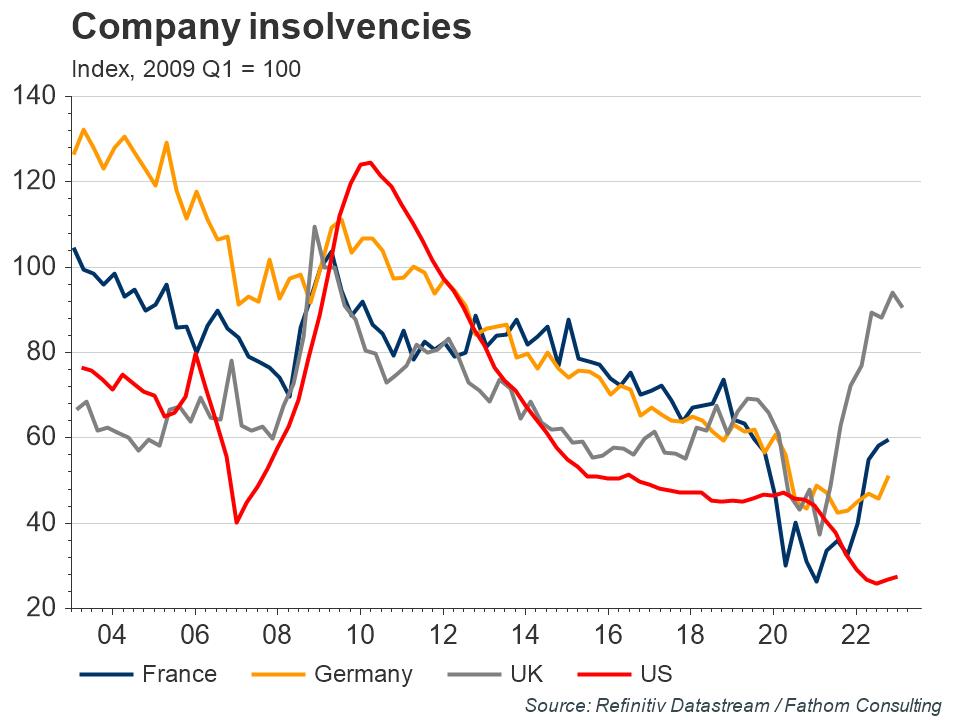
A higher level of bankruptcies is one key mechanism through which tighter credit standards from banks spill over into higher unemployment. There are clear signs that this dynamic has already taken hold. Insolvencies appear to have bottomed in the US and have already started to rise in Europe and the UK. Moreover, decades of zero or negative interest rates coupled with generous pandemic support programmes have created large swathes of corporate zombies which could pose a severe risk to the global economy in the current cycle.
Following this economy sequence - "Fed rate jump -> Banks unrealized securities loss -> deposits withdrawal -> banking liquidity drought -> loans to the business drops -> slowdown of production -> producer deflation", the solution totally depends on the Fed, because problem stands with lack of banking liquidity due mark-to-market devalued US bonds and unrealized loss.
Thus, Fed and US Treasury somehow have to compensate this, to restore the Banking sector power to provide loans. In fact, they already start doing it with FDIC and special loan programme, backed by the same devalued US Bonds. Sounds great, but they need money to close these gaps and provide the cash. But particular with cash the Fed and US Treasury have big problems. Now, the cost of this problem is about $650-700 Bln. As we already mentioned. Seems not too much, even compares to JP Morgan cash position of ~ 950 Bln. But this is only on the first glance. Compensation of the banking securities portfolio float loss doesn't resolve the problem of interest rate. To ease loan conditions, banks have to have enough cash from households deposits. So the have to pay adequate deposit rate, which anyway makes loans to the business expensive. But banking crisis is not the hot problem by far. First is, it is controlled, because the Fed knew about problem in October 2022 and do nothing. Second - they still have time, because crisis spreading on real sector of economy comes slow.
Not only about Debt Ceil
Now the first results of the US budget become known, at least first data of tax collection has been published. Brief look over numbers shows that the US has big problems. US budget surplus in April fell by 43% due to lower tax revenues. The budget deficit reached $924.5 billion in the first seven months of the fiscal year, more than double the figure for the same period in 2022.
There are currently three vulnerable categories in the US that are eating into the budget:
• Defense spending, which will continue to grow as the military-industrial complex is promoted and involved in international conflicts;
• Interest expenses that will continue to grow exponentially in an environment of extremely high rates;
• Social and medical costs - due to demographics.
Among the main changes in spending, it should be noted the extremely rising net interest expenses, which increased from 255.3 to 363.7 billion in the fiscal year.
As it is stated by Congressional Budget Office, the U.S. government is likely to need $1.9 trillion to $2.2 trillion in resources to fund operations through the end of the fiscal year on September 30. While the U.S. Treasury Department on Friday said it had just $88 billion in emergency measures to support government bill payments as of May 10. Oops...
J. Yellen is in total frustration and said that there was still uncertainty about exactly when Treasury would run out of cash to pay U.S. government debts, but she would keep Congress apprised of any change in the date, which could come as early as June 1. But, based on recent statement, we have at least two weeks until X-date. Probably more, because this is just until Congress notification.
Let's try to calculate - ~$2 Tln for US Budget, $700 Bln (at least) for banking sector and only $88 Bln in free cash on US Treasury account. Where to get money? Rising debt ceil or cut budget spending. Cash could be grabbed from other markets, such as stock and crypto. They just need to "crash the hopes" of fast rate cut. And US high persons already hint on it.
Why the Fed could keep raising rates?
The Fed is likely to have to raise interest rates further and keep them at a higher level for some time if the price pressure in the US does not ease and the labor market does not show signs of slowing down, said Michelle Bowman, a member of the US Federal Reserve Board of Governors.
Kashkari said, inflation has surprised policymakers with its persistence, and that the data push him toward the "hawkish" side of the Fed policy spectrum.
With inflation far too high, Kashkari said in response to a question from the audience, "now is not the time" to rethink the Fed's 2% target for inflation. That goal, set in 2012, "is permanent for the near future," at least until the Fed gets inflation down to that goal, he said.
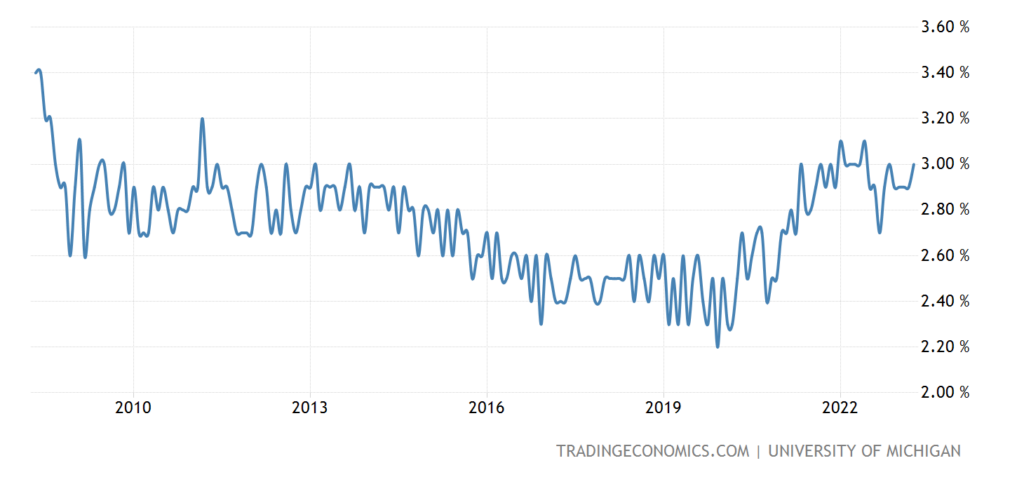
Besides, the speeches, there is another moment exist - inflation expectations are rising as well. While economists and futures traders expect Fed's cut and put it into the price, consumers and real sector expect rising of inflation in nearest few years. United States Michigan 5-Year Inflation expectations on the 15 year top.
And not only in the US - Euro zone consumers raised their inflation expectations in March for the first time since the autumn, even as the rate of price growth fell and the European Central Bank kept raising interest rates, an ECB survey showed on Thursday. The median respondent in the latest Consumer Expectation Survey saw prices growing by 5.0% in the coming 12 months, up from 4.6% in the previous survey round in February, the first increase since October.
Thus, The Federal Reserve is getting interest rates closer to where they need to be to win the battle against inflation, a pair of U.S. central bankers said on Friday, though neither gave a clear signal on whether they feel they have reached that point. Indeed a third U.S. central banker speaking early in the day, Governor Michelle Bowman, signaled she feels further policy tightening may yet be appropriate, unless inflation drops more convincingly.
"Is inflation still too high? Yes," Fed Governor Philip Jefferson said at a monetary policy conference at the Hoover Institution. "Has the current disinflation been uneven and slower than any of us would like? Yes. But my reading of this evidence is that we are 'doing what is necessary or expected' of us," which is the dictionary definition, he said, of being "on track."
Jefferson's remarks may draw particular attention after he was nominated earlier in the day by U.S. President Joe Biden to be the next Fed vice chair, a key role in shaping U.S. monetary policy.
Conclusion
Decreased tax revenue, rising budget spending and higher interest expense due to past monetary tightening cycle leads to US fiscal crisis. California already manifests. Treasury bond issuance is required to finance spending, but with reduced external demand for US government debt, this means that interest costs (premium) will rise which could lead to a new round of deficits and debt issuance.
The spiral can only be broken by the hands of the Fed, by turning on yield curve control (YCC), like in Japan, starting interest rate suppression / QE. Which, in turn, negatively affects the currency and leads to dollar devaluation [depreciation to any hard assets]. Given the country's dependence on imports, there will be a powerful surge in inflation. The system is coming to destruction rapidly. So moving the ceil is simple, but strategically useless. It's easier to sit in stagflation and fall by 10-15% in reality.
How it could impact the EUR/USD pair. Let's go with probability. Supposedly debt ceil should be raised. If this happens, US Treasury immediately pours markets with its bonds, pushing interest rates significantly higher as demand is depressed right now. This, in turn, should trigger demand for US Dollars and make negative effect on stocks and crypto markets. At the same time market expectations on fast Fed rate cut will be broken as well, because of jump in interest rates, and, in fact, printing another $2 Trln. Thus, before dollar collapse, it could show explosive rally. Other words, speaking, it might be a bit better before it turns much worse.