FOREX PRO Weekly May 16-20, 2011

oscillators

Hello Mr. Morten!
Maybe a word or two before the lesson about oscillators that I am looking forward to attend...
Is this a divergence with the oscillators? Is this what we are looking for?
Should we use it as leading or lagger?
Thank you.
 

Attachments

  • eurusd.gif
    eurusd.gif
    15.8 KB · Views: 201
  • eurusd h1.gif
    eurusd h1.gif
    17.8 KB · Views: 203
EUR/USD Daily Update, Tue 17, May 2011

Good morning,
Looks like our trading plan for Monday has been acomplished - market has touched Pivot and 4-hour Confluence resistance and moved lower.
So, if you've entered as we planned - move your stop to b/e. If you're flat now - stay flat.

Daily.
Here market has touched weekly confluence support from minor weekly reaction points (see my post on the 1st page of current topic), and shown Piercing in the cloud pattern. Although it could be a confirmation of current support and market will start weekly retracement that we're waiting for, I want to see some additional confirmation to get more confidence from intraday charts.

On 4-hour chart we see parallel channel. Market has hit all the targets from ABC pattern, except the last one 1.3947 that is very close to weekly pivot support 1 at 1.3961. It will be much better if market will turn to upmove after it will touched it. Because I feel not so comfortable, when some important target stands below and I intend to enter Long.

On hourly chart we can see multiple scenarios.
First - it could be Butterfly "Sell" with 1.27 target around 1.44. Second, and my prefferable scenario - Butterfly Buy with target at 1.3940 - the same as AB-CD downward pattern. If we will see this scenario - we can enter Long around 1.3940-1.3960 with very tight stop and tremendous Risk/reward ratio.
Third scenario -market could show breakout of this channel with Gartley "222" pattern, that is also OK. But I prefer to see it after market will hit 1.3947 target.
So, wait for clearer signals. If you short currently - move stop to b/e and hope that market will hit 1.3940-1.3960. If you flat - stay flat.
 

Attachments

  • EUR_D_17_05_11.PNG
    EUR_D_17_05_11.PNG
    40.7 KB · Views: 201
  • EUR_4H1_17_05_11.PNG
    EUR_4H1_17_05_11.PNG
    42.9 KB · Views: 201
  • EUR_1H_17_05_11.PNG
    EUR_1H_17_05_11.PNG
    40.1 KB · Views: 202
Hello Mr. Morten!
Maybe a word or two before the lesson about oscillators that I am looking forward to attend...
Is this a divergence with the oscillators? Is this what we are looking for?
Should we use it as leading or lagger?
Thank you.

Hi Georgeta,
For overbought/oversold (OB/OS) analysis is better to use Detrended Oscillator (DOSC). If you have DiNapoli book - read corresponding part. Here he speaks about it with details.
DOSC is leading indicator, because you aprox. know the areas where market will be OB/OS ahead of time.
Better to use it on time frames no less than daily, although it could help on intraday charts as well.
If you do not have book - soon in Forex Military School will appear material dedicated to different indicators. There you will find how to apply DOSC.
I can't write it here, because it rather large material and using of DOSC not so simple.
 
EUR/USD Daily Update, Wed 18, May 2011

Good morning,
our wanted scenario has not come to life yesterday. It's a pitty, because it could give us sufficient confidence to enter long. Still, we have to work with environment that market gives us.

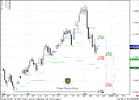
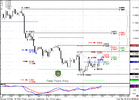
On daily time frame there is nothing really new. The same piercing in the cloud pattern and some slow continuation to upside.

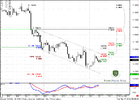
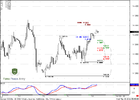
on 4 hour chart I have some worries. First, current move up does not impress me much, this is not shifting in market momentum and just gradual AB-CD move. I have some suspicions that probably market still could touch 1.3960 area.
On Bloomberg said, that this move up is due speculation that Fed will trail ECB in rate hiking. But for that rumors current move is too calm. So I feel some trap here.
Also, you can see couple of targets - 1.27 Butterfly around 1.4409, just above Confluence resistance 1.4370 and closer AB-CD target 1.4310.

The major conclusion still, that we don't know - is it real start of weekly momentum trade or not. So, just to not skip it totally, possibly we can try carefully enter long with retracement level on hourly chart. But still we need reduce trading volume and place tight stops.
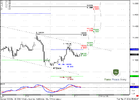
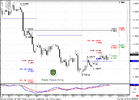
on hourly chart, I suppose that attempt enter long from hourly Confluence support and stop just below 1.41 will be not bad. But this is only if you have no patient.
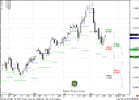
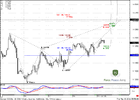
I have to say, that market, when confrims some strong support by nice strong candle (look on weekly timeframe), usually shows solid retracement down on intraday charts, that allows us to enter.
So, if you afraid to skip this move - you may try enter as we discussed. But I have some suspicions about current move. I do not trust it totally.
 

Attachments

  • EUR_D_18_05_11.PNG
    EUR_D_18_05_11.PNG
    40.6 KB · Views: 150
  • EUR_4H_18_05_11.PNG
    EUR_4H_18_05_11.PNG
    44.9 KB · Views: 149
  • EUR_1H_18_05_11.PNG
    EUR_1H_18_05_11.PNG
    41.4 KB · Views: 152
pivot

Hi Sive!
You say that there is a Confluence support on Hourly. Usually you take in consideration Weekly pivot too. Can we consider WP as support today?
Thank you.
 
Hi Sive!
You say that there is a Confluence support on Hourly. Usually you take in consideration Weekly pivot too. Can we consider WP as support today?
Thank you.

In general, yes, but it has been penetrated in both ways, so, probably it will not so significant as during first touch.
 
But I have some suspicions about current move. I do not trust it totally.

I have been suspicious as well, maybe you can throw out your suspicions to us. These past two weeks there has been nothing clear and clean such as bouncing off of 38% fibs or pivots, to help shape a trend. After losing quite a few trades, and then getting gunshy because of it, I am currently monitoring the EUR only. Sive have you seen any other futures showing solid signs?
 
I have been suspicious as well, maybe you can throw out your suspicions to us. These past two weeks there has been nothing clear and clean such as bouncing off of 38% fibs or pivots, to help shape a trend. After losing quite a few trades, and then getting gunshy because of it, I am currently monitoring the EUR only. Sive have you seen any other futures showing solid signs?

Hi Joshnix,
If you talk about currencies - not much. But, one thing, that I track currently is a weekly S&P 500. There is nice potential for DRPO Sell LAL. At least now it looks pretty. But the major question how it will turn.
Also 10-year Treasuries have excellent thrust at daily time frame. IT could be potential for some Directional trades.
 
EUR/USD Daily Update, Thu 19, May 2011

Good morning,
recent price action was shallow. I still have no confidence with current move up. It's rather choppy and looks like retracement. There is no shift in momentum on intraday chart.
So, probably it could lead to deep retracement on next week 1.41 or even lower, or even to establishing of new lows by hiting 1.618 target around 1.3950 area.
But first scenario is more probable.

If you take a look at 4-hour chart, you'll see that we have clear AB-CD pattern with target 1.4310. Also CD leg is much flatter than AB. This is the sign of weakness. If you've entered long yesterday, keep an eye on this area.
Also we have butterfly with target at 1.4410 just above 4-hour Confluence support at 1.4370-1.4380. But taking into consideration the way how market moves up - I'm not sure that it will reach it.
 

Attachments

  • EUR_4H_19_05_11.PNG
    EUR_4H_19_05_11.PNG
    42.6 KB · Views: 103
  • EUR_1H_19_05_11.PNG
    EUR_1H_19_05_11.PNG
    43.6 KB · Views: 102
Hi Sive;
If we enter short at the 1.4309 area at the first touch, where would we put the stop and the t/p?
 
Back
Top