FOREX PRO Weekly May 16-20, 2011

Hi Sive;
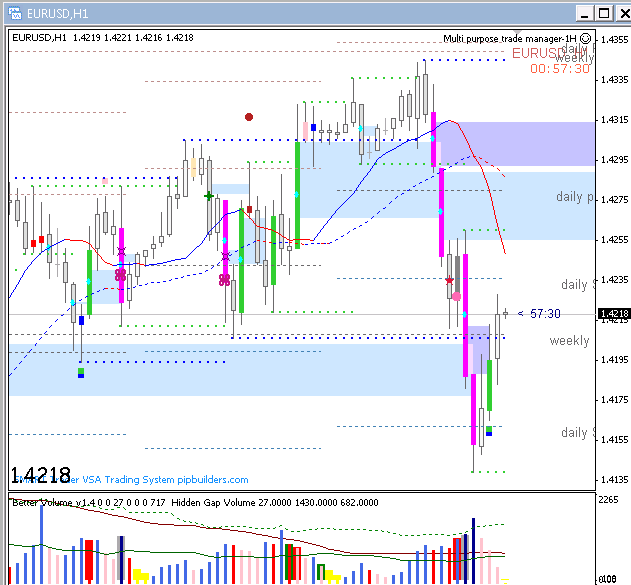
If we enter short at the 1.4309 area at the first touch, where would we put the stop and the t/p?

Well, it depends on what particular pattern do you trade. Let's suppose that this is AB-CD.
Then, since EUR harmonic number is about 37-40 pips - that your stop above D point.
Target - one of the Fib retracement levels. Better to take profit form half a position, when it will pass down equal to s/l amount (same 37-40 pips), then move stop to b/e.
The rest half - close on the next Fib support, for instance 0.618. Or, look how market will move. IF it will fall like a stone - probably you will want to hold your shorts a bit longer.
 
Hi Sive,

what mean Gartley "222" pattern ??
and how long it takes to be able to touch 1:39 ?

-thank you-

Hi Jimmy,
"222" - is initial thrust and then AB-CD retracement.
Well, I don't know how long it could take :). I'm not sure that it has to happen at all. But current move up is not impressive also.
 
Sive, could we be forming a Bear Flag here, see this link.

Trading Stocks Chart Patterns: Bear Flag

If so our target would be the 1.3950 area.

Hi Bob,
it is not so clear, more looks like pennant, but yes, there could be another move down. As usual the target of market after flag - length of the flag's mast.
And it's about 300 pips.
Still it's better to get all puzzle together, before make a decision.
 
EUR/USD Daily Update, Fri 20, May 2011

Good morning,
Again there is nothing to discuss on daily.

On 4-hour chart smooth move up is continuing and market has hit 1.4310 - target of AB-CD pattern. As I've said some times before - I don't trust to current move and don't like it. :)
The point is that solid retracement on weekly chart should look like strong upside trend on intraday charts. But here I do not see it - no shift in momentum, just gradual retracement move.
For those who familiar with EW - probably we see now 4th wave on 4-hour chart, and will see 5th a bit later.

On 4-hour chart -we see the same picture as yesterday.
But on hourly there is some interesting. First - we clear see bearish wedge is forming with MACD Divergence. Second - market has accomplished 1.27 Butterfly Sell and AB-CD.
1.618 target of this Butterfly stands precisely at the same area as 4-hour larger butterfly - around 1.4370-1.44 area.

So, my thought is that we have to be prepare to sell-off. If you hold longs - keep an eye at 1.4360-1.44 area - be sensitive to any Sell signals, that could appear there. I suspect that we will see some deep down retracement still or even new lows.
 

Attachments

  • EUR_4H_20_05_11.PNG
    EUR_4H_20_05_11.PNG
    45.2 KB · Views: 103
  • EUR_1H_20_05_11.PNG
    EUR_1H_20_05_11.PNG
    45.7 KB · Views: 100
How do you know this stuff?:eek:oh:

Hi Georgeta, what stuff?
You mean sell-off?
Well, I've explained that. In details I've spoken about that in video.
Generally speaking - the way, how upside move developed - this is not what I want to see. We need shift in momentum - here was just choppy retracement.
 
So, my thought is that we have to be prepare to sell-off. If you hold longs - keep an eye at 1.4360-1.44 area - be sensitive to any Sell signals, that could appear there. I suspect that we will see some deep down retracement still or even new lows.

Ok, at this point I am seriously impressed Sive, really. I have nothing more to say. The chart says it all.

1305914561-clipj21565-17kb.png
 
Ok, at this point I am seriously impressed Sive, really. I have nothing more to say. The chart says it all.

Hi Fernando,
You and Gergeta overvalue my possibilities, really. In fact, this was just a question of observation. I'm sure, that by paying more attention to nuances - and you will be able to see the same as well during next akin moment in price action.
For that purpose we are here - to learn, study and to exchange experience.
 
Back
Top