Sive Morten
Special Consultant to the FPA
- Messages
- 18,621
Monthly
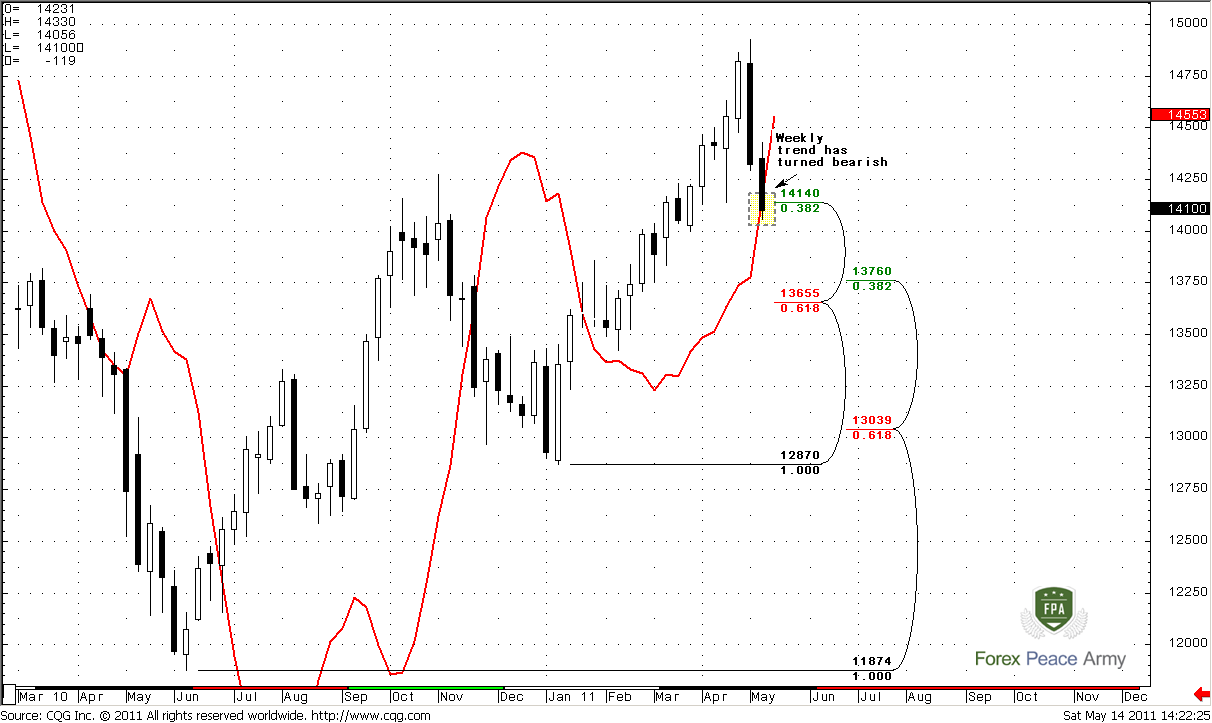
So, guys, here you can see all importance of monthly overbought. Finally market has fallen into retracement that was awaited by positional traders and shown solid plunge.
As we said during the previous week - the first area to watch is 1.4140 – previous highs and nearest Fib support – market has hit it. Overall current look is frightening. If market will close as it is – it will turn to huge bearish engulfing pattern. Although we can’t exclude that it could be canceled by the market but more probable seems the perspective of continuation at least till monthly Confluence support at 1.3655-1.3760. This possibility also implicitly confirms with market overbought. Usual retracement target during overbought is zero point of Detrended Oscillator and this level stands around monthly Confluence support. Also its worth to note here that trend will remain bullish, even if market will reach 1.37 area. Still, if market will hold on first Fib support, this will be much better for current bullish bias and Butterfly pattern.
Nearest target stands at 1.5272, but potentially it could turn to butterfly “Sell” pattern. The target of this pattern is 1.27 extension at 1.6027. Also it almost coincides with 1.27 target of recent bullish AB-CD at 1.5925.

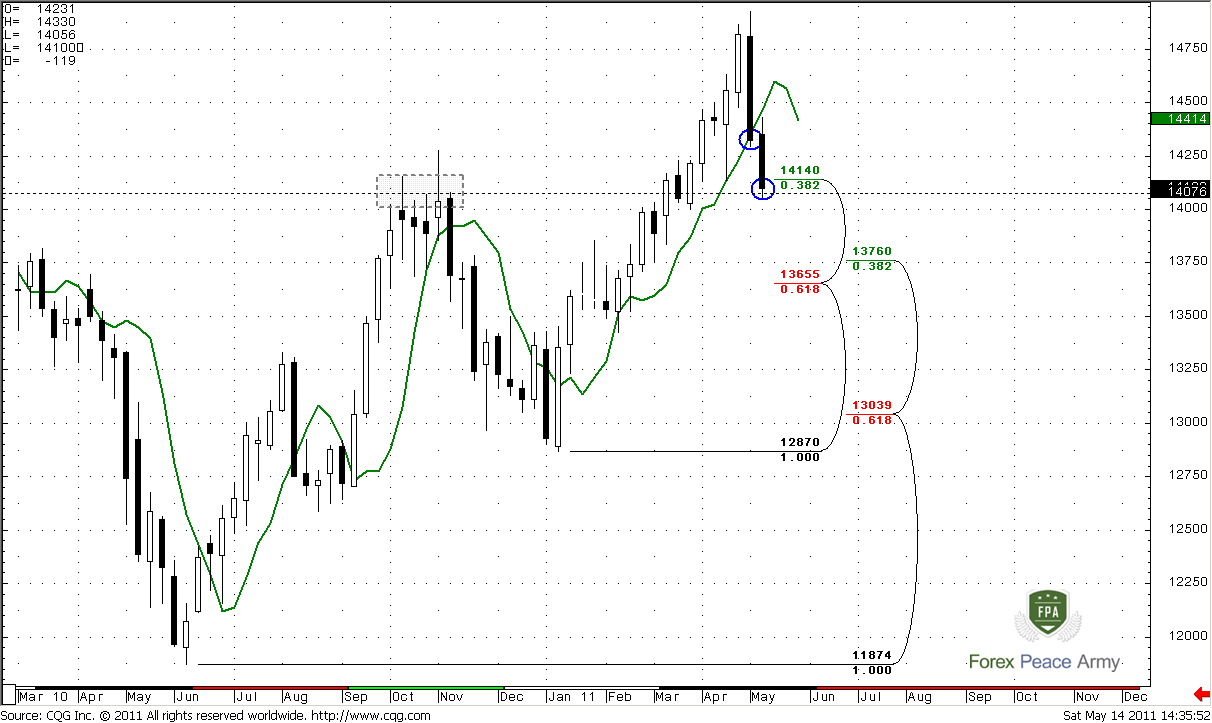
Weekly
This time frame is especially interesting on coming week. Our expectations are linked to potential B&B “Buy” trade due to previous upside momentum. So, market usually tries to continue previous move mechanically, i.e. because of momentum. This very often leads to deep retracement up right after initial plunge. That’s what we waiting for. But this retracement usually starts from some solid support and not later than 1-3 closes below 3x3 SMA (chart #2). Speaking about the levels - there are just two that are suitable for that purpose – market has reached first one 1.4140. Second one – is weekly Confluence support at 1.3655-1.3760. Now market has shown two closes below green line already. And speaking from purity view of B&B “Buy” trade – I prefer to see its start from current support. 1.4140 is also a previous highs.
Second important moment is that weekly trend has turned bearish. This fact forces us to be extra careful. Because when MACDP (red line) comes in play, the development during coming week could be twofold – market could show solid up move and form MACDP failure, i.e. trend shifting failure pattern. This will mean that we can count on taking out of previous highs and continuation of previous move up in terms of monthly Butterfly etc. The fact that market has closed slightly below 1.4140 has not canceled this level yet. Because this is weekly Fib support and this is more an area rather than sharp level. Second – if market will continue move down, then probably we will see 1.37 area.
We should get some answer in the beginning of the week by keeping a close eye on daily time frame and pivot points trading.
#1
#2
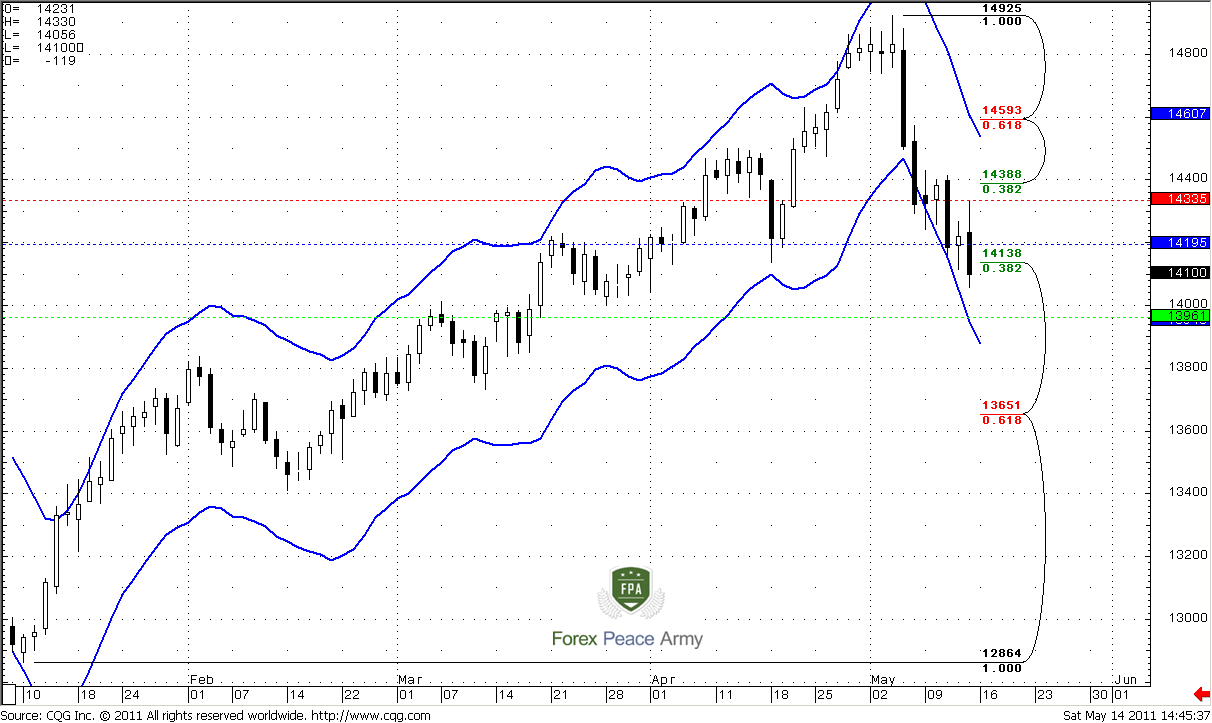
Daily
There is only one important issue for daily time frame since previous week. If you trade on daily time frame, now you have bearish context, because weekly trend has turned bearish and daily trend is bearish. Hence you have to look for possibility to enter short.
Speaking about overall picture – I do not see any interesting currently. Colored lines are weekly pivots. Market is not at oversold, which is 1.3880 for Monday. That’s why price could not show solid retracement in the beginning of the week. Usually in such circumstances market retraces to Pivot resistance 1 at 1.4335 that stands almost in one point with first Fib resistance 1.4388, 0.618 Fib resistance stabds at 1.4593 that coincides with daily overbought. That’s important.
4-hour
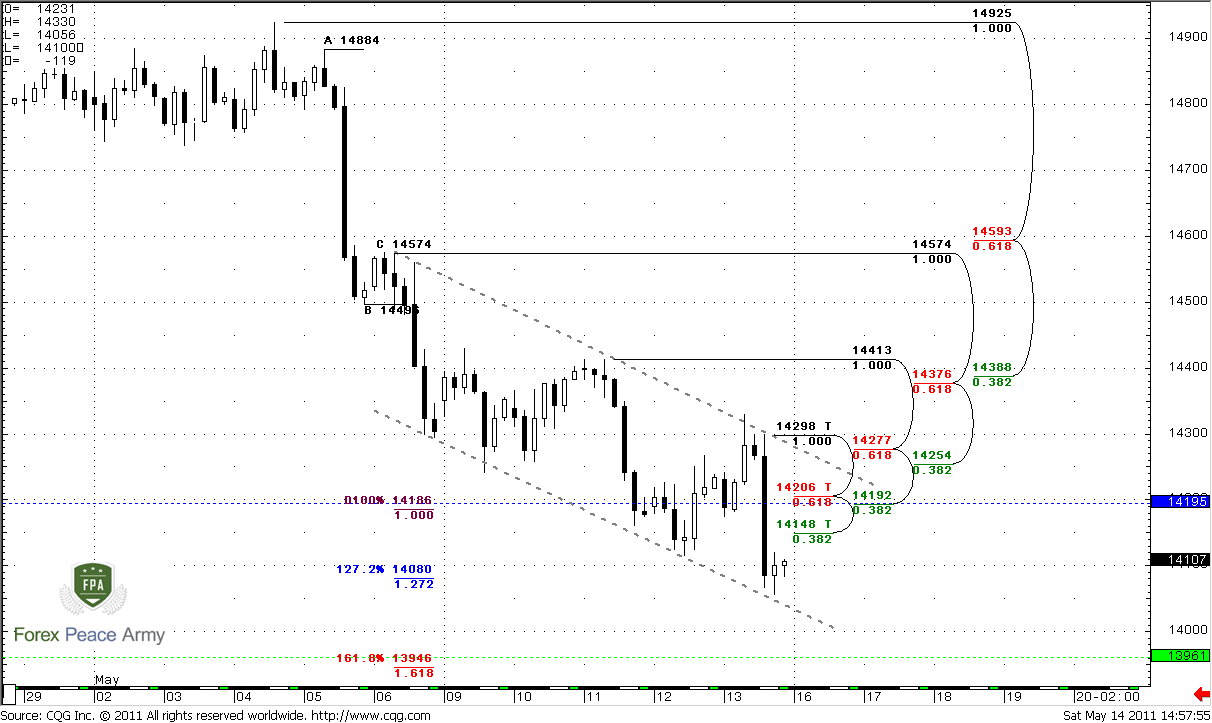
On this time frame now we clearly see that market has turned to parallel channel and gradually accomplished 3 from 4 potential targets. Hence, the next area to watch for is 1.3940-1.3960. This is pivot support 1 and 1.618 target from the same ABCD pattern. If we take a close look at price action inside channel that we’ll see that this is “plunge then AB-CD retracement.” This has repeated twice already. Just above the market I’ve pointed potential resistance levels. Taking into consideration that market is not at oversold on daily, then possibly it will be just AB-CD retracement to pivot point at 1.4195 that is also a 4-hour Confluence resistance 1.4192-1.4206. The potential target of weekly B&B is we assume that it starts right now will be 1.4593 – 0.618 resistance from whole move down. But this is just for information, so you could estimate it by yourself.
So, if you’re scalp trader, you may try to enter short from pivot with stop above next Confluence 1.4254-1.4277 with target 1.3950.
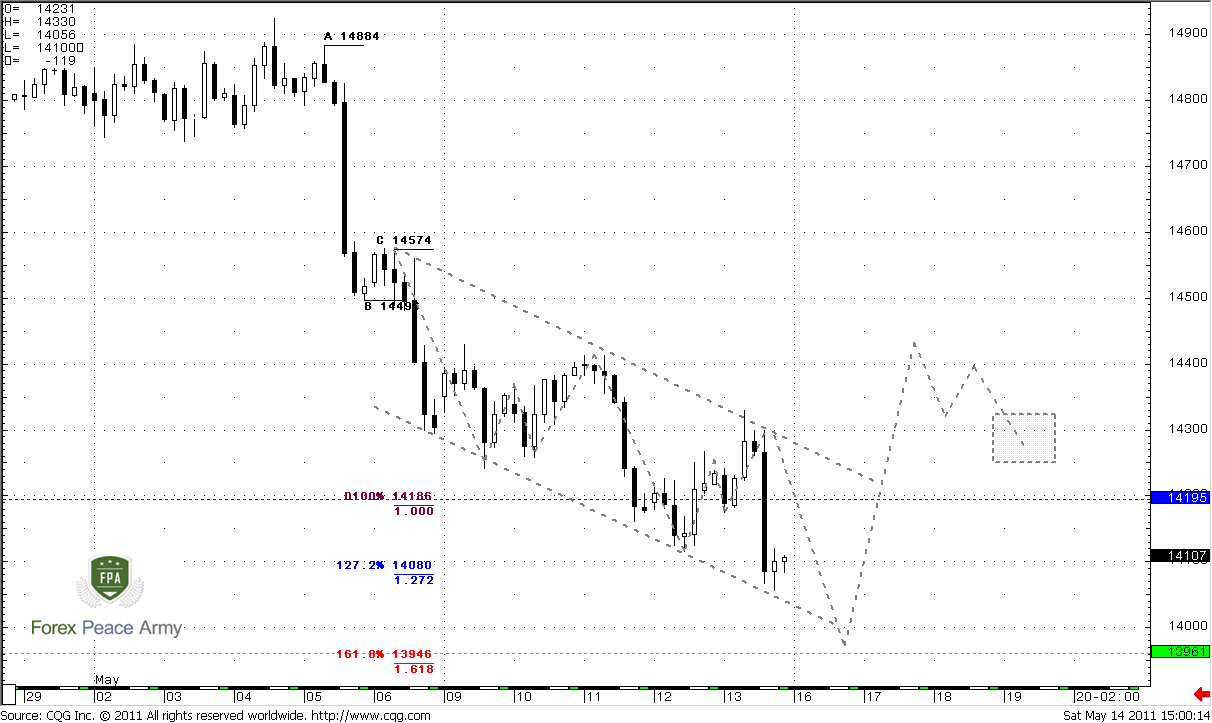
On the chart#2 I show you in simplified form, what we want to see, when B&B will start. Very often when market move out from channel it does it with Gartley “222” pattern. First we want to see how it hits 1.618 target, then – breakout form channel, and then AB-CD retracement to some Fib support, where we should enter long. It’s preferably, if market simultaneously will be above pivot point.
Anyway, we have to see the shift in intraday momentum. Usually it looks like strong intraday thrust up after solid plunge down. And up thrust should have greater length than previous down move. But this is just an assumption; let’s see how it will develop in reality.
#1
#2
Conclusion:
Position traders:
No signs to buy yet. Wait for clear signals on daily time frame.
Intraday traders:
There is a bearish context. Probably market will reach 1.3950 area before any pullback could start. Anyway, we need some turning in intraday momentum, prior to even think about long positions.
The technical portion of Sive's analysis owes a great deal to Joe DiNapoli's methods, and uses a number of Joe's proprietary indicators. Please note that Sive's analysis is his own view of the market and is not endorsed by Joe DiNapoli or any related companies.
So, guys, here you can see all importance of monthly overbought. Finally market has fallen into retracement that was awaited by positional traders and shown solid plunge.
As we said during the previous week - the first area to watch is 1.4140 – previous highs and nearest Fib support – market has hit it. Overall current look is frightening. If market will close as it is – it will turn to huge bearish engulfing pattern. Although we can’t exclude that it could be canceled by the market but more probable seems the perspective of continuation at least till monthly Confluence support at 1.3655-1.3760. This possibility also implicitly confirms with market overbought. Usual retracement target during overbought is zero point of Detrended Oscillator and this level stands around monthly Confluence support. Also its worth to note here that trend will remain bullish, even if market will reach 1.37 area. Still, if market will hold on first Fib support, this will be much better for current bullish bias and Butterfly pattern.
Nearest target stands at 1.5272, but potentially it could turn to butterfly “Sell” pattern. The target of this pattern is 1.27 extension at 1.6027. Also it almost coincides with 1.27 target of recent bullish AB-CD at 1.5925.
Weekly
This time frame is especially interesting on coming week. Our expectations are linked to potential B&B “Buy” trade due to previous upside momentum. So, market usually tries to continue previous move mechanically, i.e. because of momentum. This very often leads to deep retracement up right after initial plunge. That’s what we waiting for. But this retracement usually starts from some solid support and not later than 1-3 closes below 3x3 SMA (chart #2). Speaking about the levels - there are just two that are suitable for that purpose – market has reached first one 1.4140. Second one – is weekly Confluence support at 1.3655-1.3760. Now market has shown two closes below green line already. And speaking from purity view of B&B “Buy” trade – I prefer to see its start from current support. 1.4140 is also a previous highs.
Second important moment is that weekly trend has turned bearish. This fact forces us to be extra careful. Because when MACDP (red line) comes in play, the development during coming week could be twofold – market could show solid up move and form MACDP failure, i.e. trend shifting failure pattern. This will mean that we can count on taking out of previous highs and continuation of previous move up in terms of monthly Butterfly etc. The fact that market has closed slightly below 1.4140 has not canceled this level yet. Because this is weekly Fib support and this is more an area rather than sharp level. Second – if market will continue move down, then probably we will see 1.37 area.
We should get some answer in the beginning of the week by keeping a close eye on daily time frame and pivot points trading.
#1
#2
Daily
There is only one important issue for daily time frame since previous week. If you trade on daily time frame, now you have bearish context, because weekly trend has turned bearish and daily trend is bearish. Hence you have to look for possibility to enter short.
Speaking about overall picture – I do not see any interesting currently. Colored lines are weekly pivots. Market is not at oversold, which is 1.3880 for Monday. That’s why price could not show solid retracement in the beginning of the week. Usually in such circumstances market retraces to Pivot resistance 1 at 1.4335 that stands almost in one point with first Fib resistance 1.4388, 0.618 Fib resistance stabds at 1.4593 that coincides with daily overbought. That’s important.
4-hour
On this time frame now we clearly see that market has turned to parallel channel and gradually accomplished 3 from 4 potential targets. Hence, the next area to watch for is 1.3940-1.3960. This is pivot support 1 and 1.618 target from the same ABCD pattern. If we take a close look at price action inside channel that we’ll see that this is “plunge then AB-CD retracement.” This has repeated twice already. Just above the market I’ve pointed potential resistance levels. Taking into consideration that market is not at oversold on daily, then possibly it will be just AB-CD retracement to pivot point at 1.4195 that is also a 4-hour Confluence resistance 1.4192-1.4206. The potential target of weekly B&B is we assume that it starts right now will be 1.4593 – 0.618 resistance from whole move down. But this is just for information, so you could estimate it by yourself.
So, if you’re scalp trader, you may try to enter short from pivot with stop above next Confluence 1.4254-1.4277 with target 1.3950.
On the chart#2 I show you in simplified form, what we want to see, when B&B will start. Very often when market move out from channel it does it with Gartley “222” pattern. First we want to see how it hits 1.618 target, then – breakout form channel, and then AB-CD retracement to some Fib support, where we should enter long. It’s preferably, if market simultaneously will be above pivot point.
Anyway, we have to see the shift in intraday momentum. Usually it looks like strong intraday thrust up after solid plunge down. And up thrust should have greater length than previous down move. But this is just an assumption; let’s see how it will develop in reality.
#1
#2
Conclusion:
Position traders:
No signs to buy yet. Wait for clear signals on daily time frame.
Intraday traders:
There is a bearish context. Probably market will reach 1.3950 area before any pullback could start. Anyway, we need some turning in intraday momentum, prior to even think about long positions.
The technical portion of Sive's analysis owes a great deal to Joe DiNapoli's methods, and uses a number of Joe's proprietary indicators. Please note that Sive's analysis is his own view of the market and is not endorsed by Joe DiNapoli or any related companies.
 shoot us up into the promised land...