Sive Morten
Special Consultant to the FPA
- Messages
- 18,644
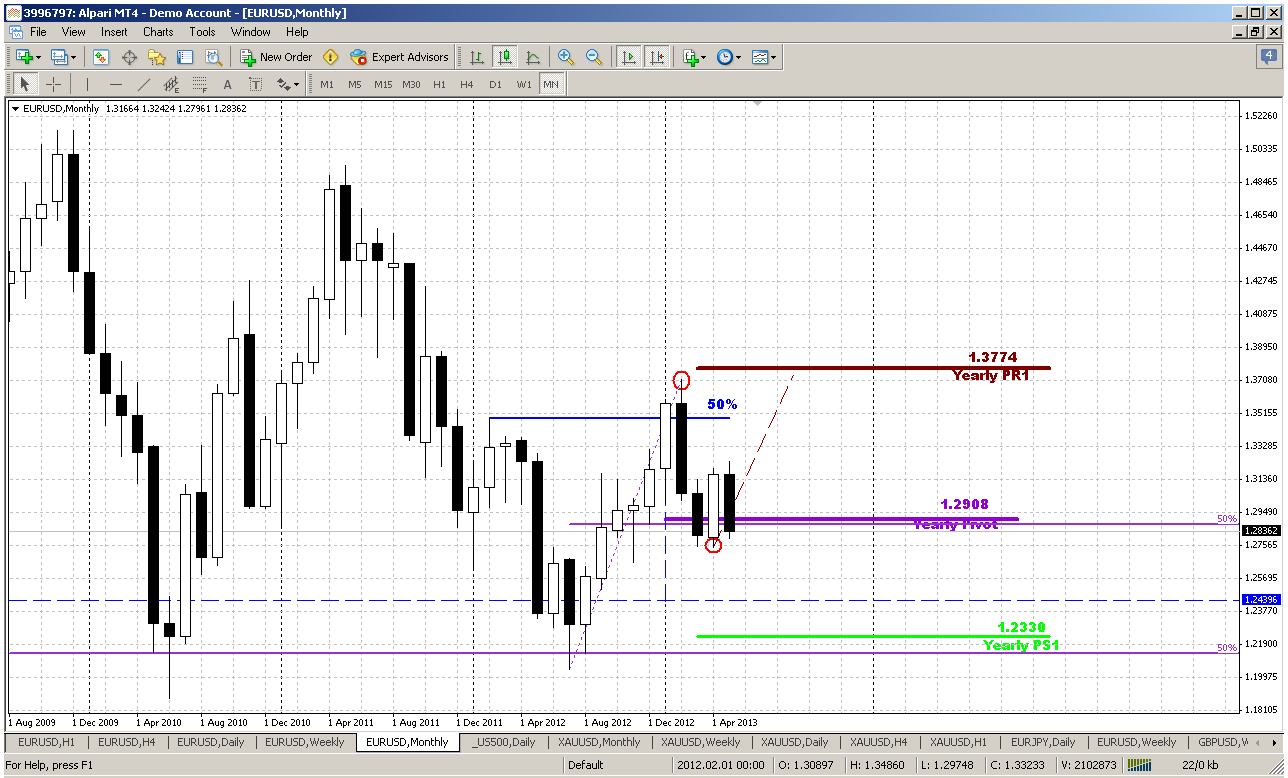
Monthly
Here is what we have discussed within previous couple of weeks – contradiciton among engulfing patterns:
“On big picture since April bar has closed we have some changes, althgough they are not drastical. Market stands now in some kind of equilibrium or indecision. Two months earlier we’ve got bearish engulfing pattern right at 50% resistance, and theoretically it has target around 1.2450 area and it is still valid. But now we’ve got another one – oposite to the previous one. This pattern coincides with two other rather significant bullish moments. First is trend – it is bullish now, and Yearly Pivot point – market has tested it and now holds above it. This is long-term bullish sign. If we suggest even minor upward extension to 0.618 of current AB-CD pattern we will get 1.3775 level – and that is Yearly Pivot Resistance 1.
On previous week we’ve decided to deal with bullish engulfing pattern, since it has a smaller scale and more suitable for day-by-day trading. On past week there were some significant changes on lower time frame, that increase probability of bullish engulfing failure. Theoretically it has not happened yet, since invalidation point of this pattern is low at 1.2746, but moves that we see on lower time frames make this pattern not very attractive for trading. Thus, we should keep an eye on its low, but mostly for getting final confirmation of bulls’ capitulation, rather than signal for short entry, because foundation for downward action already was put on probably on lower time frame”.
Although theoretically bullish engulfing pattern still holds, but market has made another step in direction of it’s failure and price stands almost right at the low of this pattern. Price has returned right below yearly pivot again. You can imagine how important current level is. Market, in fact, stands at the edge that will determine long-term perspective of EUR/USD. Even minor target stands at 1.2330-1.24 and what if we will take into consideration current downward AB-CD? It will lead at minimum to 1.1850. Recall also, that our super long analysis (that we’ve made in Nov 2011) tells us about minimum target at 1.16... So, it looks like really big events are ahead. Summer can postpone them a bit, but it looks like that market can turn to more active motion in nearest months.
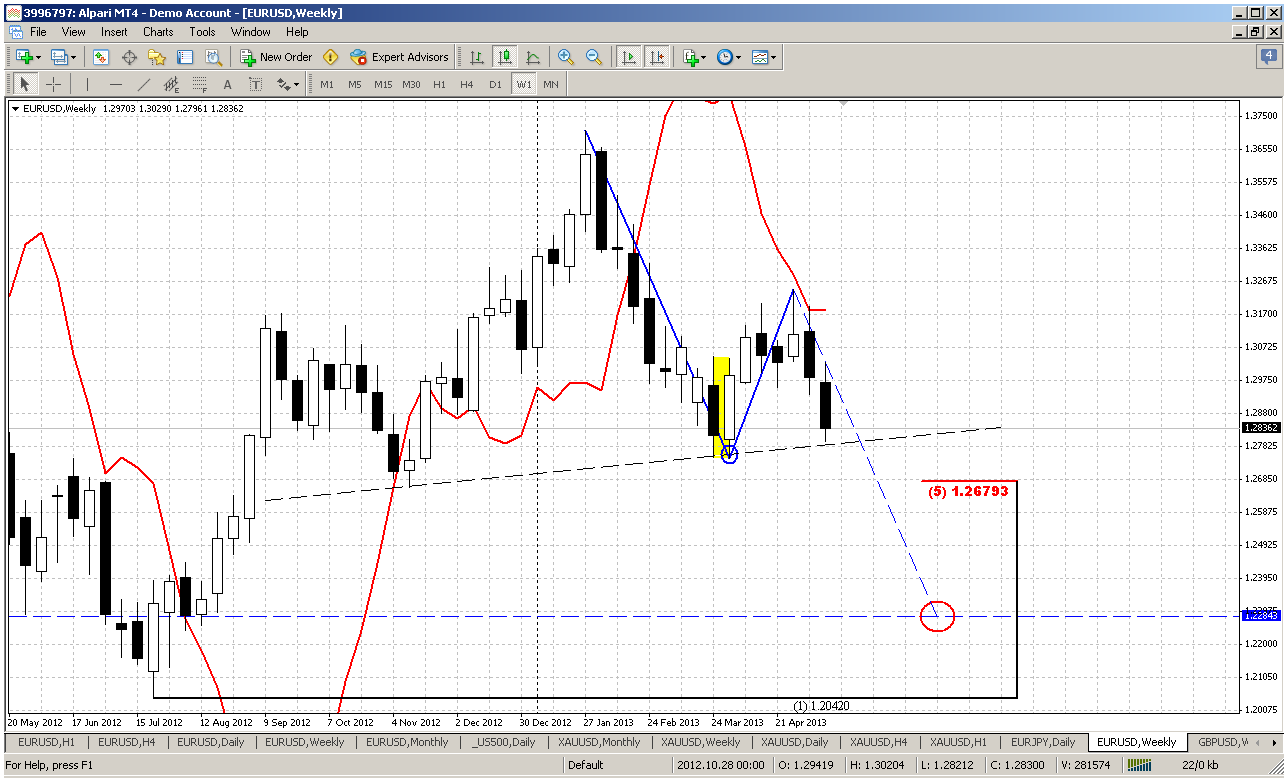
Weekly
On previous week this time frame was our foundation for trading and it has worked nice. Price now is showing action that absolutely coincides with our expectations. As stop grabber pattern aproaches to it’s target we probably can gradually shift our attention from it in favor of larger H&S pattern. This pattern holds very well also – very good harmony among the shoulders as in price terms as in time. If this pattern will work – it will lead us to 1.23 area, that is also yearly pivot support 1 and last stand for the bulls – you’ll see this easily if take a bit extended view on monthly chart. All swing lows stand around 1.2150-1.2350 – that is all time 50% support level.
Market is not at oversold, but it stands at neck line and this area is also MPS1. That’s why in the beginnig of the week I can’t exclude some bounce up, that could take a shape of upper shadow by the close of coming week. 5/8 support hardly will hold market since as stops will be triggered it will give price downward acceleration and it in fact can pass through this support very fast. So weekly chart gives us nice bearish context for another week.
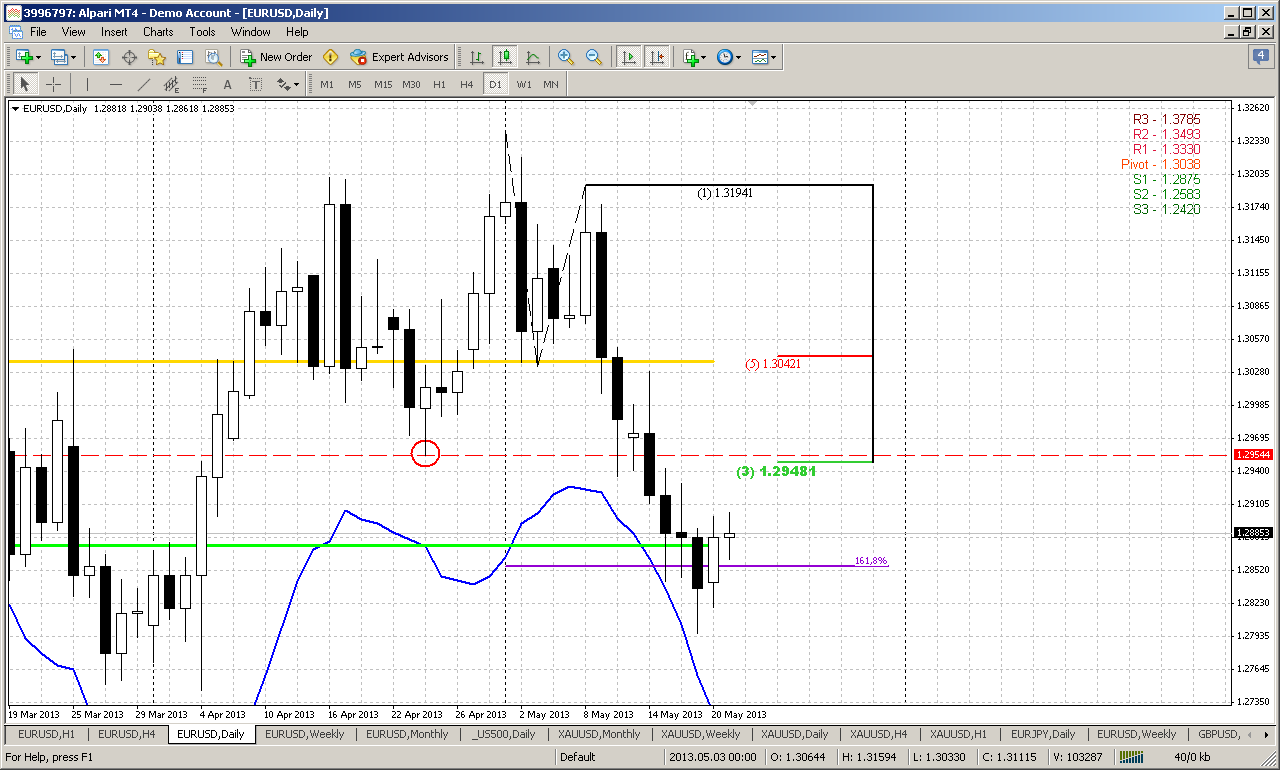
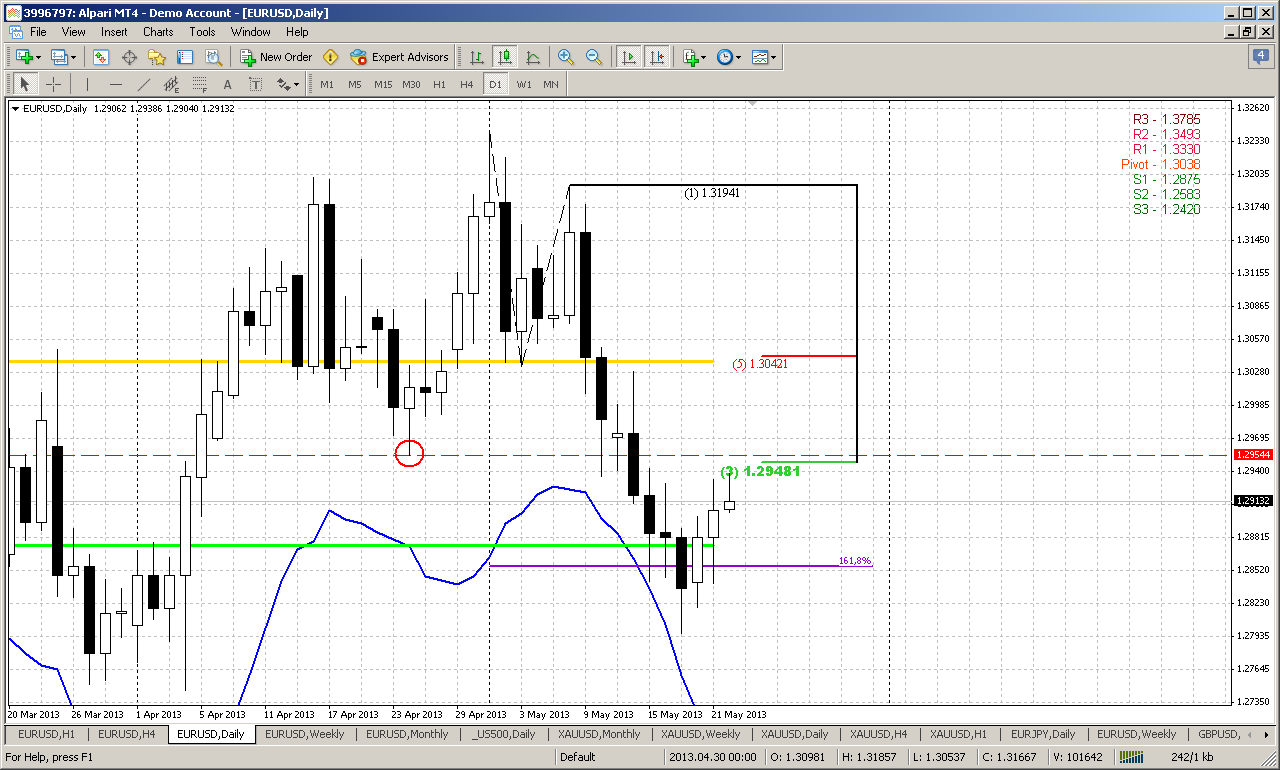
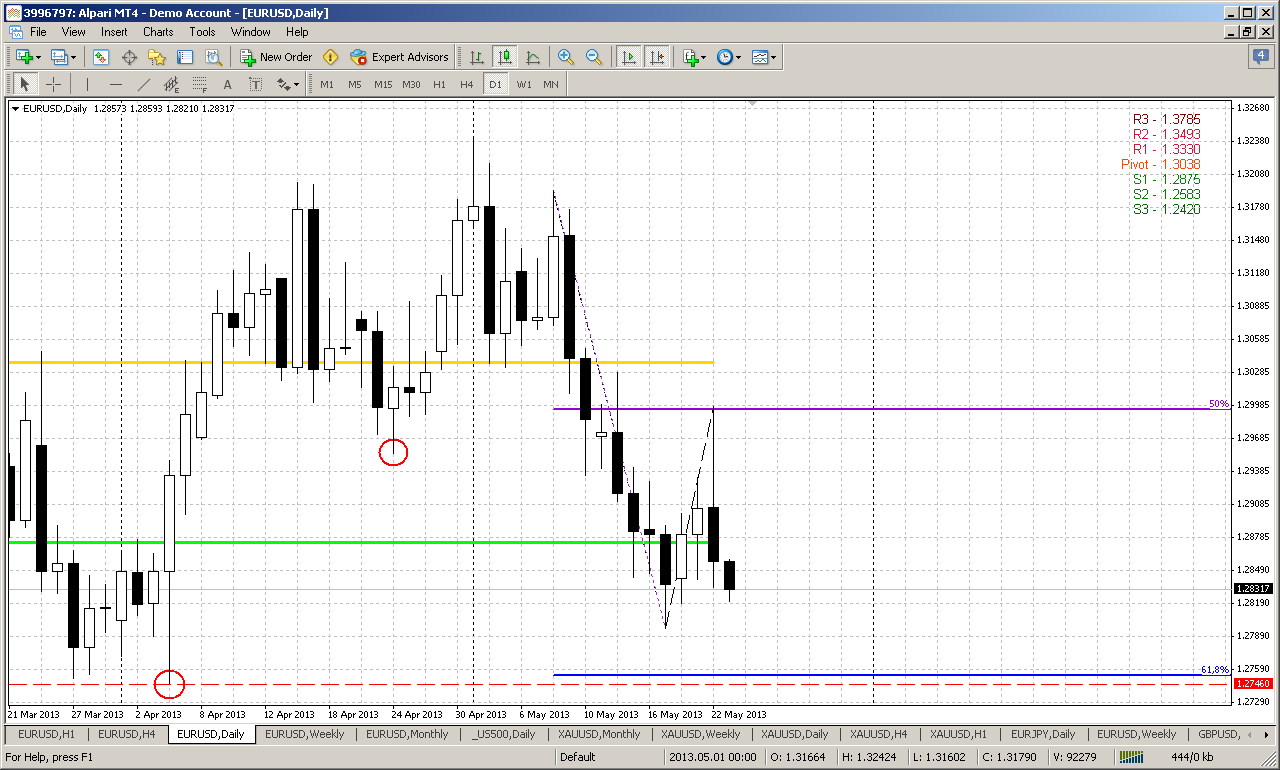
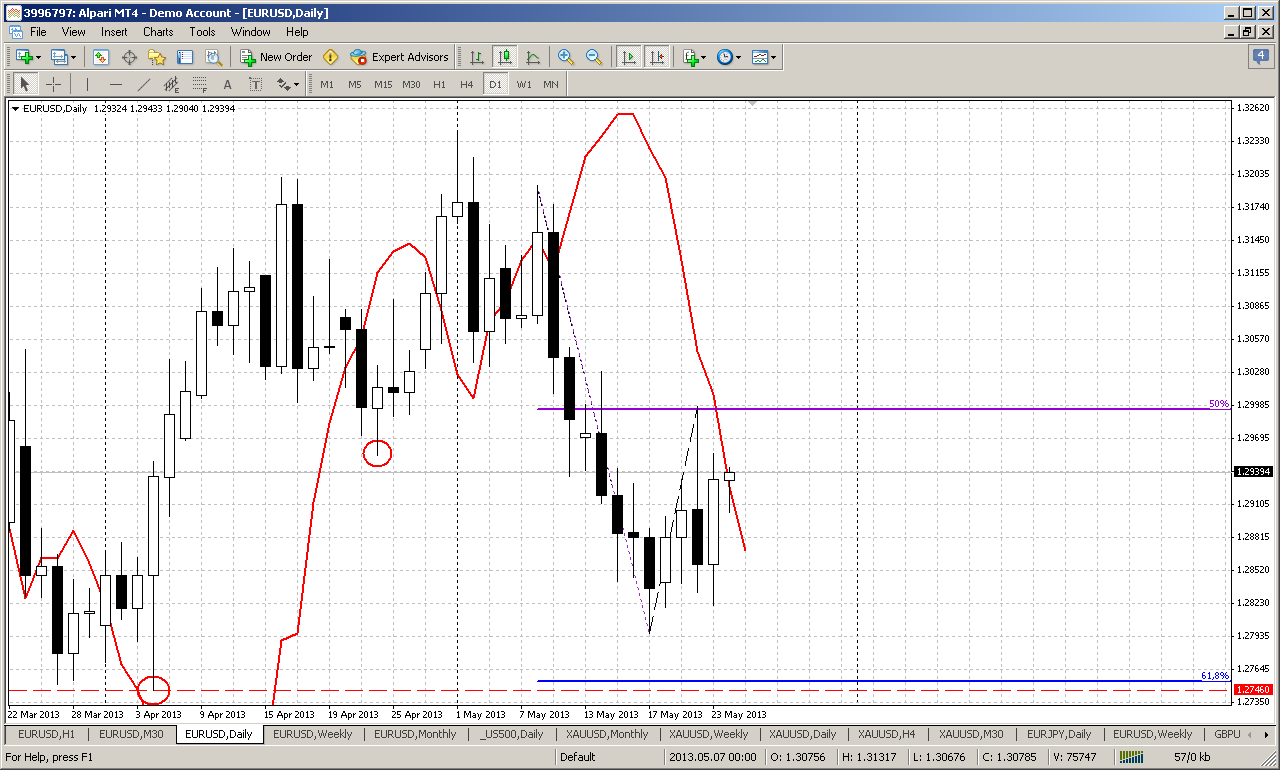
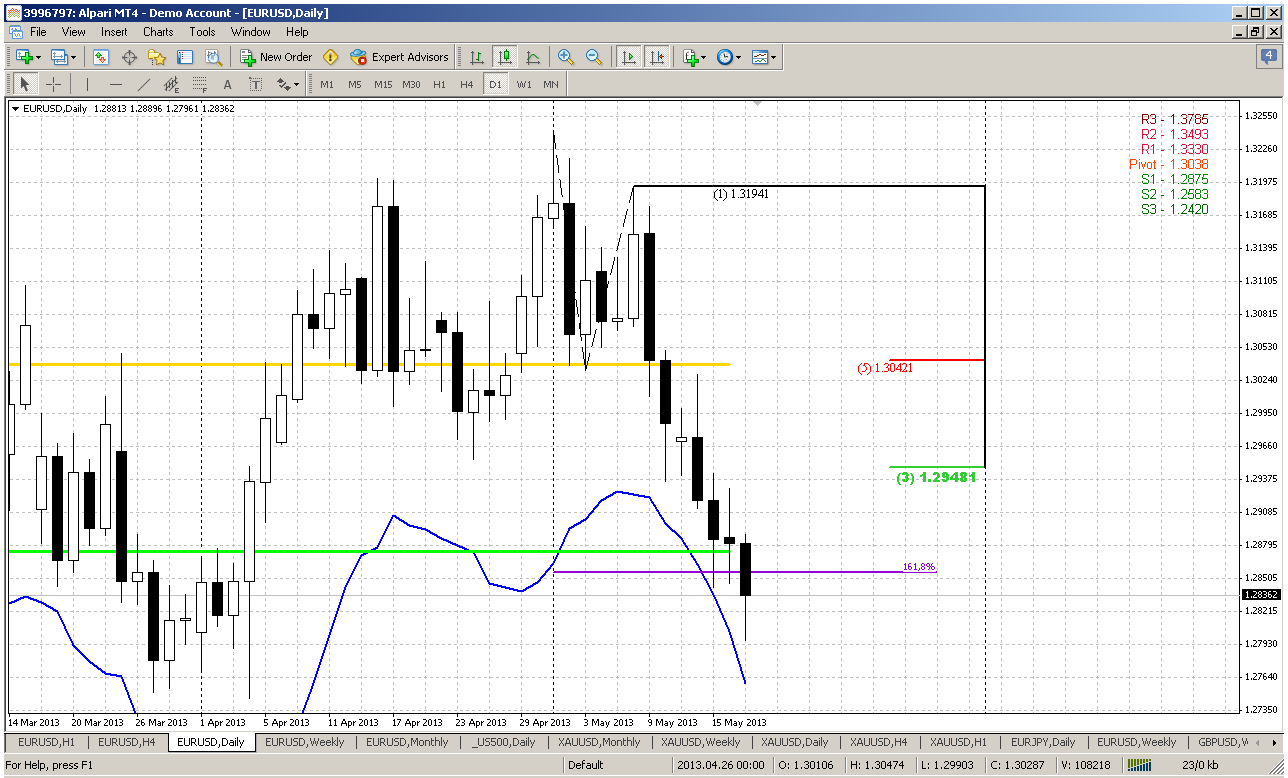
Daily
Daily time frame, oppositely to weekly one carries not much information. Actually I a bit surprised by deep piercing of solid support. On daily market in fact shows no respect currently of this level, but price stands solidly below as MPS1, as 1.618 extension of AB-CD pattern and hit oversold again. Market still cling to this support and bounce us is still possible, but such deep move below support level in fact also could be a breakout. Other words, market now stands at some kind of semi-position, and it could be as bounce to come as breakout already. Actually 1-2 bars down more and this will be suitable thrust for DRPO or B&B directional signals. Since market already stands at neckline of weekly H&S pattern it has small space for maneuver – either breakout or small bounce.
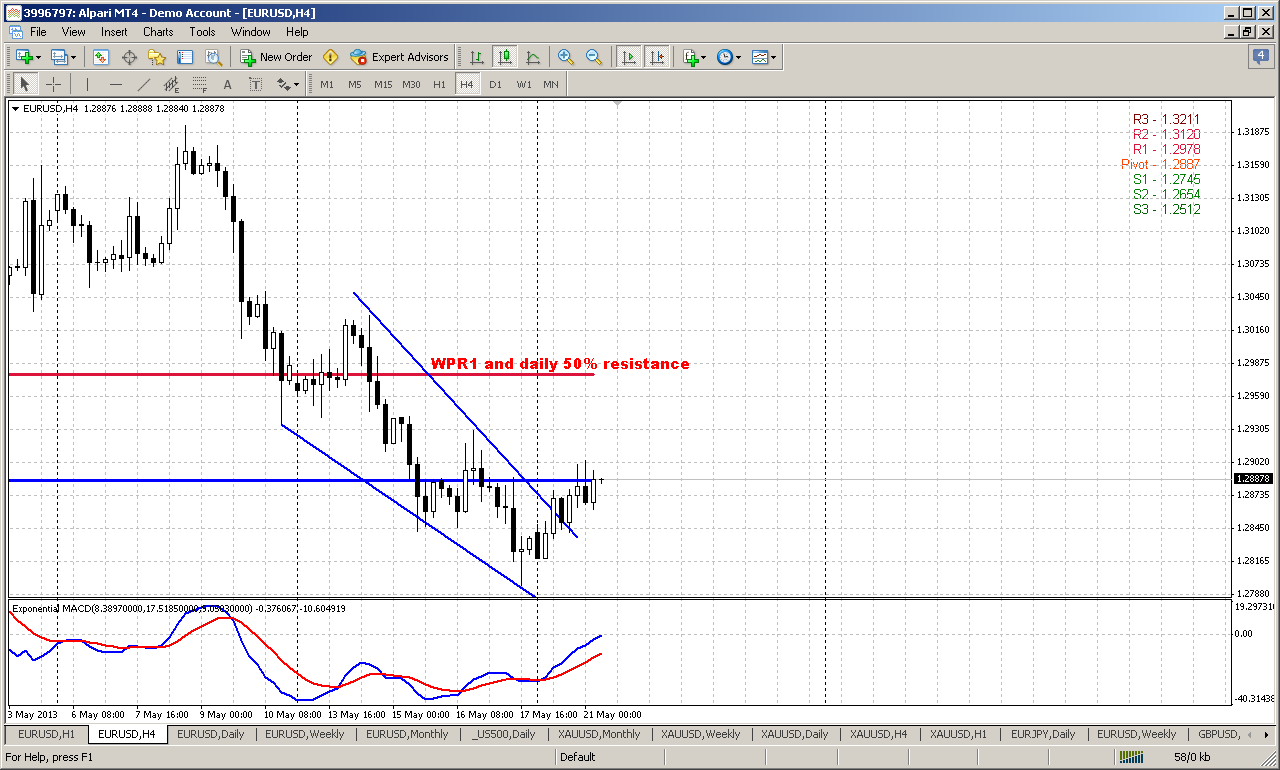
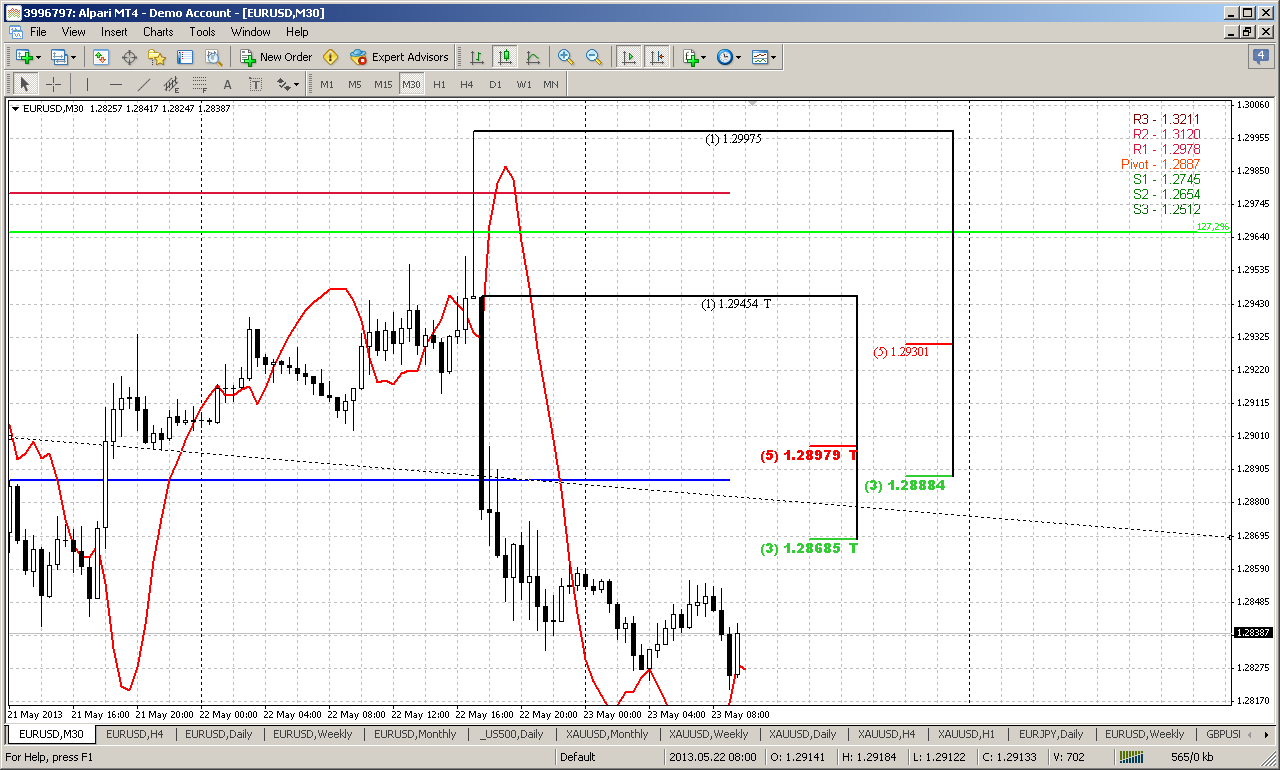
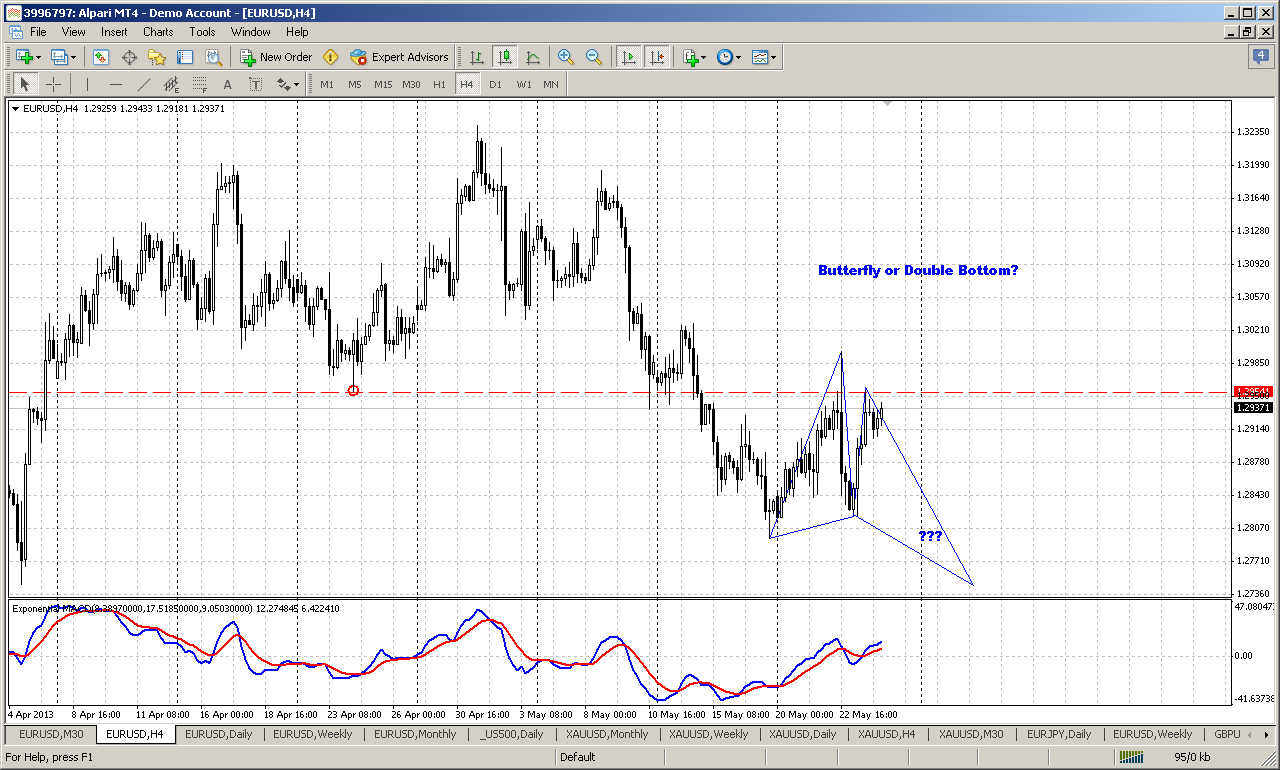
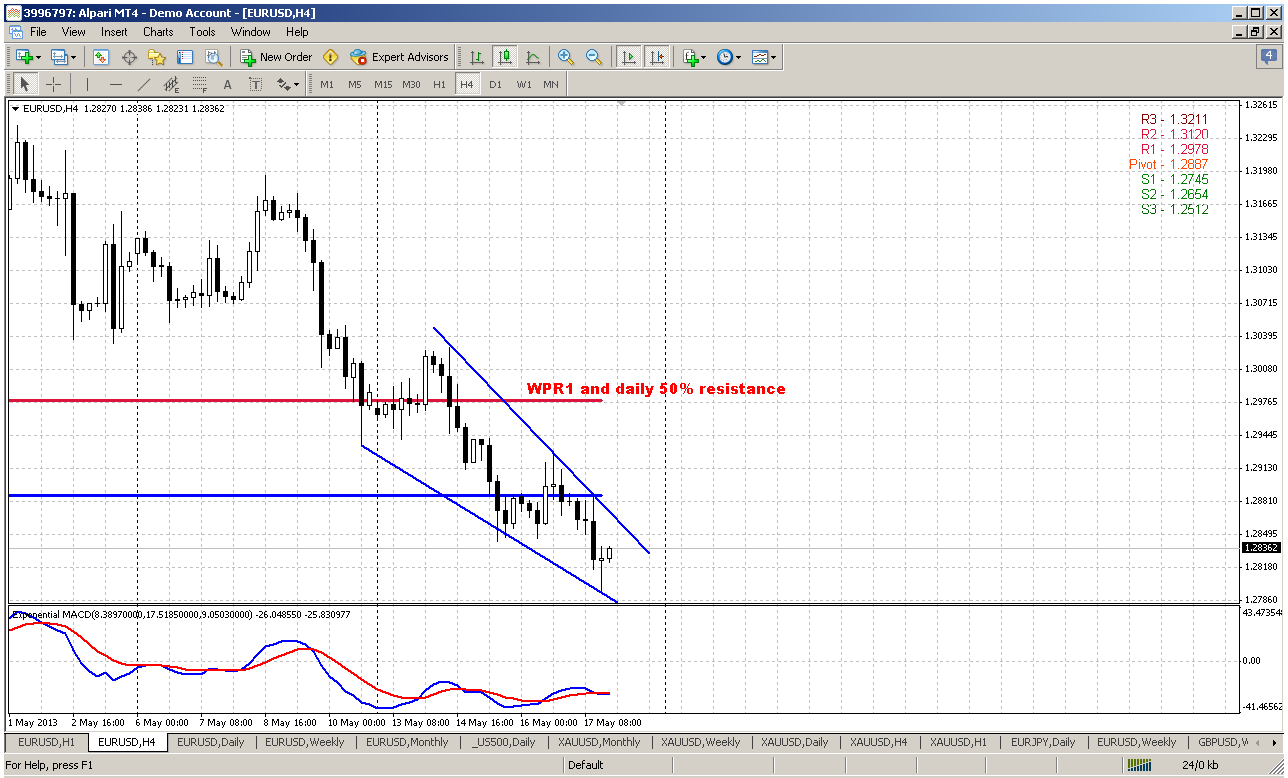
4-hour
Here we see some signs of exhausting, that is very typical for the beginning of retracement. Right around strong daily support level we have bullish wedge accompanied by divergence. If this wedge will work we probably can count on bounce above 1.2920 and most probable destination point is (as usual) 50% daily resistance that is also WPR1 on coming week.
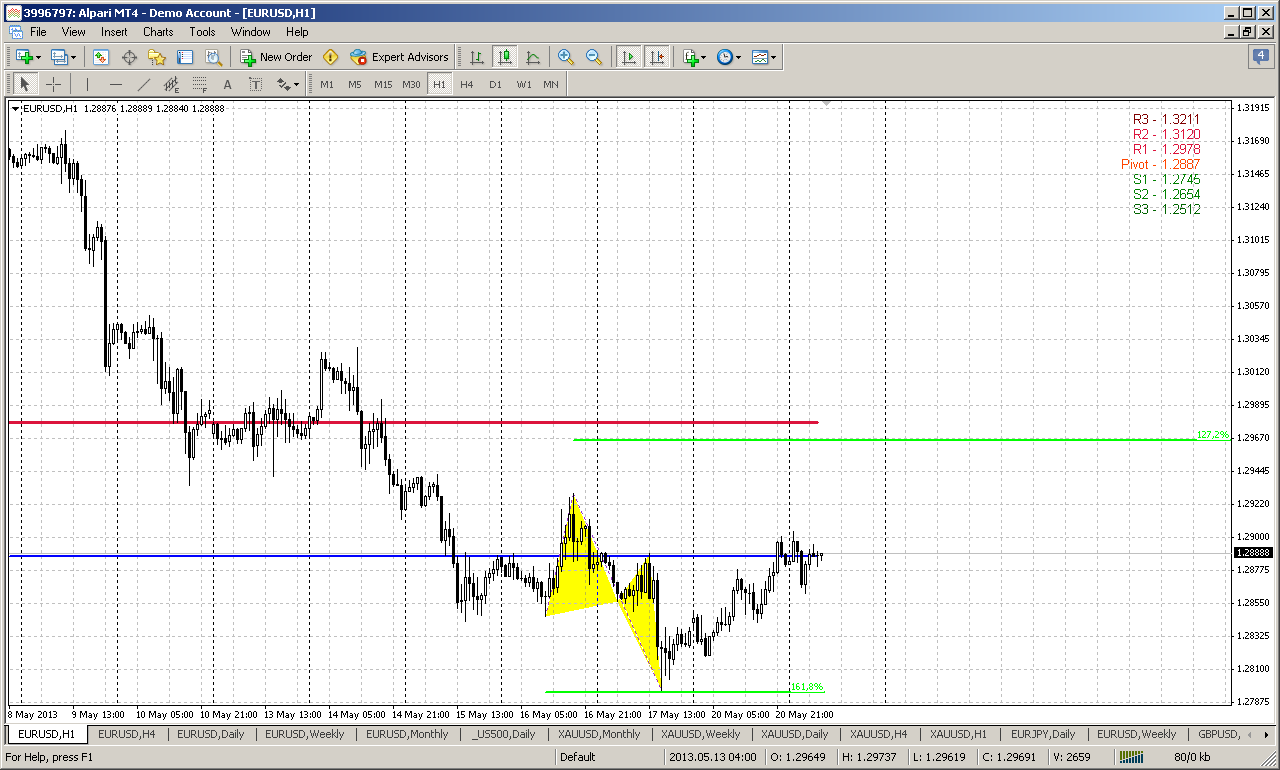
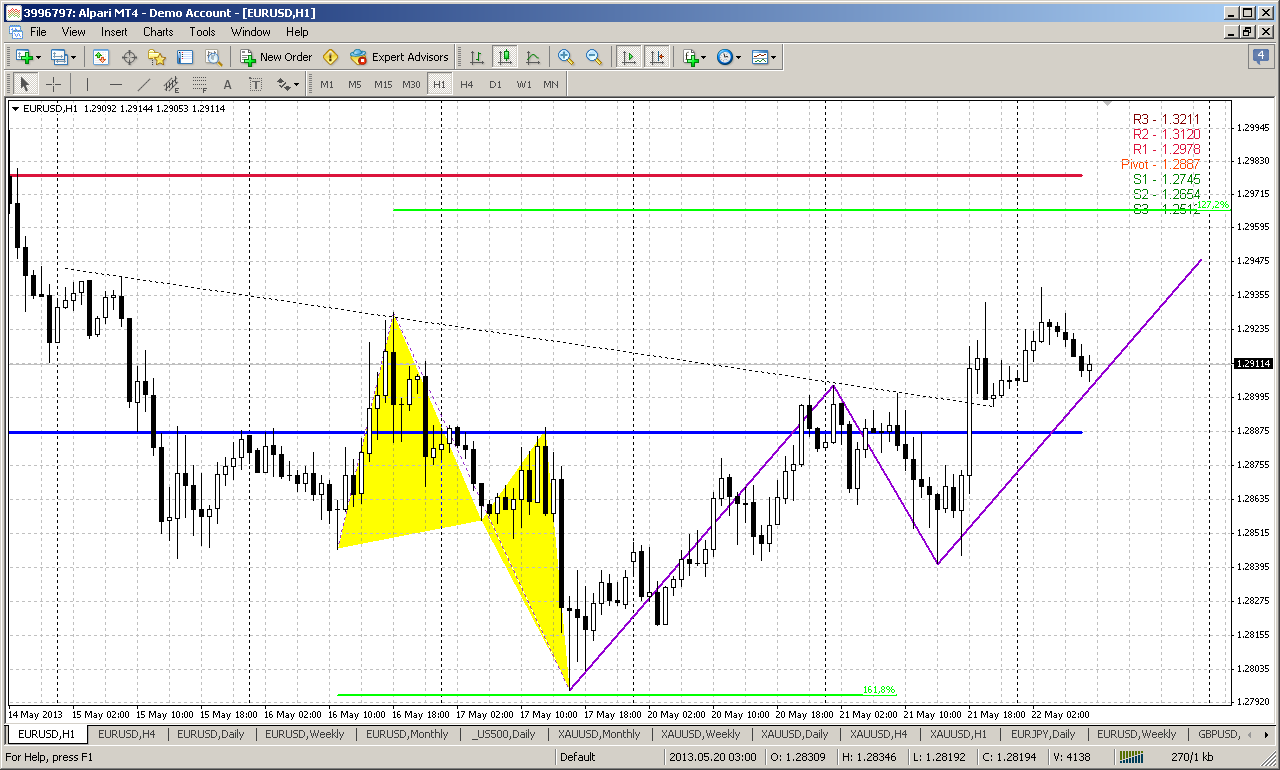
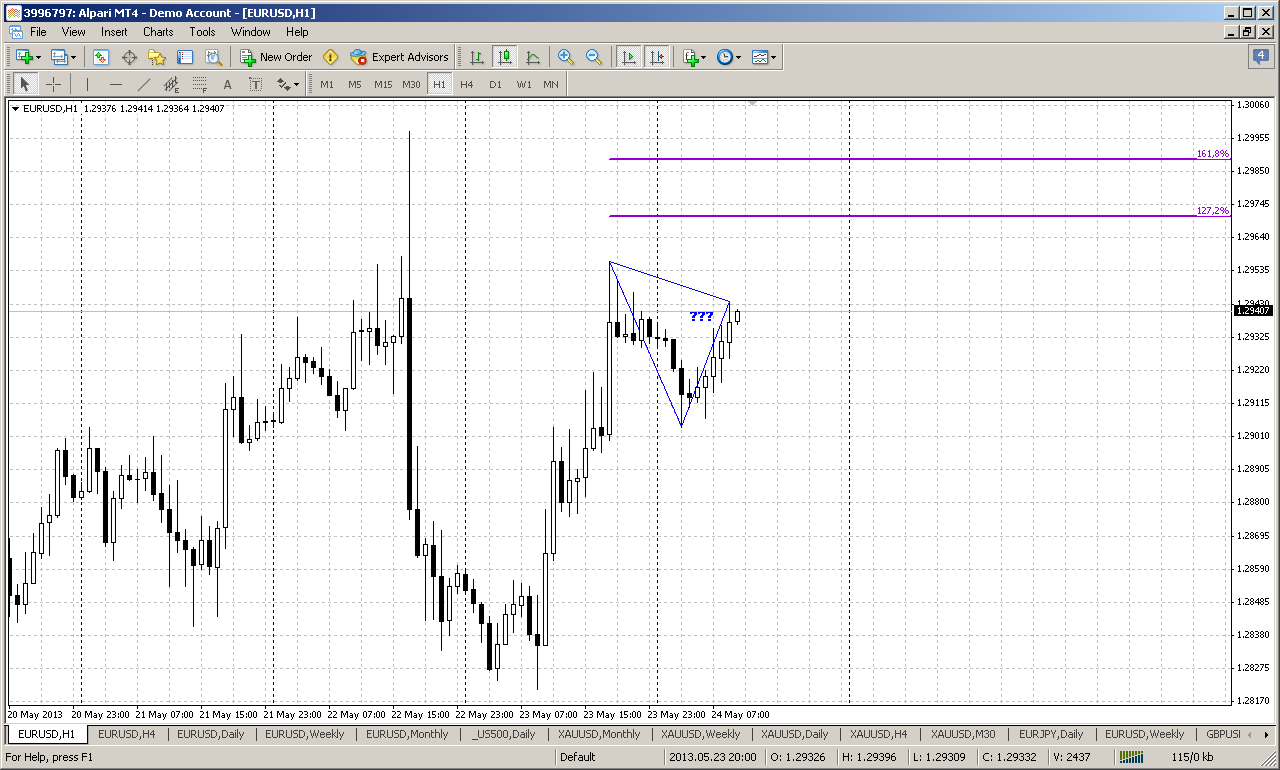
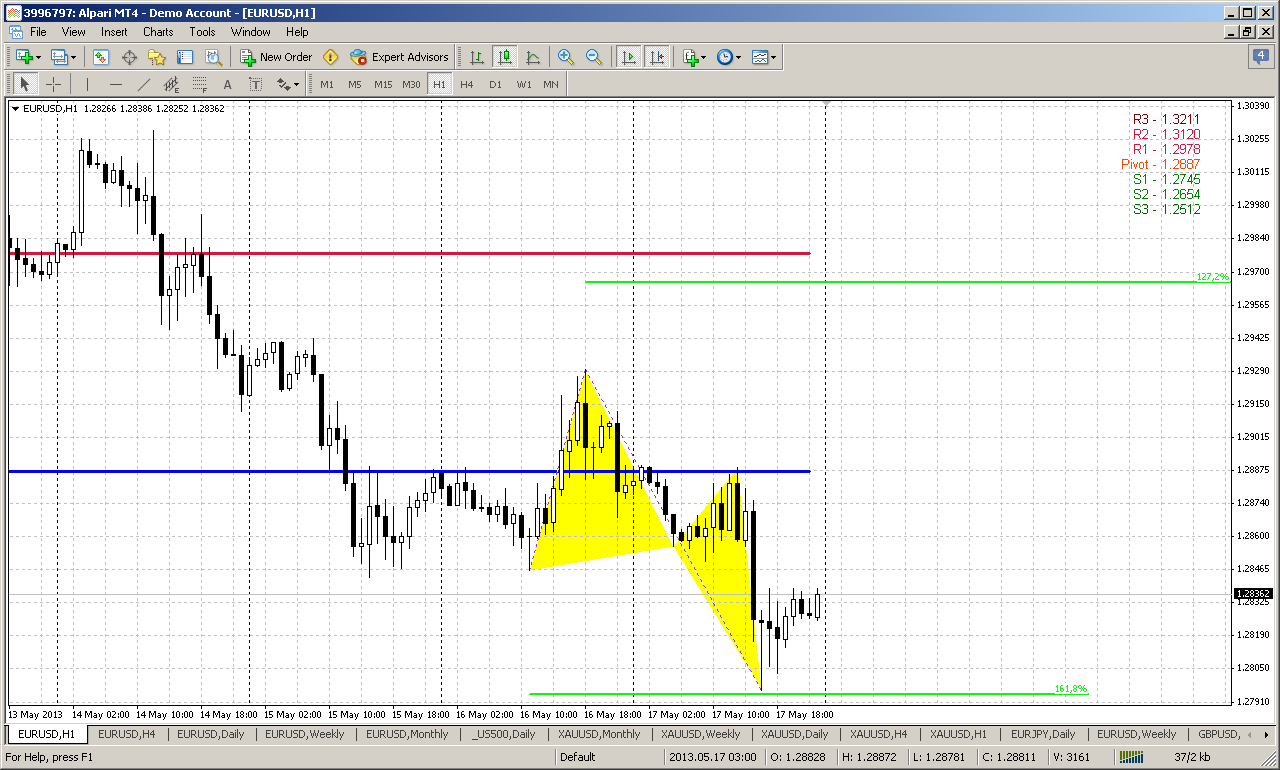
60-min
Here is another one – butterfly “Buy” as a final pattern of the wedge, that happens rather often. If upward action will still happen, then ultimate target of butterfly stands very close to WPR1 and daily 50% resistance, by the way... Since market stands right at the peak of the wedge, we just need to wait how it will response on all these reversal patterns.
Conclusion:
In the medium-term perspective we still have bearish context. Patterns that now are forming on weekly time frame could become the triggering ones for long-term down trend.
Although market significantly pierced daily support level, currently some reversal patterns are forming, thus some bounce up is still possible, at least until market will not erase these patterns. Since usually WPR1 holds upward retracement, when market stands with bear trend – it could become possible destination point of retracement. This is also 50% daily resistance level.
The technical portion of Sive's analysis owes a great deal to Joe DiNapoli's methods, and uses a number of Joe's proprietary indicators. Please note that Sive's analysis is his own view of the market and is not endorsed by Joe DiNapoli or any related companies.
Here is what we have discussed within previous couple of weeks – contradiciton among engulfing patterns:
“On big picture since April bar has closed we have some changes, althgough they are not drastical. Market stands now in some kind of equilibrium or indecision. Two months earlier we’ve got bearish engulfing pattern right at 50% resistance, and theoretically it has target around 1.2450 area and it is still valid. But now we’ve got another one – oposite to the previous one. This pattern coincides with two other rather significant bullish moments. First is trend – it is bullish now, and Yearly Pivot point – market has tested it and now holds above it. This is long-term bullish sign. If we suggest even minor upward extension to 0.618 of current AB-CD pattern we will get 1.3775 level – and that is Yearly Pivot Resistance 1.
On previous week we’ve decided to deal with bullish engulfing pattern, since it has a smaller scale and more suitable for day-by-day trading. On past week there were some significant changes on lower time frame, that increase probability of bullish engulfing failure. Theoretically it has not happened yet, since invalidation point of this pattern is low at 1.2746, but moves that we see on lower time frames make this pattern not very attractive for trading. Thus, we should keep an eye on its low, but mostly for getting final confirmation of bulls’ capitulation, rather than signal for short entry, because foundation for downward action already was put on probably on lower time frame”.
Although theoretically bullish engulfing pattern still holds, but market has made another step in direction of it’s failure and price stands almost right at the low of this pattern. Price has returned right below yearly pivot again. You can imagine how important current level is. Market, in fact, stands at the edge that will determine long-term perspective of EUR/USD. Even minor target stands at 1.2330-1.24 and what if we will take into consideration current downward AB-CD? It will lead at minimum to 1.1850. Recall also, that our super long analysis (that we’ve made in Nov 2011) tells us about minimum target at 1.16... So, it looks like really big events are ahead. Summer can postpone them a bit, but it looks like that market can turn to more active motion in nearest months.
Weekly
On previous week this time frame was our foundation for trading and it has worked nice. Price now is showing action that absolutely coincides with our expectations. As stop grabber pattern aproaches to it’s target we probably can gradually shift our attention from it in favor of larger H&S pattern. This pattern holds very well also – very good harmony among the shoulders as in price terms as in time. If this pattern will work – it will lead us to 1.23 area, that is also yearly pivot support 1 and last stand for the bulls – you’ll see this easily if take a bit extended view on monthly chart. All swing lows stand around 1.2150-1.2350 – that is all time 50% support level.
Market is not at oversold, but it stands at neck line and this area is also MPS1. That’s why in the beginnig of the week I can’t exclude some bounce up, that could take a shape of upper shadow by the close of coming week. 5/8 support hardly will hold market since as stops will be triggered it will give price downward acceleration and it in fact can pass through this support very fast. So weekly chart gives us nice bearish context for another week.
Daily
Daily time frame, oppositely to weekly one carries not much information. Actually I a bit surprised by deep piercing of solid support. On daily market in fact shows no respect currently of this level, but price stands solidly below as MPS1, as 1.618 extension of AB-CD pattern and hit oversold again. Market still cling to this support and bounce us is still possible, but such deep move below support level in fact also could be a breakout. Other words, market now stands at some kind of semi-position, and it could be as bounce to come as breakout already. Actually 1-2 bars down more and this will be suitable thrust for DRPO or B&B directional signals. Since market already stands at neckline of weekly H&S pattern it has small space for maneuver – either breakout or small bounce.
4-hour
Here we see some signs of exhausting, that is very typical for the beginning of retracement. Right around strong daily support level we have bullish wedge accompanied by divergence. If this wedge will work we probably can count on bounce above 1.2920 and most probable destination point is (as usual) 50% daily resistance that is also WPR1 on coming week.
60-min
Here is another one – butterfly “Buy” as a final pattern of the wedge, that happens rather often. If upward action will still happen, then ultimate target of butterfly stands very close to WPR1 and daily 50% resistance, by the way... Since market stands right at the peak of the wedge, we just need to wait how it will response on all these reversal patterns.
Conclusion:
In the medium-term perspective we still have bearish context. Patterns that now are forming on weekly time frame could become the triggering ones for long-term down trend.
Although market significantly pierced daily support level, currently some reversal patterns are forming, thus some bounce up is still possible, at least until market will not erase these patterns. Since usually WPR1 holds upward retracement, when market stands with bear trend – it could become possible destination point of retracement. This is also 50% daily resistance level.
The technical portion of Sive's analysis owes a great deal to Joe DiNapoli's methods, and uses a number of Joe's proprietary indicators. Please note that Sive's analysis is his own view of the market and is not endorsed by Joe DiNapoli or any related companies.
Last edited: