Sive Morten
Special Consultant to the FPA
- Messages
- 18,648
Fundamentals
Despite that we've got some important data this week, such as US Retail Sales, China economy growth, unemployment statistics etc., but, no doubts debt ceil and Friday's J Powell and J. Yellen speeches have become the major events of this week. Despite that debt ceil already increased circa 70 times, current case is unique. It was never so strong confrontation in US political elite and never so big bets were on the table. Debt default is unique chance, controlled financial events of 9/11 scale that could be used for big political shifts. That's why this time it might be going different.
Market overview
First of all, we would like to focus on too strong market confident about coming Fed easing policy. We suggest that market strongly underestimate chances for more rate hikes through this year. As well as more extended period when rate will be frozen around the high level. U.S. central bankers on Monday signaled they see interest rates staying high and, if anything, going higher, given inflation that may be slow to improve and an economy showing only tentative signs of weakness.
In interviews and media appearances, four regional U.S. central bank presidents began disentangling the data and risks that will feed into a June 13-14 decision about whether to raise interest rates for an 11th consecutive time or pause the tightening cycle. Investors are betting heavily that the Fed's benchmark overnight interest rate will remain in the 5.00%-5.25% range set at the May 2-3 meeting, when policymakers opened the door to calling a halt to further increases in borrowing costs.
But Fed officials on Monday said the jury is very much out. Data since the last meeting showed a continued strong job market and little progress on the inflation front, even as risks from ongoing banking sector stress and a possible U.S. debit limit crisis argue for caution. Overall, policymakers said ensuring inflation returns to the Fed's 2% annual target remains the top priority.
We posted some speeches in our Telegram. Just to give you an example of Fed officials on Thursday pushed against a rate-hike pause next month, citing persistently high inflation - Dallas Fed President Lorie Logan on Thursday, for instance, said she is concerned that "much too high" inflation is not cooling fast enough to allow the Fed to pause its interest-rate hike campaign in June.
And this is not only in the US. The European Central Bank will hike its key interest rates by 25 basis points at each of the next two meetings, according to economists polled by Reuters, many of whom also said the bigger risk was rates could go higher still in the future.

The European Central Bank needs to keep interest rates high to curb inflation in the medium term, its president Christine Lagarde said on Friday, signalling more monetary tightening.
She said the ECB would pursue that goal even though the euro zone was in a "critical" moment with inflation going down, monetary tightening beginning to have an impact, and banks limiting credit.
According to Michael Hartnett of BofA, the biggest "sick deal" in the next 12 months will be to raise the Fed funds rate to 6% instead of falling to 3%. The Bank of America strategist reiterated his call to sell US equities, and rising bond yields pose a risk.
Besides, formally, The Fed has many reasons to be more optimistic about three-year growth: solid job growth continues to exceed forecasts, auto sales are at a nearly two-year high, new home sales were the highest in a year in March, and manufacturing is stabilizing. Although for the truth sake - the Fed's latest statement is like two peas in a pod similar to the statement in 2006, when the rate hike cycle ended. We will see. Fed has to force everybody to buy more bonds. They need to get constant demand on a new debt to finance rising government spending. But we will talk about this issue below.

After the release of data on unemployment claims and business activity from the Philadelphia Fed, the markets have changed their minds and are now again waiting for a rate hike in June - probability jumps to 40% from 10%. Thursday's reports showed lower-than-expected U.S. initial jobless claims of 242,000 in the latest week, compared with forecasts of 254,000.
Another piece of data indicated a milder-than-expected fall in the Philadelphia Federal Reserve's manufacturing index to -10.4 in May from -31.3 in April. Markets were forecasting a contraction of -19.8.
Now the probability drops to 17.4%.
Alvin Tan, head of Asia FX strategy at RBC Capital Markets, doubts the safe-haven argument of USD strength. If investors were worried, stocks would be falling, he said. In reality the S&P 500 has been flat since the middle of April and is up more than 8% this year.
Tan said concerns that the Fed has not yet slain inflation are part of the story. A University of Michigan survey released last week showed consumer inflation expectations rose to a five-year high of 3.2% in May, lifting bond yields and the dollar. Traders currently expect the U.S. central bank to cut interest rates sharply later this year as a recession takes hold, yet Tan is skeptical.
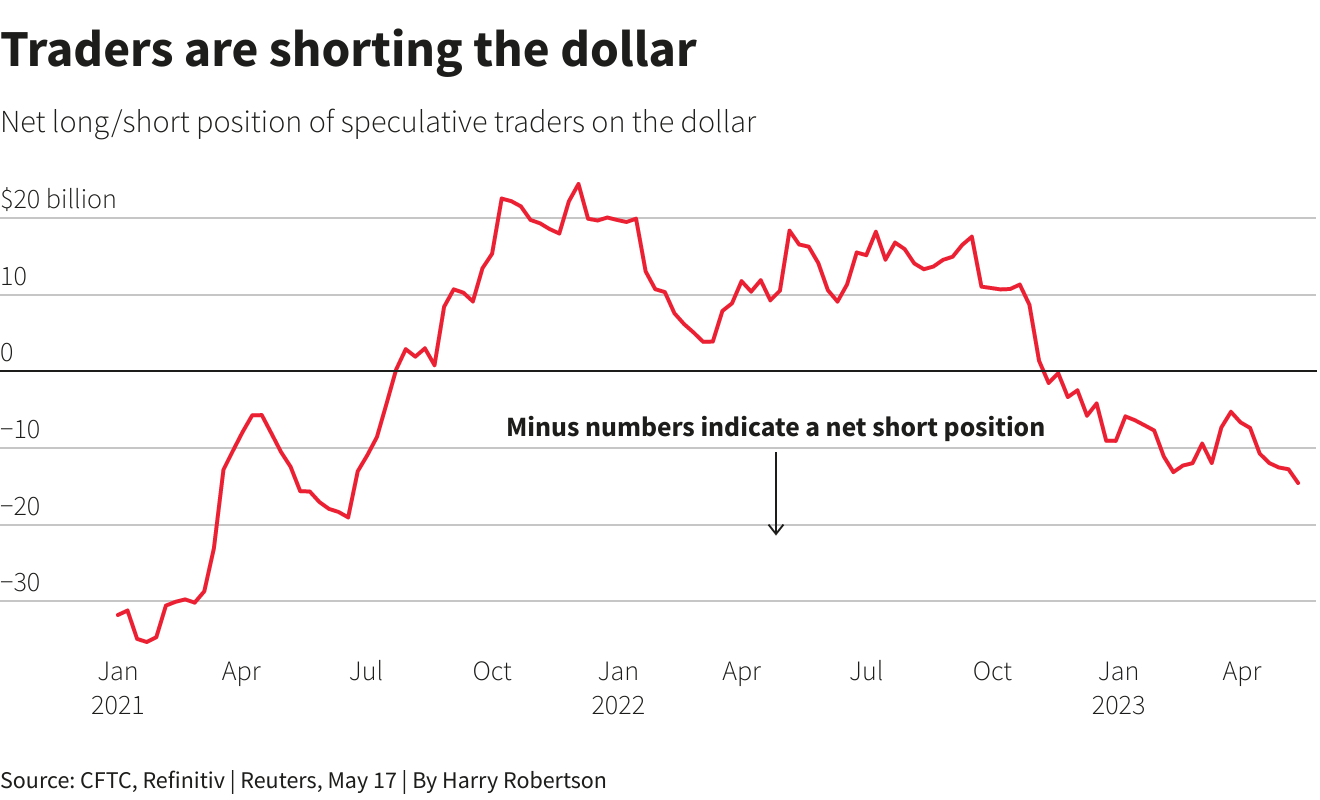
For other analysts, so-called technical factors are at play. Investors have mounted big bets against the dollar. The net short bets of hedge funds and other speculators amounted to $14.56 billion last week, data from the Commodity Futures Trading Commission shows, the biggest such position since mid-2021.
Counter-intuitively, that positioning can help drive rallies. If the dollar rises slightly, some traders may be forced to close out their short positions by buying the dollar, which then boosts its value.
Will the authorities force banks to buy more (government) bonds? Certainly - ECB is tightening its controls on commercial banks' liquidity buffers and may increase requirements on individual creditors later this year. And higher interest rates will have to serve to this purpose. So our view is market under-prices chances of rate hike in June and July. If we will be correct on this suggestion, US Dollar could show unexpected rally, blowing everything out of the way. Especially those, who already start taking strategical short positions.
And the Fed intends to do the same. Any "tightening" controls and higher safety margin ratios, applied to the banks unavoidably triggers demand for liquidity, since banks will have to hold more highly liquid reserves on the balance to match new central banks conditions.
US TREASURY ON FIRE
First is, let's start from our favorite chart - available US Treasury assets on Fed account. This week it hits lowest level since 2021:

The U.S. Treasury Department’s window to allow the U.S. government not to run out of borrowing capacity continues to shrink, with cash balances falling to their lowest level since 2021. The only joy is that there has been a slight increase in funds available for emergency measures.
As of May 17, the Treasury Department took emergency measures to enter the market and borrow $92 billion to help the government pay bills, the ministry said in a statement. That's up from the roughly $88 billion that was placed on May 10 and means that just over a quarter of the $333 billion is still available to keep the US government from running out of borrowing capacity under the statutory debt limit.
At the same time , the balance of funds of the Ministry of Finance as of May 18 decreased to $57.3 billion. A day earlier on Wednesday, the accounts were $68.3 billion, and at the end of last week it was $140 billion. Treasury Secretary Janet Yellen reiterated earlier this week that her department's ability to avoid exceeding its statutory debt ceiling through special accounting maneuvers could be exhausted around early June. On Thursday, she said a failure to raise the debt ceiling would be a "disaster" for the financial system.
Meantime, the demand for liquidity is not dropping. People keep taking out deposits, they fall 3rd week to lowest level in ~2 years, continuing to fall throughout the year as clients continue to seek higher returns on funds. Deposits in commercial banks decreased by $26.4 billion to $17.1 trillion. The flight of deposits mainly takes place in large banks

While commercial banks' demand for liquidity from the Fed is growing. The regional banking sector continues to use the Fed term financing program to obtain liquidity. The crisis has not gone away. The U.S. central bank had total outstanding loans to financial institutions of $96.1 billion across two credit lines in the week ending May 17 — up from $92.4 billion the previous week, although still well below the peak of $164.8 billion:

Wall Street fears a $1 trillion aftershock due to reaching a debt deal. This will push the US Treasury to replenish the treasury by issuing bills and probably other papers, and drain the liquidity of the financial system. Meantime Fed keeps the pace of QT, contracting lag from the planned pace, trying to keep balance clearing around 95 Bln per week. From mid-March 2023 to May 17, the Fed sells 95 billion in accordance with the announced plan, the backlog has stabilized. This is due to a significant increase in demand for bonds from money market funds and the population after the highest ever outflow of liquidity from deposits in American banks.
They withdraw from deposits, buy stocks and bonds, and market conditions allow the Fed to dump securities and successfully close positions, which is why over the past two months they have been selling plus or minus at a rate of 95 billion per month.

As you can see on the chart, there is a relationship between the S&P 500 and the volume of liquidity in the US financial system. What is the reason for the increase in liquidity against the background of securities sales from the Fed? Operations of lending by the Fed, mentioned above, after the banking panic in March. And operations of the US Treasury on the implementation of the cache from the accounts of the Fed (this leads to an increase in liquidity).

Now this party is ready to be over. Then in December 2021, the collapse of the cache to this threshold led to an increase in the debt limit by $ 2.5 trillion and the activation of the money pump – in the two months to February 16, 2022, the US Treasury, in addition to financing the budget deficit, replenished the cache reserves by $ 650 billion.
The volume of borrowings for 2 months amounted to $ 1.2 trillion, which then led to the first phase of the market decline by 8% even before the actualization of inflation problems and expectations of tightening of the Fed's monetary policy. The lag between the start of borrowing and the decline of the market was 2 weeks (since the beginning of January 2022, they began to fall). The increase in the debt limit that will happen the other day is a very negative market signal, because a large–scale withdrawal of liquidity from the market for hundreds of billions of dollars will inevitably occur.
The expected volume of net borrowings from June to December 2023 is at least $1.5-2.2 trillion, as we've calculated in our previous researches, where we've discussed the US budget deficit until the end of 2023.
The sharp reduction in liquidity in the US monetary system, which can cause numerous negative consequences. Including an increase in the cost of real credit in banks, which will accelerate the pace of economic decline and lower the standard of living of the population. It will no longer be the leadership of the Fed that will be responsible for this, but the leadership of the Treasury, but this will inevitably entail serious political consequences.
Conclusion:
Here actually we have another important topic to discuss - recent J. Yellen and J. Powell speeches concerning debt ceil, banking sector, Fed's policy etc. But now this topic has too large political component, which we explain tomorrow in our Gold market report. Besides, I do not want to overload report with information. Following probabilities that suggest increasing of the debt ceil, we could acknowledge that "big USD liquidity draught" stands ahead. It is still a question how they will place the new borrowings - either in a way of gradual US Bonds auctions, as usual, or, Fed will buy everything and then start selling the bonds off the balance, in a way of QT. Probably it could be some combination of both ways. Second way is more inflationary, because in this case, Fed will print additionally $1.5-2.2 Trln and all these money will be spent by US Treasury. This, in turn, could become another factor in favor of Fed interest rate hike in June and July. Taking in consideration of J. Yellen's hysteria, it seems that Treasury needs this money "yesterday". Thus, as we warned about US Dollar appreciation in recent two weeks as we keep this scenario for few weeks or even months more, as Debt Ceil saga is coming to the culmination.
Less probable scenario with US Debt Default also promises nothing good to the markets. We already have discussed few possible scenarios how it could be done, and the one thing we could say definitely. The US will choose the scenario that will be least harmful to domestic financial system and try to put all burden of foreign holders of US Debt. In this case all foreign system, based on collateral of "riskless" US debt will crash. As we've explained, this also will trigger demand for USD. It sounds like madness, but this is how global financial system works. This is the topic for gold report tomorrow, but now we have reasons to suggest that this scenario not as small chances to happen as market society thinks.
We should understand that ongoing US Dollar strength has no relation to mutual currencies valuation of EUR and USD. In fact, it has no relation to US Dollar value or any other economical reason. This is purely technical process because of specific of modern financial system structure. That's why, any technical analysis or other approach is not efficient now. We just need to wait when this process will be over.
Despite that we've got some important data this week, such as US Retail Sales, China economy growth, unemployment statistics etc., but, no doubts debt ceil and Friday's J Powell and J. Yellen speeches have become the major events of this week. Despite that debt ceil already increased circa 70 times, current case is unique. It was never so strong confrontation in US political elite and never so big bets were on the table. Debt default is unique chance, controlled financial events of 9/11 scale that could be used for big political shifts. That's why this time it might be going different.
Market overview
First of all, we would like to focus on too strong market confident about coming Fed easing policy. We suggest that market strongly underestimate chances for more rate hikes through this year. As well as more extended period when rate will be frozen around the high level. U.S. central bankers on Monday signaled they see interest rates staying high and, if anything, going higher, given inflation that may be slow to improve and an economy showing only tentative signs of weakness.
In interviews and media appearances, four regional U.S. central bank presidents began disentangling the data and risks that will feed into a June 13-14 decision about whether to raise interest rates for an 11th consecutive time or pause the tightening cycle. Investors are betting heavily that the Fed's benchmark overnight interest rate will remain in the 5.00%-5.25% range set at the May 2-3 meeting, when policymakers opened the door to calling a halt to further increases in borrowing costs.
But Fed officials on Monday said the jury is very much out. Data since the last meeting showed a continued strong job market and little progress on the inflation front, even as risks from ongoing banking sector stress and a possible U.S. debit limit crisis argue for caution. Overall, policymakers said ensuring inflation returns to the Fed's 2% annual target remains the top priority.
We posted some speeches in our Telegram. Just to give you an example of Fed officials on Thursday pushed against a rate-hike pause next month, citing persistently high inflation - Dallas Fed President Lorie Logan on Thursday, for instance, said she is concerned that "much too high" inflation is not cooling fast enough to allow the Fed to pause its interest-rate hike campaign in June.
And this is not only in the US. The European Central Bank will hike its key interest rates by 25 basis points at each of the next two meetings, according to economists polled by Reuters, many of whom also said the bigger risk was rates could go higher still in the future.
"The messaging from several ECB speakers ... has clearly been on the hawkish side since the (May 4) meeting, and their consumer expectations survey just showed higher inflation expectations," noted Ruben Segura-Cayuela, Europe economist at Bank of America. "Unless something breaks, we can only reiterate our view that - despite the cracks appearing in the outlook - two more 25 bps hikes are the lower bound."
"Given its importance to ECB policy prospects, the trajectory of core inflation is pivotal to the euro zone's economic and financial outlook," said Ken Wattret at S&P Global Market Intelligence. In the short term, with the ECB signalling it has 'more ground to cover', the risk is to the upside. The hiking cycle could extend into Q3 given still elevated core inflation, the record low unemployment rate and growth resilience."
The European Central Bank needs to keep interest rates high to curb inflation in the medium term, its president Christine Lagarde said on Friday, signalling more monetary tightening.
"We still have to have sustainably high interest rates, so it's a time when we have to really buckle up and look at this target that we have and deliver on it," Lagarde told Spanish state television TVE. "We are heading towards more delicate decisions going forward but we will be courageous and we will take the decisions that are needed to bring inflation back to 2%. And we will do it, no question about it," Lagarde said.
She said the ECB would pursue that goal even though the euro zone was in a "critical" moment with inflation going down, monetary tightening beginning to have an impact, and banks limiting credit.
According to Michael Hartnett of BofA, the biggest "sick deal" in the next 12 months will be to raise the Fed funds rate to 6% instead of falling to 3%. The Bank of America strategist reiterated his call to sell US equities, and rising bond yields pose a risk.
Besides, formally, The Fed has many reasons to be more optimistic about three-year growth: solid job growth continues to exceed forecasts, auto sales are at a nearly two-year high, new home sales were the highest in a year in March, and manufacturing is stabilizing. Although for the truth sake - the Fed's latest statement is like two peas in a pod similar to the statement in 2006, when the rate hike cycle ended. We will see. Fed has to force everybody to buy more bonds. They need to get constant demand on a new debt to finance rising government spending. But we will talk about this issue below.
After the release of data on unemployment claims and business activity from the Philadelphia Fed, the markets have changed their minds and are now again waiting for a rate hike in June - probability jumps to 40% from 10%. Thursday's reports showed lower-than-expected U.S. initial jobless claims of 242,000 in the latest week, compared with forecasts of 254,000.
Another piece of data indicated a milder-than-expected fall in the Philadelphia Federal Reserve's manufacturing index to -10.4 in May from -31.3 in April. Markets were forecasting a contraction of -19.8.
"A raft of stronger-than-expected data is intersecting with a hawkish shift in communications from Fed officials to push rate expectations across the front end of the curve," said Karl Schamotta, chief market strategist, at Corpay in Toronto. "Traders are building up tail risk protection on a hike at the June meeting, and trimming bets on rate cuts through the latter half of the year as the Fed's long-standing 'higher-for-longer' mantra gains new resonance."
Now the probability drops to 17.4%.
Alvin Tan, head of Asia FX strategy at RBC Capital Markets, doubts the safe-haven argument of USD strength. If investors were worried, stocks would be falling, he said. In reality the S&P 500 has been flat since the middle of April and is up more than 8% this year.
Tan said concerns that the Fed has not yet slain inflation are part of the story. A University of Michigan survey released last week showed consumer inflation expectations rose to a five-year high of 3.2% in May, lifting bond yields and the dollar. Traders currently expect the U.S. central bank to cut interest rates sharply later this year as a recession takes hold, yet Tan is skeptical.
"We think there's a chance that U.S. interest rates could grind higher," he said. "We remain unconvinced by the argument that the dollar is on a steady decline from here."
For other analysts, so-called technical factors are at play. Investors have mounted big bets against the dollar. The net short bets of hedge funds and other speculators amounted to $14.56 billion last week, data from the Commodity Futures Trading Commission shows, the biggest such position since mid-2021.
Counter-intuitively, that positioning can help drive rallies. If the dollar rises slightly, some traders may be forced to close out their short positions by buying the dollar, which then boosts its value.
"The dollar is very, very oversold," said Chester Ntonifor, FX strategist at BCA Research. "That's one technical indicator. But a simple technical indicator is that it is very atypical for you to have a straight-line decline in the dollar."
Will the authorities force banks to buy more (government) bonds? Certainly - ECB is tightening its controls on commercial banks' liquidity buffers and may increase requirements on individual creditors later this year. And higher interest rates will have to serve to this purpose. So our view is market under-prices chances of rate hike in June and July. If we will be correct on this suggestion, US Dollar could show unexpected rally, blowing everything out of the way. Especially those, who already start taking strategical short positions.
And the Fed intends to do the same. Any "tightening" controls and higher safety margin ratios, applied to the banks unavoidably triggers demand for liquidity, since banks will have to hold more highly liquid reserves on the balance to match new central banks conditions.
US TREASURY ON FIRE
First is, let's start from our favorite chart - available US Treasury assets on Fed account. This week it hits lowest level since 2021:
The U.S. Treasury Department’s window to allow the U.S. government not to run out of borrowing capacity continues to shrink, with cash balances falling to their lowest level since 2021. The only joy is that there has been a slight increase in funds available for emergency measures.
As of May 17, the Treasury Department took emergency measures to enter the market and borrow $92 billion to help the government pay bills, the ministry said in a statement. That's up from the roughly $88 billion that was placed on May 10 and means that just over a quarter of the $333 billion is still available to keep the US government from running out of borrowing capacity under the statutory debt limit.
At the same time , the balance of funds of the Ministry of Finance as of May 18 decreased to $57.3 billion. A day earlier on Wednesday, the accounts were $68.3 billion, and at the end of last week it was $140 billion. Treasury Secretary Janet Yellen reiterated earlier this week that her department's ability to avoid exceeding its statutory debt ceiling through special accounting maneuvers could be exhausted around early June. On Thursday, she said a failure to raise the debt ceiling would be a "disaster" for the financial system.
Meantime, the demand for liquidity is not dropping. People keep taking out deposits, they fall 3rd week to lowest level in ~2 years, continuing to fall throughout the year as clients continue to seek higher returns on funds. Deposits in commercial banks decreased by $26.4 billion to $17.1 trillion. The flight of deposits mainly takes place in large banks
While commercial banks' demand for liquidity from the Fed is growing. The regional banking sector continues to use the Fed term financing program to obtain liquidity. The crisis has not gone away. The U.S. central bank had total outstanding loans to financial institutions of $96.1 billion across two credit lines in the week ending May 17 — up from $92.4 billion the previous week, although still well below the peak of $164.8 billion:
Wall Street fears a $1 trillion aftershock due to reaching a debt deal. This will push the US Treasury to replenish the treasury by issuing bills and probably other papers, and drain the liquidity of the financial system. Meantime Fed keeps the pace of QT, contracting lag from the planned pace, trying to keep balance clearing around 95 Bln per week. From mid-March 2023 to May 17, the Fed sells 95 billion in accordance with the announced plan, the backlog has stabilized. This is due to a significant increase in demand for bonds from money market funds and the population after the highest ever outflow of liquidity from deposits in American banks.
They withdraw from deposits, buy stocks and bonds, and market conditions allow the Fed to dump securities and successfully close positions, which is why over the past two months they have been selling plus or minus at a rate of 95 billion per month.
As you can see on the chart, there is a relationship between the S&P 500 and the volume of liquidity in the US financial system. What is the reason for the increase in liquidity against the background of securities sales from the Fed? Operations of lending by the Fed, mentioned above, after the banking panic in March. And operations of the US Treasury on the implementation of the cache from the accounts of the Fed (this leads to an increase in liquidity).
Now this party is ready to be over. Then in December 2021, the collapse of the cache to this threshold led to an increase in the debt limit by $ 2.5 trillion and the activation of the money pump – in the two months to February 16, 2022, the US Treasury, in addition to financing the budget deficit, replenished the cache reserves by $ 650 billion.
The volume of borrowings for 2 months amounted to $ 1.2 trillion, which then led to the first phase of the market decline by 8% even before the actualization of inflation problems and expectations of tightening of the Fed's monetary policy. The lag between the start of borrowing and the decline of the market was 2 weeks (since the beginning of January 2022, they began to fall). The increase in the debt limit that will happen the other day is a very negative market signal, because a large–scale withdrawal of liquidity from the market for hundreds of billions of dollars will inevitably occur.
The expected volume of net borrowings from June to December 2023 is at least $1.5-2.2 trillion, as we've calculated in our previous researches, where we've discussed the US budget deficit until the end of 2023.
The sharp reduction in liquidity in the US monetary system, which can cause numerous negative consequences. Including an increase in the cost of real credit in banks, which will accelerate the pace of economic decline and lower the standard of living of the population. It will no longer be the leadership of the Fed that will be responsible for this, but the leadership of the Treasury, but this will inevitably entail serious political consequences.
Conclusion:
Here actually we have another important topic to discuss - recent J. Yellen and J. Powell speeches concerning debt ceil, banking sector, Fed's policy etc. But now this topic has too large political component, which we explain tomorrow in our Gold market report. Besides, I do not want to overload report with information. Following probabilities that suggest increasing of the debt ceil, we could acknowledge that "big USD liquidity draught" stands ahead. It is still a question how they will place the new borrowings - either in a way of gradual US Bonds auctions, as usual, or, Fed will buy everything and then start selling the bonds off the balance, in a way of QT. Probably it could be some combination of both ways. Second way is more inflationary, because in this case, Fed will print additionally $1.5-2.2 Trln and all these money will be spent by US Treasury. This, in turn, could become another factor in favor of Fed interest rate hike in June and July. Taking in consideration of J. Yellen's hysteria, it seems that Treasury needs this money "yesterday". Thus, as we warned about US Dollar appreciation in recent two weeks as we keep this scenario for few weeks or even months more, as Debt Ceil saga is coming to the culmination.
Less probable scenario with US Debt Default also promises nothing good to the markets. We already have discussed few possible scenarios how it could be done, and the one thing we could say definitely. The US will choose the scenario that will be least harmful to domestic financial system and try to put all burden of foreign holders of US Debt. In this case all foreign system, based on collateral of "riskless" US debt will crash. As we've explained, this also will trigger demand for USD. It sounds like madness, but this is how global financial system works. This is the topic for gold report tomorrow, but now we have reasons to suggest that this scenario not as small chances to happen as market society thinks.
We should understand that ongoing US Dollar strength has no relation to mutual currencies valuation of EUR and USD. In fact, it has no relation to US Dollar value or any other economical reason. This is purely technical process because of specific of modern financial system structure. That's why, any technical analysis or other approach is not efficient now. We just need to wait when this process will be over.