Sive Morten
Special Consultant to the FPA
- Messages
- 18,644
Fundamentals
Since it turns to nice habit – make a shot of fundamental view once per month – let’s continue it. Situation has changed a bit and closest events could seriously impact on our technical expectations. Other words, moves that we expect to see could be triggered by important macro data. But let’s move step by step.
During the past week it seems that market just forget about Greece crisis, since US events come in lead. US macro data was really poor – there was not GDP review to the upside, although many investors have counted on that, Durable orders fell for 3.6% and Initial claims rose. If we surplus Fed Index on Friday the week before - 3.9 vs. 18 expected and other, then overall picture will be not very sunny.
But not only these numbers make investors nervous. The major question is – QE II program and NFP that will be released on coming week. Speaking about QE II, that should be closed on June 30, the major question is – who will buy US Treasuries, when Fed will stop to do that. Currently overall opinion tells that Fed will not stop totally to purchase US bonds, but it also will not announce QE III. That’s why hidden emission of money will continue one way or another. Sooner rather than later it will lead to inflation. While previously any problems in the world lead to USD appreciation, including problems of US themselves, now this tendency becomes weaker and tend to finish, because investors see a lot of problems in US as political (US debt ceiling) as financial (Real estate market, GDP reducing, hidden emission of money etc.)
Speaking about NFP, that is expected at 215K, I think we should be prepared for downward surprise due destruction on the south of US due tornado activity and Japan’s disruptions.
Also investors will track ISM composite index, since it has solid correlation with annualized GDP.
Speaking about EUR/USD although Germany CPI dissapointingly dropped for -0.2% but the EUR has ignored that with QE III in the brains. In general EUR could continue move higher, but major risks here are: upside surprise in NFP on Friday or some attacking comments from EU officials that could calm down EUR pace a bit.
Monthly
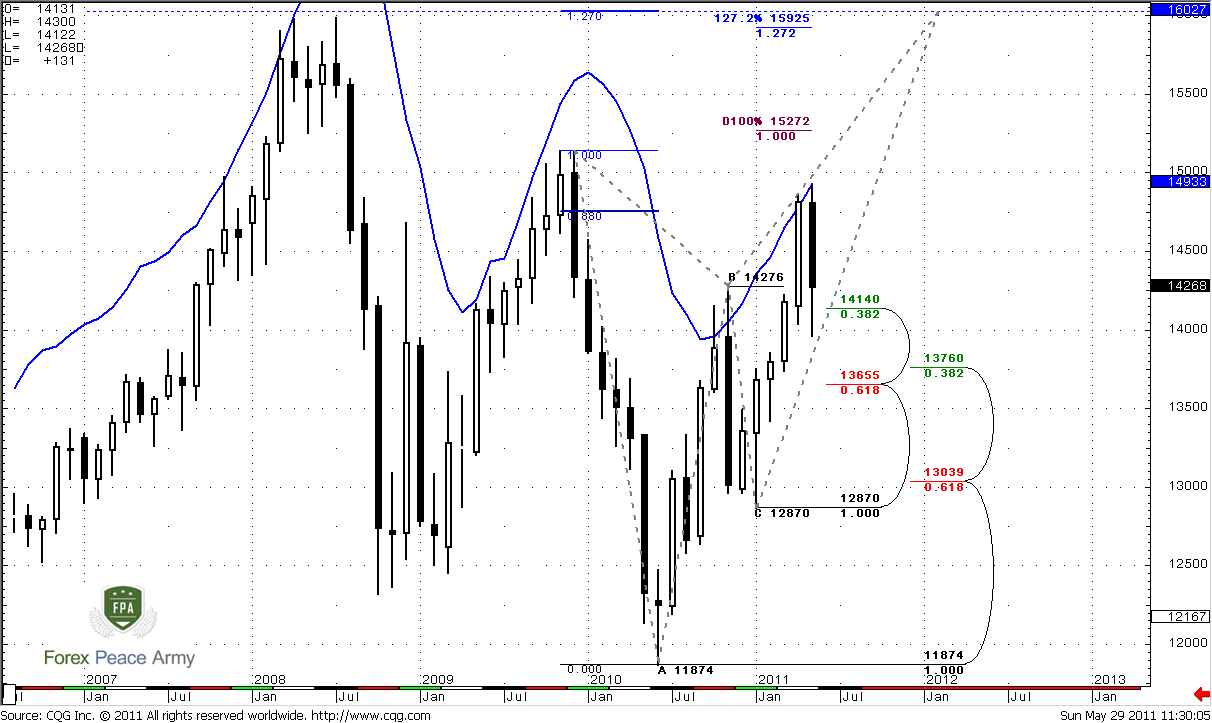
Here market just slightly moved higher, so analysis that we’ve made on previous week remains valid.
Here we can see all importance of monthly overbought. Finally market has fallen into retracement that was awaited by positional traders and shown solid plunge. On current view we see only single moment on monthly time frame – market is bouncing from nearest 3/8 Fib support at 1.4140 that stands very close to previous highs at 1.4276.
Since till the end of May just couple of days rest, possibly we will not see pure bearish engulfing pattern. But some kind of dark clouds we will get I suppose. Although we can’t exclude that it could be canceled by the market but more probable seems the perspective of continuation at least till monthly Confluence support at 1.3655-1.3760. This possibility also implicitly confirms with market overbought. Usual retracement target during overbought is zero point of Detrended Oscillator and this level stands around monthly Confluence support. Also its worth to note here that trend will remain bullish, even if market will reach 1.37 area. Still, if market will hold on first Fib support, this will be much better for current bullish bias and Butterfly pattern. Currently we still can’t say – will this level hold market or not. All that we can say for now is that market still holds above it. Now market continues retracement after initial strong plunge. I suppose this retracement could continue for week or two. Then probably we will get some clearer signs what to expect form the market.
Nearest target stands at 1.5272, but potentially it could turn to butterfly “Sell” pattern. The target of this pattern is 1.27 extension at 1.6027. Also it almost coincides with 1.27 target of recent bullish AB-CD at 1.5925.
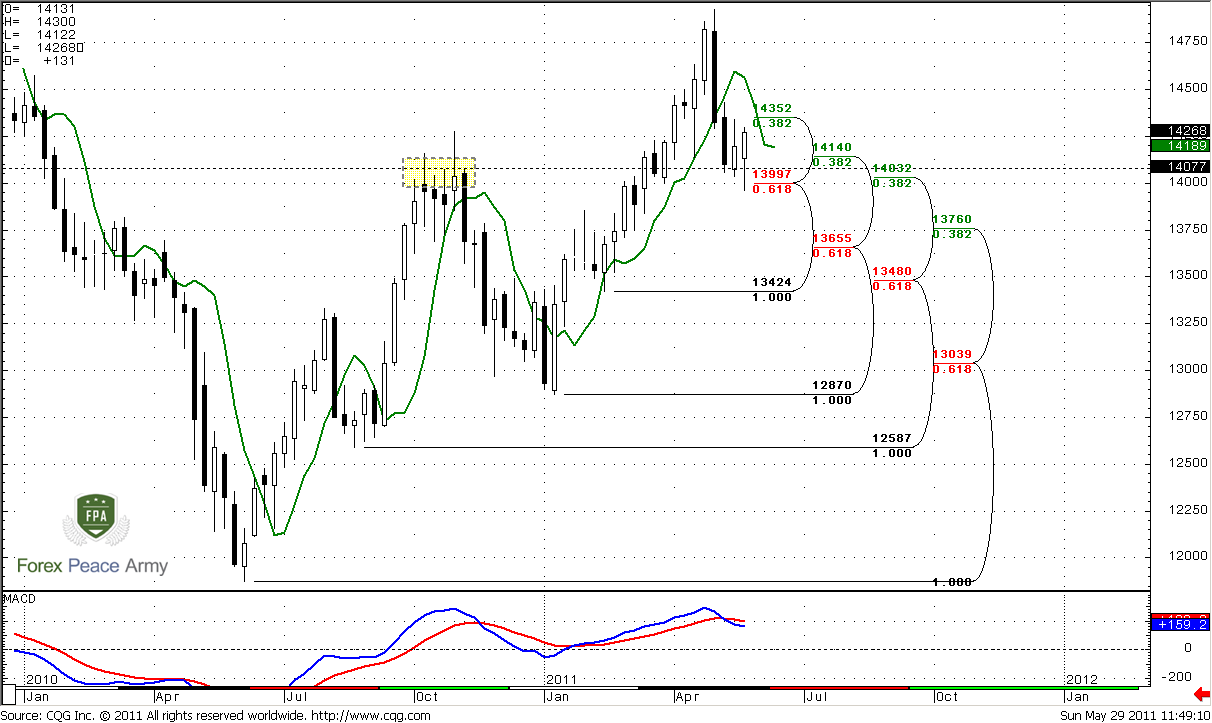
Weekly
This time frame remains among most important for us currently. Our expectations are linked to potential B&B “Buy” trade due to previous upside momentum. So, market usually tries to continue previous move mechanically, i.e. because of momentum. This very often leads to deep retracement up right after initial plunge. That’s what we waiting for. But this retracement usually starts from some solid support and not later than 1-3 closes below 3x3 SMA. Previously we’ve noted that this momentum trade could start either from 1.4140 (it’s where we’re now) or from weekly Confluence support at 1.3655-1.3760. During past week we’ve logically abandoned idea with Confluence area, due to lack of time for starting momentum trade. And we’ve said that either this trade will start now (on previous week) or it hardly will start at all. And looks like it has started. We have to acknowledge that on weekly time frame things look nice - some kind of W&R of previous 2-week’s lows and close on positive note. At least current pullback looks tasty. Don’t pay much attention that current trend is bearish. B&B, aka momentum trade is a Directional one, and direction overrules trend.
So, I dare say that probably we’ve got nice bullish context for coming week at least till 1.4550 area. Let’s take a look how we can use it on lower time frame analysis.
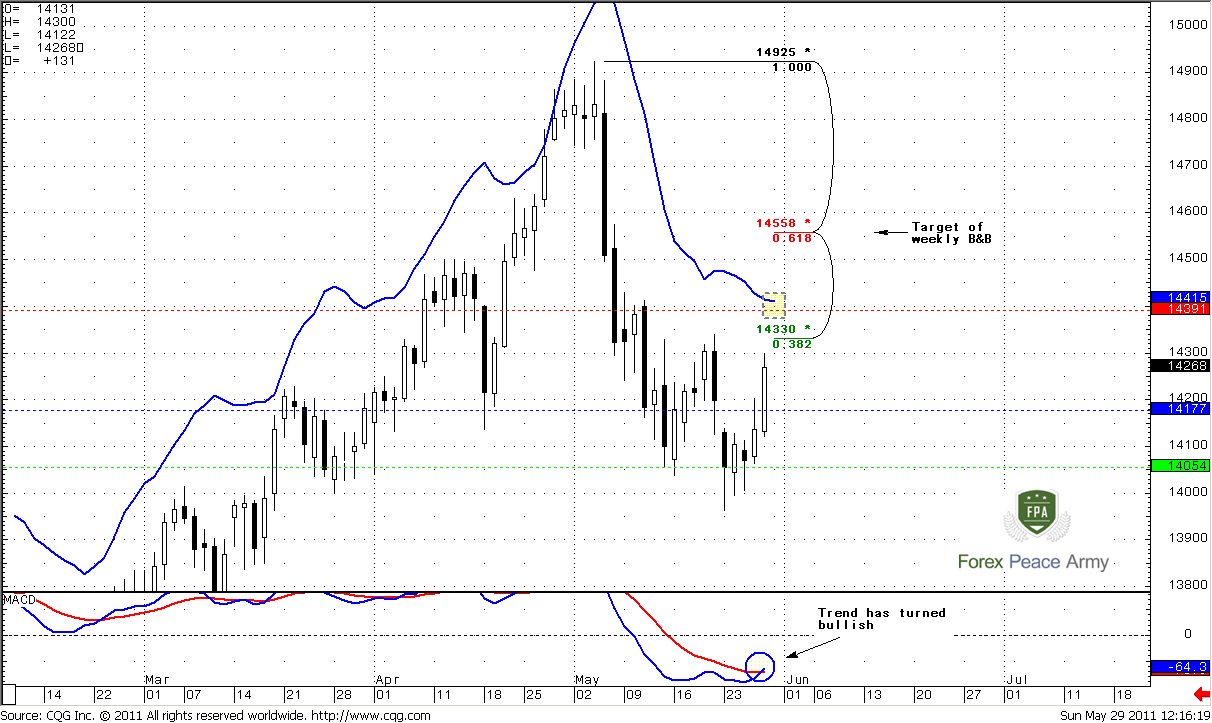
Daily
First of all – trend has turned bullish at close, also pay attention to the angle of line’s crossing. Nice signal. Second, here you can see why long-term high-probability trades so attractive – if you has not be able to open position right at the initial reversal to the upside – you have a lot of time to do it later. And I suppose that market will give us a possibility to do it not once but twice or even thrice.
Colored lines, as usual – weekly pivot points, that we will use later to estimate the entry point. But here, on daily we see couple of resistance areas. First one is 3/8 Fib resistance at 1.4330, second – 1.4390 - weekly pivot resistance 1 and daily overbought. Market should show some pullback when it will reach one or another area. And we may use any (or even both) from these pullbacks to enter Long.
Besides, weekly pivot stands right below the market, and this is another opportunity that we usually use.
By the way, if you intraday trader, keep in mind, that since daily trend is bullish, you have no context to enter short, while you do not trade at 5 min chart.
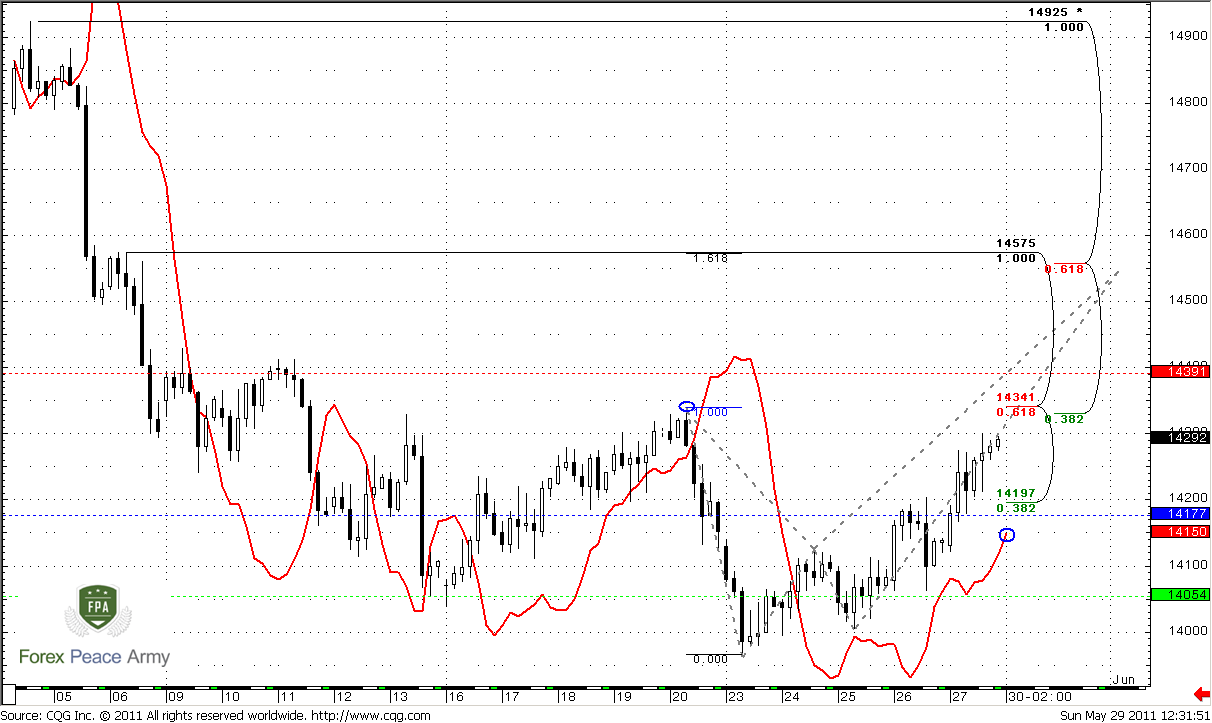
4-hour
Here is nice bullish trend. On 4-hour chart we have couple moments that important for us. Take a look at red line – this MACD Predictor and it shows that trend will remain bullish till 1.4150-1.42 area. This precisely an area of weekly pivot point – 1.4177. So, it tells that if even retracement will happen (and I hope it will), till 1.4177 – trend still remains bullish and we will have all that we need to enter Long.
Second, just above the market 1.4340 – 4-hour confluence resistance, previous highs and a bit higher – 1.4391 weekly pivot resistance. Odds suggest that market should turn to downward retracement due to 2 reasons. First, because this is nice resistance, second – because there is always 70-80% probability of touching pivot during the week. This gives us nice chances to enter.
Also here you can see our Crab pattern with the target that confirms the same area – 1.4550.
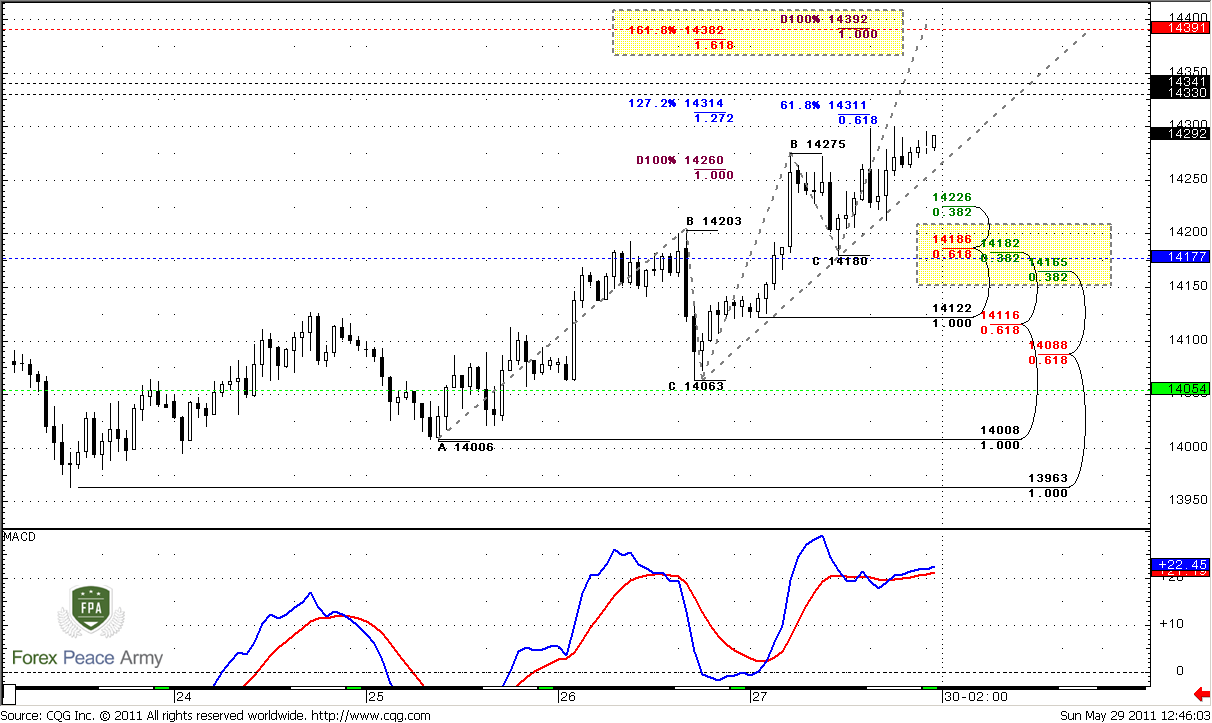
Hourly
Trend is still bullish here, but not so strong. Hourly chart can’t confirm us for now 1.4160-1.4170 area as 100% level to enter, since down move has not started yet. But… We can see that as near 1.4330-1.4341 weekly confluence resistance as near weekly pivot resistance 1 (that is also a daily overbought) different Fib extensions targets from different ABC-bottom patterns. I’ve marked them, so I think this is look not too confusing.
Also hourly chart tells, that beyond pivot point itself there are a lot of different Fib supports, including major 3/8 Fib support.
Hence, conclusion looks obvious – if you’re bullish – wait pullback in 1.4170 area to search for bullish patterns. If you’re scalp trader – you may try to short market from 1.4340 or 1.4390 area – depending when it will turn to downward retracement. 1.4390 is safer, and allows to place tighter stop, since this is daily overbought.
Conclusion:
Position traders:
Although market turns to upside retracement, monthly chart suggests that retracement to 1.36 area is still possible. Still, you may try to enter long with reduced volume and move stop to b/e, if market will reach 1.4550 area. Because currently it’s impossible to say – will market sky-rocket further, or it will be AB-CD retracement to 1.36 area on weekly time frame.
Intraday and daily traders:
1. Market has nice chances to turn into retracement from 1.4340 or 1.4390 area.
2. Assumed target of retracement – 1.4170 area.
3. If you’re bullish – wait 1.4170 and search there for buy signals;
4. If you’re scalper and search for scalp short possibility – keep an eye on 1.4340 first and on 1.4390 area (That is preferable, due it’s safety) to try enter short with target 1.4170.
The technical portion of Sive's analysis owes a great deal to Joe DiNapoli's methods, and uses a number of Joe's proprietary indicators. Please note that Sive's analysis is his own view of the market and is not endorsed by Joe DiNapoli or any related companies.
Since it turns to nice habit – make a shot of fundamental view once per month – let’s continue it. Situation has changed a bit and closest events could seriously impact on our technical expectations. Other words, moves that we expect to see could be triggered by important macro data. But let’s move step by step.
During the past week it seems that market just forget about Greece crisis, since US events come in lead. US macro data was really poor – there was not GDP review to the upside, although many investors have counted on that, Durable orders fell for 3.6% and Initial claims rose. If we surplus Fed Index on Friday the week before - 3.9 vs. 18 expected and other, then overall picture will be not very sunny.
But not only these numbers make investors nervous. The major question is – QE II program and NFP that will be released on coming week. Speaking about QE II, that should be closed on June 30, the major question is – who will buy US Treasuries, when Fed will stop to do that. Currently overall opinion tells that Fed will not stop totally to purchase US bonds, but it also will not announce QE III. That’s why hidden emission of money will continue one way or another. Sooner rather than later it will lead to inflation. While previously any problems in the world lead to USD appreciation, including problems of US themselves, now this tendency becomes weaker and tend to finish, because investors see a lot of problems in US as political (US debt ceiling) as financial (Real estate market, GDP reducing, hidden emission of money etc.)
Speaking about NFP, that is expected at 215K, I think we should be prepared for downward surprise due destruction on the south of US due tornado activity and Japan’s disruptions.
Also investors will track ISM composite index, since it has solid correlation with annualized GDP.
Speaking about EUR/USD although Germany CPI dissapointingly dropped for -0.2% but the EUR has ignored that with QE III in the brains. In general EUR could continue move higher, but major risks here are: upside surprise in NFP on Friday or some attacking comments from EU officials that could calm down EUR pace a bit.
Monthly
Here market just slightly moved higher, so analysis that we’ve made on previous week remains valid.
Here we can see all importance of monthly overbought. Finally market has fallen into retracement that was awaited by positional traders and shown solid plunge. On current view we see only single moment on monthly time frame – market is bouncing from nearest 3/8 Fib support at 1.4140 that stands very close to previous highs at 1.4276.
Since till the end of May just couple of days rest, possibly we will not see pure bearish engulfing pattern. But some kind of dark clouds we will get I suppose. Although we can’t exclude that it could be canceled by the market but more probable seems the perspective of continuation at least till monthly Confluence support at 1.3655-1.3760. This possibility also implicitly confirms with market overbought. Usual retracement target during overbought is zero point of Detrended Oscillator and this level stands around monthly Confluence support. Also its worth to note here that trend will remain bullish, even if market will reach 1.37 area. Still, if market will hold on first Fib support, this will be much better for current bullish bias and Butterfly pattern. Currently we still can’t say – will this level hold market or not. All that we can say for now is that market still holds above it. Now market continues retracement after initial strong plunge. I suppose this retracement could continue for week or two. Then probably we will get some clearer signs what to expect form the market.
Nearest target stands at 1.5272, but potentially it could turn to butterfly “Sell” pattern. The target of this pattern is 1.27 extension at 1.6027. Also it almost coincides with 1.27 target of recent bullish AB-CD at 1.5925.
Weekly
This time frame remains among most important for us currently. Our expectations are linked to potential B&B “Buy” trade due to previous upside momentum. So, market usually tries to continue previous move mechanically, i.e. because of momentum. This very often leads to deep retracement up right after initial plunge. That’s what we waiting for. But this retracement usually starts from some solid support and not later than 1-3 closes below 3x3 SMA. Previously we’ve noted that this momentum trade could start either from 1.4140 (it’s where we’re now) or from weekly Confluence support at 1.3655-1.3760. During past week we’ve logically abandoned idea with Confluence area, due to lack of time for starting momentum trade. And we’ve said that either this trade will start now (on previous week) or it hardly will start at all. And looks like it has started. We have to acknowledge that on weekly time frame things look nice - some kind of W&R of previous 2-week’s lows and close on positive note. At least current pullback looks tasty. Don’t pay much attention that current trend is bearish. B&B, aka momentum trade is a Directional one, and direction overrules trend.
So, I dare say that probably we’ve got nice bullish context for coming week at least till 1.4550 area. Let’s take a look how we can use it on lower time frame analysis.
Daily
First of all – trend has turned bullish at close, also pay attention to the angle of line’s crossing. Nice signal. Second, here you can see why long-term high-probability trades so attractive – if you has not be able to open position right at the initial reversal to the upside – you have a lot of time to do it later. And I suppose that market will give us a possibility to do it not once but twice or even thrice.
Colored lines, as usual – weekly pivot points, that we will use later to estimate the entry point. But here, on daily we see couple of resistance areas. First one is 3/8 Fib resistance at 1.4330, second – 1.4390 - weekly pivot resistance 1 and daily overbought. Market should show some pullback when it will reach one or another area. And we may use any (or even both) from these pullbacks to enter Long.
Besides, weekly pivot stands right below the market, and this is another opportunity that we usually use.
By the way, if you intraday trader, keep in mind, that since daily trend is bullish, you have no context to enter short, while you do not trade at 5 min chart.
4-hour
Here is nice bullish trend. On 4-hour chart we have couple moments that important for us. Take a look at red line – this MACD Predictor and it shows that trend will remain bullish till 1.4150-1.42 area. This precisely an area of weekly pivot point – 1.4177. So, it tells that if even retracement will happen (and I hope it will), till 1.4177 – trend still remains bullish and we will have all that we need to enter Long.
Second, just above the market 1.4340 – 4-hour confluence resistance, previous highs and a bit higher – 1.4391 weekly pivot resistance. Odds suggest that market should turn to downward retracement due to 2 reasons. First, because this is nice resistance, second – because there is always 70-80% probability of touching pivot during the week. This gives us nice chances to enter.
Also here you can see our Crab pattern with the target that confirms the same area – 1.4550.
Hourly
Trend is still bullish here, but not so strong. Hourly chart can’t confirm us for now 1.4160-1.4170 area as 100% level to enter, since down move has not started yet. But… We can see that as near 1.4330-1.4341 weekly confluence resistance as near weekly pivot resistance 1 (that is also a daily overbought) different Fib extensions targets from different ABC-bottom patterns. I’ve marked them, so I think this is look not too confusing.
Also hourly chart tells, that beyond pivot point itself there are a lot of different Fib supports, including major 3/8 Fib support.
Hence, conclusion looks obvious – if you’re bullish – wait pullback in 1.4170 area to search for bullish patterns. If you’re scalp trader – you may try to short market from 1.4340 or 1.4390 area – depending when it will turn to downward retracement. 1.4390 is safer, and allows to place tighter stop, since this is daily overbought.
Conclusion:
Position traders:
Although market turns to upside retracement, monthly chart suggests that retracement to 1.36 area is still possible. Still, you may try to enter long with reduced volume and move stop to b/e, if market will reach 1.4550 area. Because currently it’s impossible to say – will market sky-rocket further, or it will be AB-CD retracement to 1.36 area on weekly time frame.
Intraday and daily traders:
1. Market has nice chances to turn into retracement from 1.4340 or 1.4390 area.
2. Assumed target of retracement – 1.4170 area.
3. If you’re bullish – wait 1.4170 and search there for buy signals;
4. If you’re scalper and search for scalp short possibility – keep an eye on 1.4340 first and on 1.4390 area (That is preferable, due it’s safety) to try enter short with target 1.4170.
The technical portion of Sive's analysis owes a great deal to Joe DiNapoli's methods, and uses a number of Joe's proprietary indicators. Please note that Sive's analysis is his own view of the market and is not endorsed by Joe DiNapoli or any related companies.
") Euro/usd ,,, sir i am having a tough time with UJ chart ... please help me .. i found a Kiss and Good bye .. i like too target 79.72:nerd: .. here is my trade plan . any suggestion for me sir :nerd:
Euro/usd ,,, sir i am having a tough time with UJ chart ... please help me .. i found a Kiss and Good bye .. i like too target 79.72:nerd: .. here is my trade plan . any suggestion for me sir :nerd: