Sive Morten
Special Consultant to the FPA
- Messages
- 18,644
Monthly
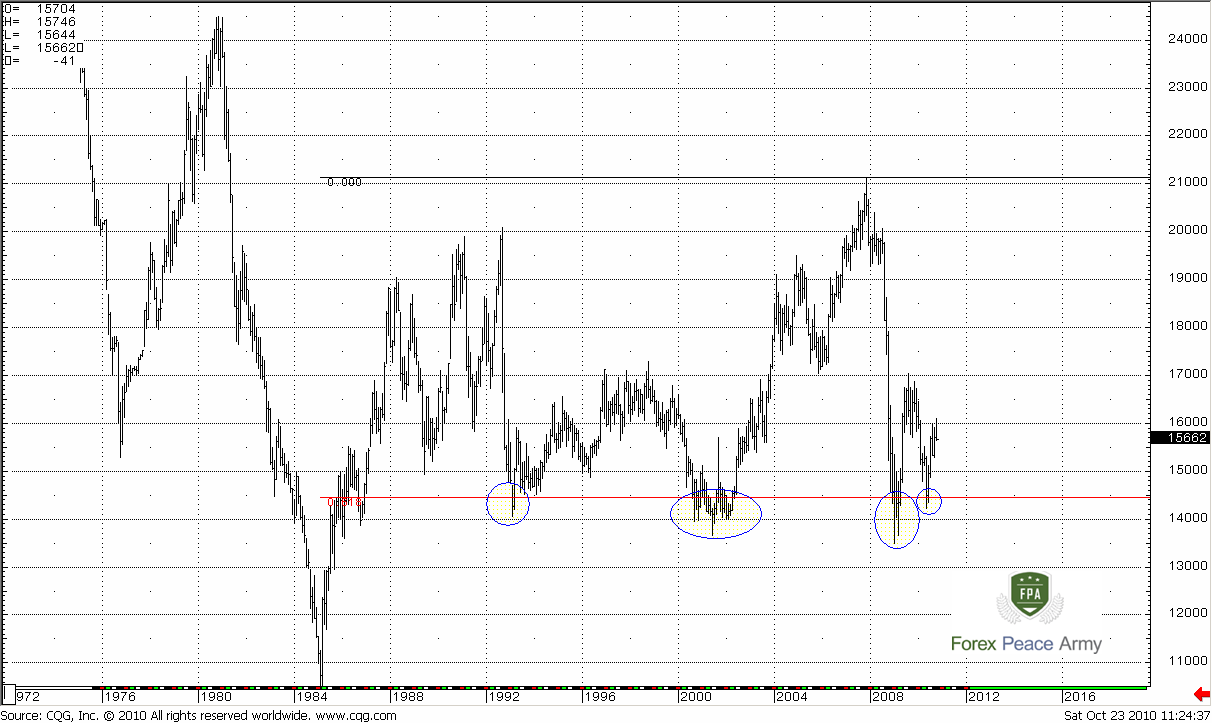
Look at this compressed chart #1 – 1.40-1.45 is a long term 0.618 Fib support that holds market since 90’s. In the recent time market has touched this level twice and retraced.
#1
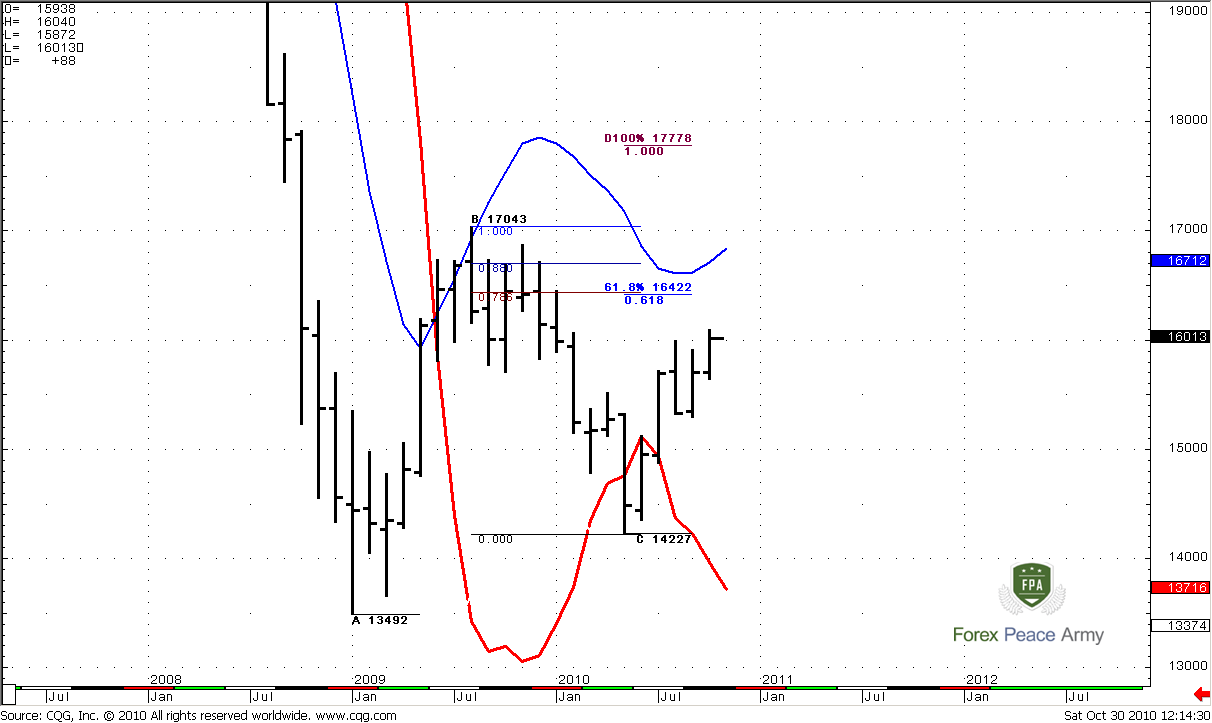
Current monthly trend is bullish. BC move down has been held by 0.786 Fib support from AB leg. Also take a note, that in C point market has tried to turn trend bearish but failed and trend has returned to bullish very fast. For the recent 3 months market is flirting with 0.618 Fib resistance and finally has closed above it. The single target that is currently logic is a nearest one – 0.618 Fib expansion from ABC-bottom pattern at 1.6422 that makes an Agreement with 0.786 Fib resistance. Next target is 100% expansion at 1.7778 that also creates an Agreement with Fib resistance, but it’s not logical now, because it beyond monthly overbought level that is a blue line of Oscillator Predictor on the chart. So, currently we have a single monthly target not far above the market. This upside context will be valid until minimum in C point holds.
#2
Weekly
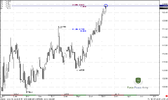
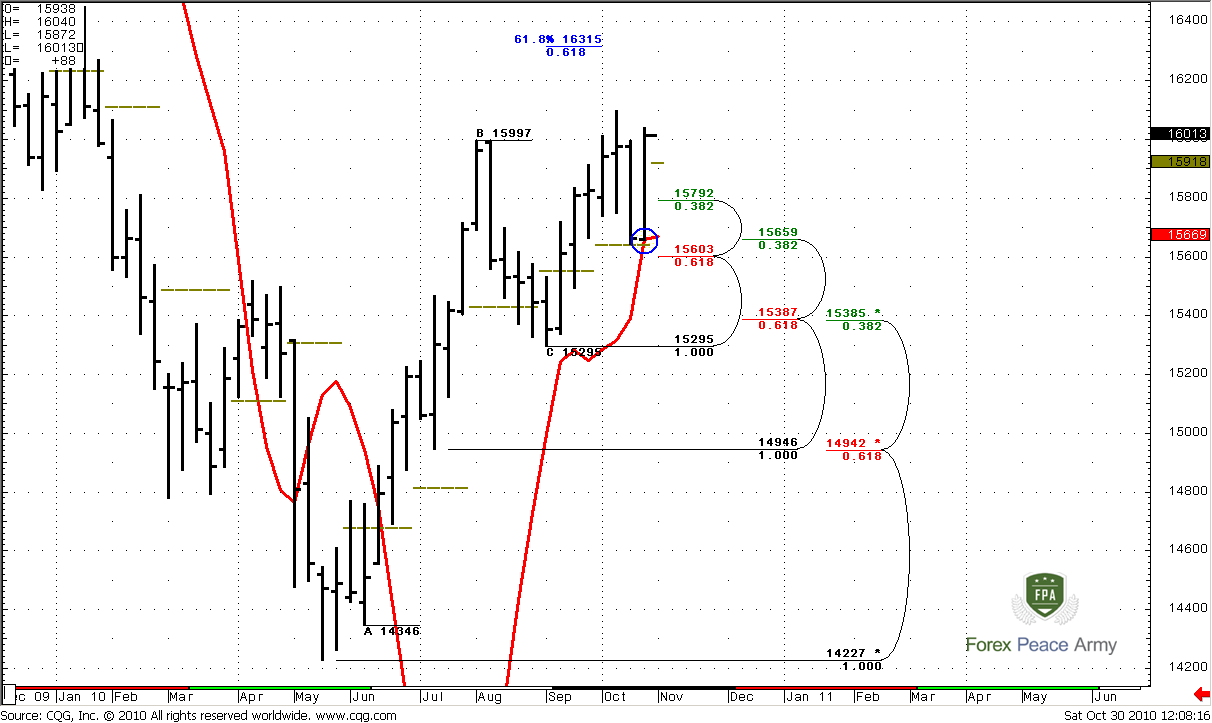
The situation on weekly time frame has become clearer now. During the previous week the main question was which one support area will hold the market – 1.5385 or 1.5650. Looks like that the latter one has done well. Also I’ve told that MACD Predictor comes in play on recent week, and if I will see MACDP failure pattern - will be much better. So, that has almost happened. Although the value of MACDP for recent week is 15658.95 and the low was 1.5659, I think that we can tell that there is a Stop grabber. It means that previous highs at 1.61 should be taken out by the price. Also take a note, that monthly pivot has held the market well. This is the sign of strength. The next weekly target is 61.8% Fib expansion at 1.6315. November pivot is 1.5918.
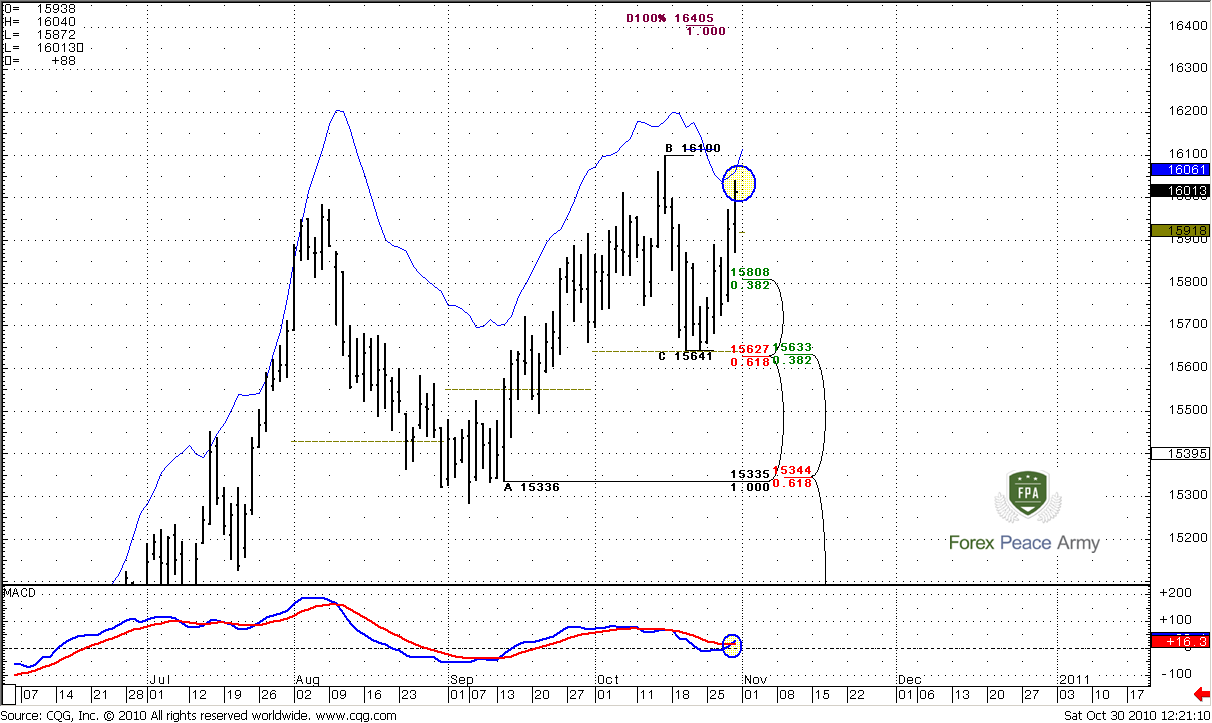
Daily
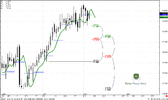
...Couple of important moments here. Daily trend turns bullish. Now all three time frames have confirmed bullish trend. On the chart#1 you can see how daily and weekly Confluence support with monthly pivot point has held the market and we see nice move up. Now, take a look at ABC-bottom pattern. The nearest target is 0.618% Fib expansion at 1.6113 and it just above the previous highs. 100% expansion target at 1.6405 is beyond the daily overbought level and not quite logical currently, but take a note that in very close to our monthly and weekly targets.
The blue line on the chart is Oscillator Predictor that shows level of overbought and market is close to it. I do not know exactly, will market touch target first at 1.6113 and retraced then or retrace first and only then will move to the target. But 4-hour chart analysis tells that the probability of initial retracement not small.
#1
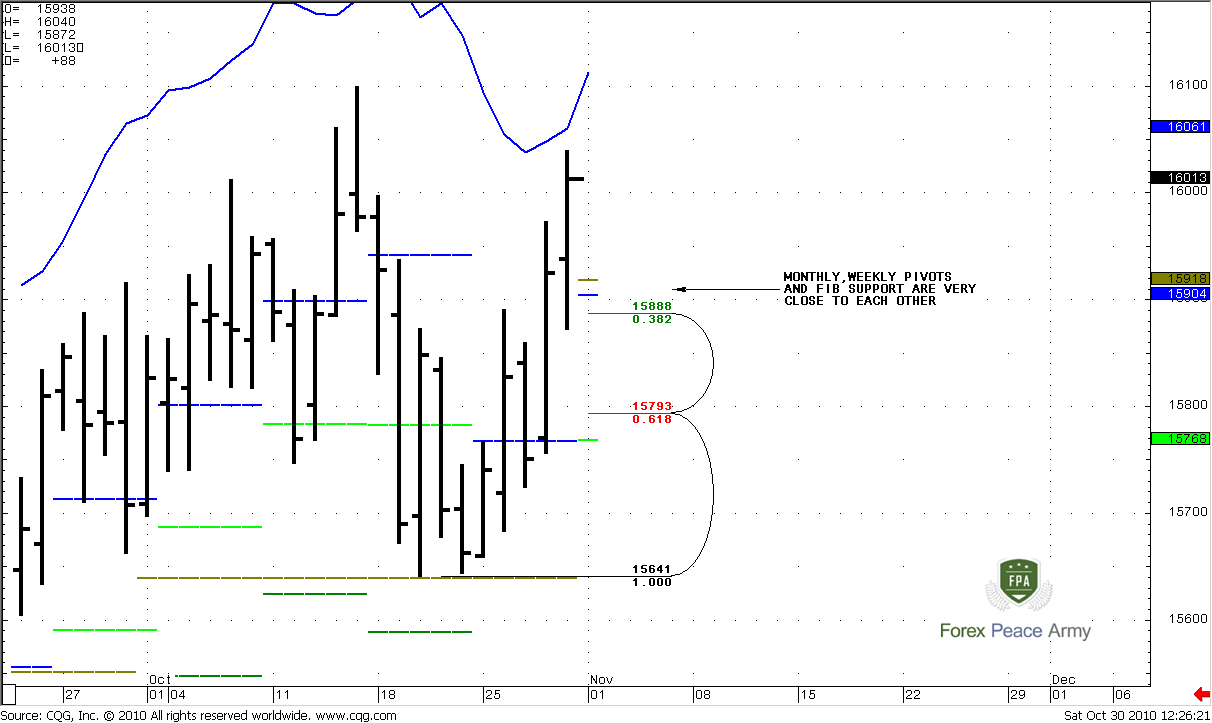
On #2 chart we can see support levels from the recent swing up. I think that the primary level for looking any ‘Buy’ signals around it is 1.5888-1.5918, because it includes monthly and weekly pivots and Fib support level. If bulls are still in charge, market should hold above pivots. At the same time I have to say that daily trend remains bullish even at 5/8 Fib support at 1.5793 and weekly pivot support 1. But, again – moving market below monthly and weekly pivots is a sign of weakness, and I prefer to see that market will hold above them.
#2
4-Hour
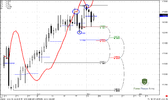
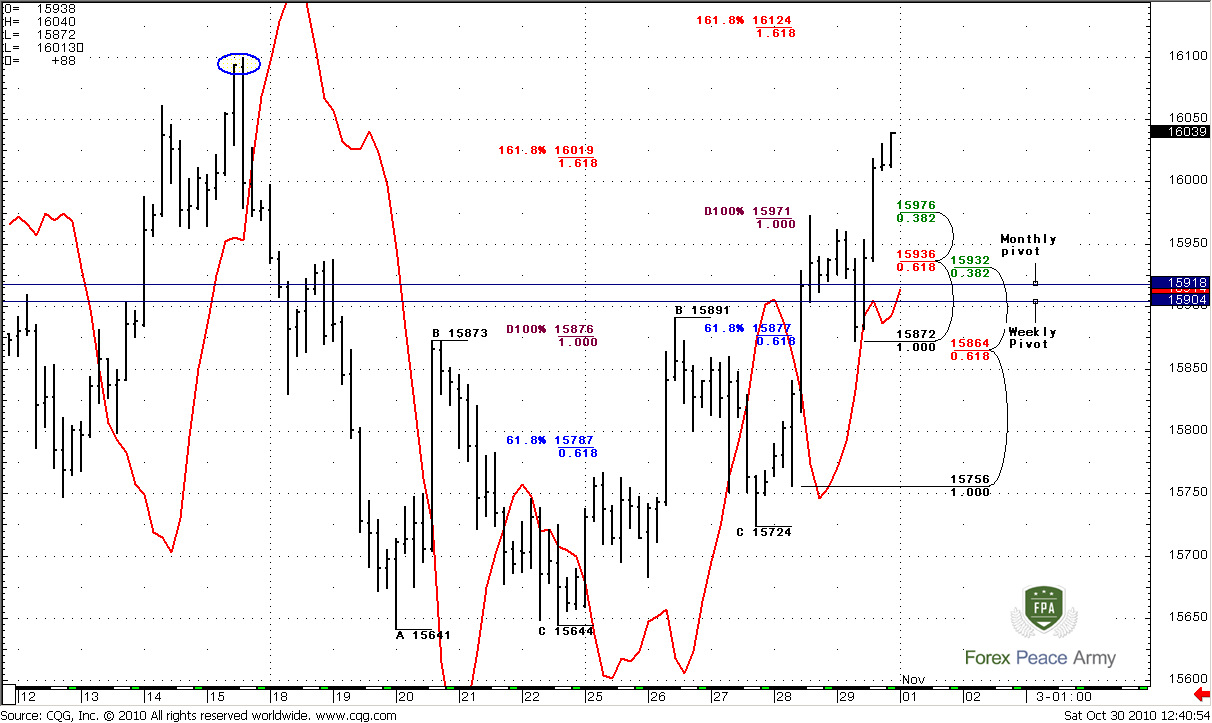
This chart looks a bit complicated, so let’s move through it step by step. The red line is MACDP and you can see that 4-hour chart is also bullish and remain bullish until 1.5910 area roughly that precisely coincides with an area between monthly and weekly pivot points. Second of all, look at the first ABC-bottom pattern – market has reach 1.618 Fib expansion at 1.6019 on Friday. Also, market has reached 100% expansion from more recent ABC and exceeded it. It means that market can reach 1.618 expansion at 1.6124 after some retracement lower. This target is very close to daily 1.6113 target and also above the previous highs. It means that with solid probability this highs will not hold.
Now, just below the market 4-hour Confluence support at 1.5932-1.5936 and 1.5904-1.5918 are pivot points. This is an area that we should look for to establish “Long” position. If market will move below it, don’t be hasty to enter long.
Conclusion:
Long-term.
I still think that market should reach 1.64 area. Monthly bullish context is still valid.
Short term
In the beginning of the coming week I will be track the price action around 1.59-1.5930 area. If market will hold there – the previous highs will be taken out by the price. The nearest target is 1.6113-1.6125 area. This scenario also confirmed by weekly MACDP failure pattern. But you should not to marry any position because market is close to daily overbought level.
The technical portion of Sive's analysis owes a great deal to Joe DiNapoli's methods, and uses a number of Joe's proprietary indicators. Please note that Sive's analysis is his own view of the market and is not endorsed by Joe DiNapoli or any related companies.
Look at this compressed chart #1 – 1.40-1.45 is a long term 0.618 Fib support that holds market since 90’s. In the recent time market has touched this level twice and retraced.
#1
Current monthly trend is bullish. BC move down has been held by 0.786 Fib support from AB leg. Also take a note, that in C point market has tried to turn trend bearish but failed and trend has returned to bullish very fast. For the recent 3 months market is flirting with 0.618 Fib resistance and finally has closed above it. The single target that is currently logic is a nearest one – 0.618 Fib expansion from ABC-bottom pattern at 1.6422 that makes an Agreement with 0.786 Fib resistance. Next target is 100% expansion at 1.7778 that also creates an Agreement with Fib resistance, but it’s not logical now, because it beyond monthly overbought level that is a blue line of Oscillator Predictor on the chart. So, currently we have a single monthly target not far above the market. This upside context will be valid until minimum in C point holds.
#2
Weekly
The situation on weekly time frame has become clearer now. During the previous week the main question was which one support area will hold the market – 1.5385 or 1.5650. Looks like that the latter one has done well. Also I’ve told that MACD Predictor comes in play on recent week, and if I will see MACDP failure pattern - will be much better. So, that has almost happened. Although the value of MACDP for recent week is 15658.95 and the low was 1.5659, I think that we can tell that there is a Stop grabber. It means that previous highs at 1.61 should be taken out by the price. Also take a note, that monthly pivot has held the market well. This is the sign of strength. The next weekly target is 61.8% Fib expansion at 1.6315. November pivot is 1.5918.
Daily
...Couple of important moments here. Daily trend turns bullish. Now all three time frames have confirmed bullish trend. On the chart#1 you can see how daily and weekly Confluence support with monthly pivot point has held the market and we see nice move up. Now, take a look at ABC-bottom pattern. The nearest target is 0.618% Fib expansion at 1.6113 and it just above the previous highs. 100% expansion target at 1.6405 is beyond the daily overbought level and not quite logical currently, but take a note that in very close to our monthly and weekly targets.
The blue line on the chart is Oscillator Predictor that shows level of overbought and market is close to it. I do not know exactly, will market touch target first at 1.6113 and retraced then or retrace first and only then will move to the target. But 4-hour chart analysis tells that the probability of initial retracement not small.
#1
On #2 chart we can see support levels from the recent swing up. I think that the primary level for looking any ‘Buy’ signals around it is 1.5888-1.5918, because it includes monthly and weekly pivots and Fib support level. If bulls are still in charge, market should hold above pivots. At the same time I have to say that daily trend remains bullish even at 5/8 Fib support at 1.5793 and weekly pivot support 1. But, again – moving market below monthly and weekly pivots is a sign of weakness, and I prefer to see that market will hold above them.
#2
4-Hour
This chart looks a bit complicated, so let’s move through it step by step. The red line is MACDP and you can see that 4-hour chart is also bullish and remain bullish until 1.5910 area roughly that precisely coincides with an area between monthly and weekly pivot points. Second of all, look at the first ABC-bottom pattern – market has reach 1.618 Fib expansion at 1.6019 on Friday. Also, market has reached 100% expansion from more recent ABC and exceeded it. It means that market can reach 1.618 expansion at 1.6124 after some retracement lower. This target is very close to daily 1.6113 target and also above the previous highs. It means that with solid probability this highs will not hold.
Now, just below the market 4-hour Confluence support at 1.5932-1.5936 and 1.5904-1.5918 are pivot points. This is an area that we should look for to establish “Long” position. If market will move below it, don’t be hasty to enter long.
Conclusion:
Long-term.
I still think that market should reach 1.64 area. Monthly bullish context is still valid.
Short term
In the beginning of the coming week I will be track the price action around 1.59-1.5930 area. If market will hold there – the previous highs will be taken out by the price. The nearest target is 1.6113-1.6125 area. This scenario also confirmed by weekly MACDP failure pattern. But you should not to marry any position because market is close to daily overbought level.
The technical portion of Sive's analysis owes a great deal to Joe DiNapoli's methods, and uses a number of Joe's proprietary indicators. Please note that Sive's analysis is his own view of the market and is not endorsed by Joe DiNapoli or any related companies.