Sive Morten
Special Consultant to the FPA
- Messages
- 18,644
Monthly
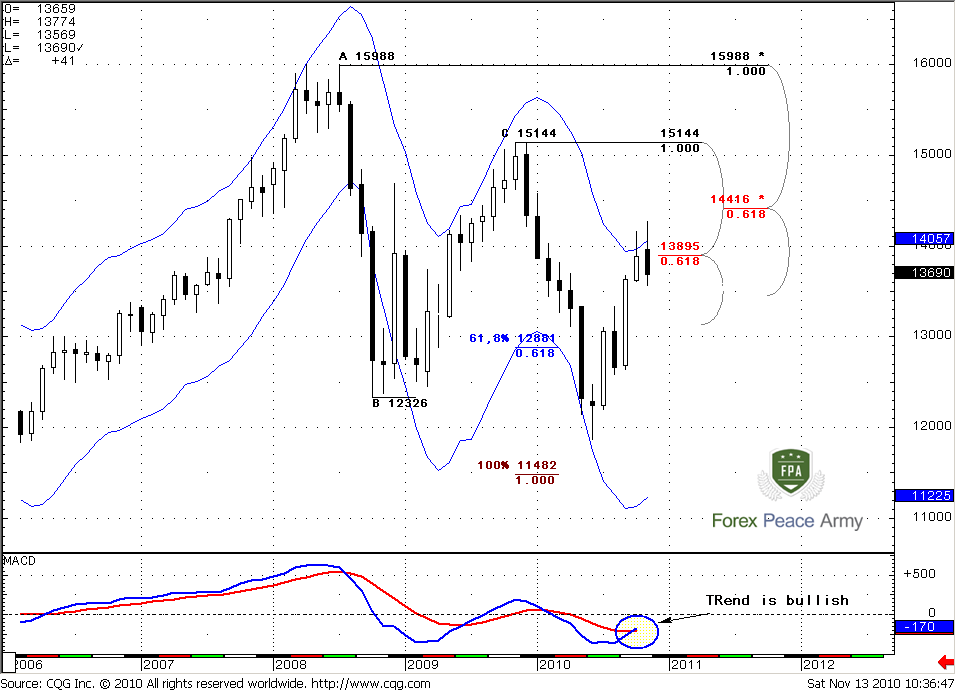
Monthly trend is bullish, but as I’ve said during previous research – this is not the time to establish long-term bullish positions. The blue lines on the chart is Oscillator Predictor and the upper band stands for overbought level. So, we can see that November overbought is 1.4057 level. Market struggles with this for the second month in a row. So, if you’re bullish – that’s fine, but you should buy at pullback, when market will normalize overbought. 1.40 area is also a 50% resistance from whole move down. Market has hit it twice already, so I think that Fib level becomes weaker, but overbought still in place.
The next area of resistance is 1.4416 just above the market.
#1
Weekly
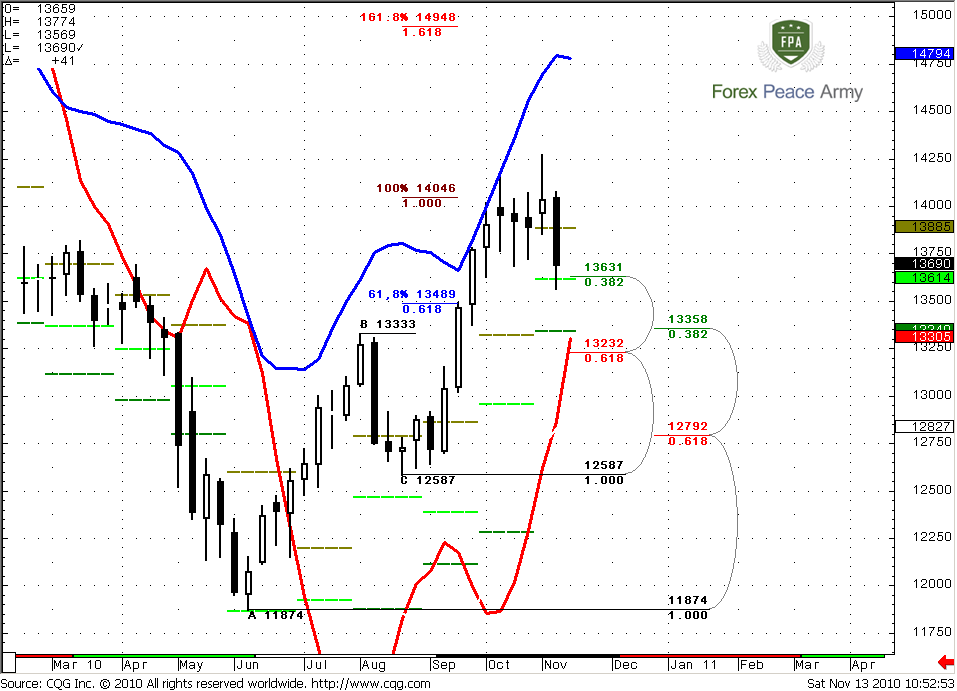
On this time frame however, there are some important changes. Look at initial price action – market has accelerated from 61.8% expansion directly to 100% expansion and hit weekly overbought. Market absolutely disrespected 61.8% target and didn’t even a bounce. Also note, that CD leg is faster than AB. Usually this kind of price action leads to 1.618% Fib expansion target that is at 1.4948, but after meaningful retracement. As a rule the depth of retracement is 5/8 Fib support from the latest swing up. This is at 1.3232-1.3358 area that includes weekly Confluence support, monthly pivot support 2 and previous highs at 1.3333.
Market has moved below monthly pivot and reached the first area of support that we’ve talked during the previous week – around 1.36-1.3650. This is also a monthly pivot support 1. Based on the weekly chart it’s impossible to say – will this area hold the market or not. I can’t exclude the possibility then bulls will return control and reestablish up move from 1.36 area. I treat current move just as retracement lower.
At the same time I do not see any problems with a bit deeper retracement, right to the 1.3230-1.3350 area of support. This level can show the real strength of the market. If bulls are still in charge – market should hold there. Also take the note that MACD Predictor comes in play right in this area. If we will see some MACDP failure patterns – this will add confidence in bull’s strength.
Daily
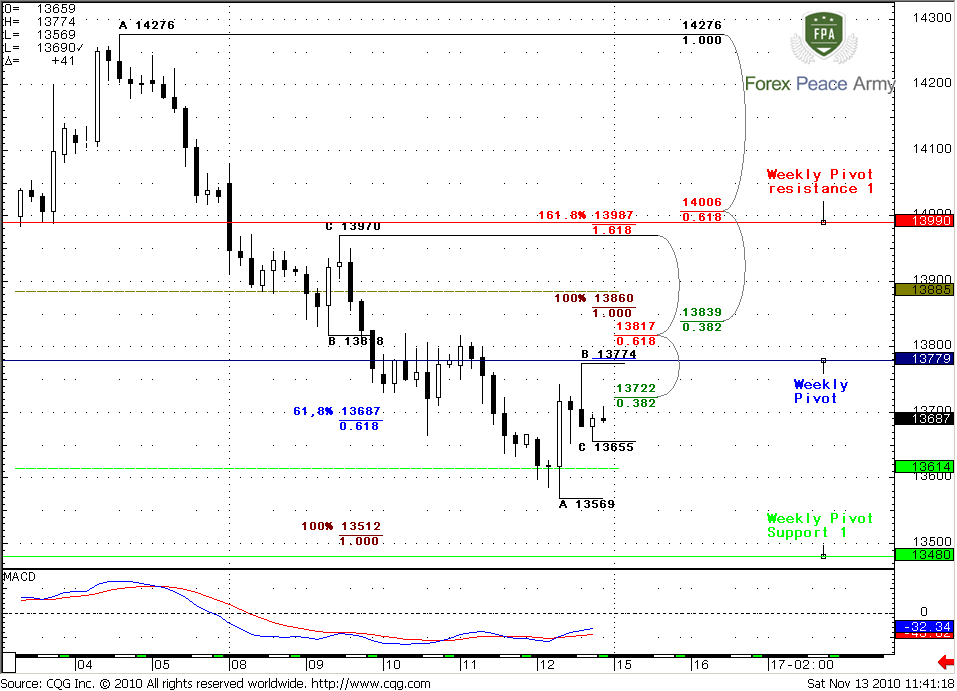
Daily trend is obviously bearish. Usually, when market retraces during bull trend, it retraces to weekly pivot support 1(lime dash lines). During the previous week, however, market has reached weekly pivot support 2 and strong area of support around 1.36-1.3650 that includes monthly pivot support 1, daily Confluence support and weekly pivot support 2. I will not be surprised, if market will show some bounce from this area to the upside. At the same time the sell-off was really straight. Also take a note that 1.618 Fib expansion target is just below the market at 1.3519. I do not feel very comfortable with establishing long position if important Logical Profit objective has not been hit yet.
The main question however is as follows – if market will start move to the upside, will it be just a retracement or it will be continuation of up move on weekly timeframe? Personally, I will use weekly pivot points for that purpose and some intraday Fib levels – I’ll show you my trading plan on 4-hour chart.
Now, the major support levels for coming week are weekly pivot support 1 at 1.3480 and strong area of support at 1.3230-1.3350. By the way, this area also is a target of daily butterfly “Sell” that we’ve discussed on previous week. Furthermore, according to classical technical analysis, if market shows breakout of some trading range to the downside, it should move to the downside at least the width of this range – this is also around 1.33 area.
#1
4-Hour
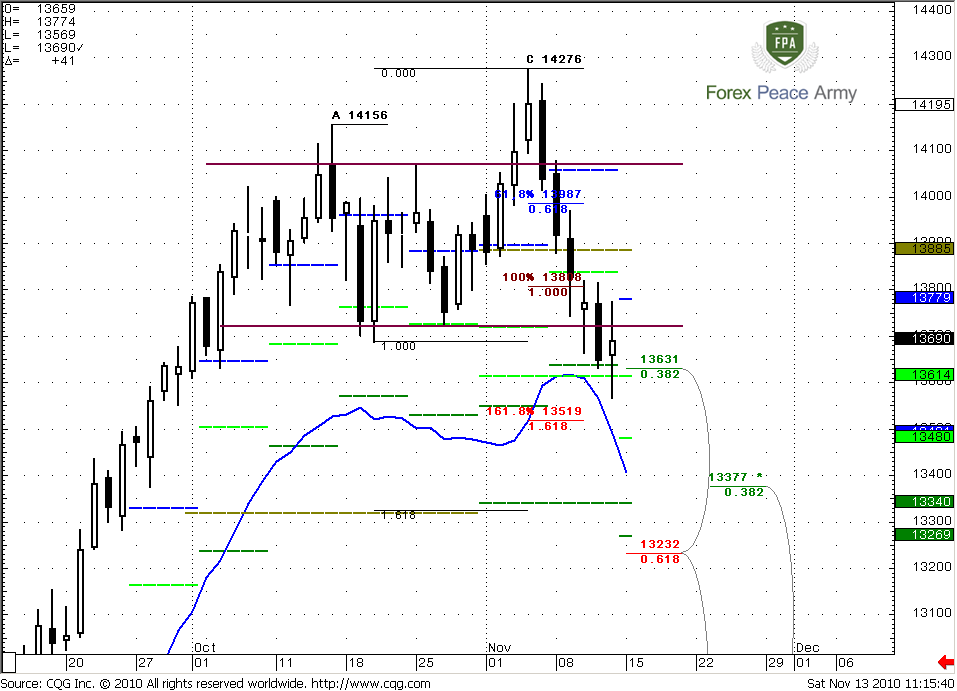
And now the most sophisticated part of research – detail trading plan for the beginning of the coming week. 4-hour trend turns bullish, market stands at strong daily support – monthly pivot support, daily confluence support 1.36-1.3630 area. Market has shown nice bounce on Friday from monthly pivot support. The one thing that worries me is 100% expansion target just below the market at 1.3512. This is also daily 1.618 Fib expansion by the way. As it was with 0.618 Fib expansion, so it could be with 100% Fib target. Market can reach it before starting a retracement up. Also it very close to weekly pivot support 1 at 1.3480.
Just above the market very strong area of resistance at 1.3779-1.3840. That’s the key. This area includes weekly pivot and intraday Fib confluence resistance. Also take a look at small ABC. 0.618 Fib expansion target is at 1.3782 – just above the previous highs. 1.3722 is no longer Fib resistance, because it was broken already. The next target is 100% Expansion at 1.3860 – very close to resistance. Personally I will be watching, how market response in this area. If it will fail there – then it will be just a retracement up, and down move will continue. If it will break it to the upside – then the next short-term target is 1.3987-1.4005 area – 1.618 Fib expansion, weekly pivot resistance 1 and Fib resistance.
Conclusion:
Long-term.
EUR has bullish bias but it overbought at monthly time frame. It’s not the time to establish long-term bullish position. Wait for retracement lower.
Short term
Market has reached first area of weekly support at 1.36. The next and crucial area for up move is at 1.3250-1.3350. Due to overbought at monthly chart, I think that chances of retracement lower is greater, than reestablishing of long-term bull trend currently. At the same time, we can’t exclude the market shifting to trading environment. It means that it will behave well on intraday charts but turn to consolidation on daily time frame.
The technical portion of Sive's analysis owes a great deal to Joe DiNapoli's methods, and uses a number of Joe's proprietary indicators. Please note that Sive's analysis is his own view of the market and is not endorsed by Joe DiNapoli or any related companies.
Monthly trend is bullish, but as I’ve said during previous research – this is not the time to establish long-term bullish positions. The blue lines on the chart is Oscillator Predictor and the upper band stands for overbought level. So, we can see that November overbought is 1.4057 level. Market struggles with this for the second month in a row. So, if you’re bullish – that’s fine, but you should buy at pullback, when market will normalize overbought. 1.40 area is also a 50% resistance from whole move down. Market has hit it twice already, so I think that Fib level becomes weaker, but overbought still in place.
The next area of resistance is 1.4416 just above the market.
#1
Weekly
On this time frame however, there are some important changes. Look at initial price action – market has accelerated from 61.8% expansion directly to 100% expansion and hit weekly overbought. Market absolutely disrespected 61.8% target and didn’t even a bounce. Also note, that CD leg is faster than AB. Usually this kind of price action leads to 1.618% Fib expansion target that is at 1.4948, but after meaningful retracement. As a rule the depth of retracement is 5/8 Fib support from the latest swing up. This is at 1.3232-1.3358 area that includes weekly Confluence support, monthly pivot support 2 and previous highs at 1.3333.
Market has moved below monthly pivot and reached the first area of support that we’ve talked during the previous week – around 1.36-1.3650. This is also a monthly pivot support 1. Based on the weekly chart it’s impossible to say – will this area hold the market or not. I can’t exclude the possibility then bulls will return control and reestablish up move from 1.36 area. I treat current move just as retracement lower.
At the same time I do not see any problems with a bit deeper retracement, right to the 1.3230-1.3350 area of support. This level can show the real strength of the market. If bulls are still in charge – market should hold there. Also take the note that MACD Predictor comes in play right in this area. If we will see some MACDP failure patterns – this will add confidence in bull’s strength.
Daily
Daily trend is obviously bearish. Usually, when market retraces during bull trend, it retraces to weekly pivot support 1(lime dash lines). During the previous week, however, market has reached weekly pivot support 2 and strong area of support around 1.36-1.3650 that includes monthly pivot support 1, daily Confluence support and weekly pivot support 2. I will not be surprised, if market will show some bounce from this area to the upside. At the same time the sell-off was really straight. Also take a note that 1.618 Fib expansion target is just below the market at 1.3519. I do not feel very comfortable with establishing long position if important Logical Profit objective has not been hit yet.
The main question however is as follows – if market will start move to the upside, will it be just a retracement or it will be continuation of up move on weekly timeframe? Personally, I will use weekly pivot points for that purpose and some intraday Fib levels – I’ll show you my trading plan on 4-hour chart.
Now, the major support levels for coming week are weekly pivot support 1 at 1.3480 and strong area of support at 1.3230-1.3350. By the way, this area also is a target of daily butterfly “Sell” that we’ve discussed on previous week. Furthermore, according to classical technical analysis, if market shows breakout of some trading range to the downside, it should move to the downside at least the width of this range – this is also around 1.33 area.
#1
4-Hour
And now the most sophisticated part of research – detail trading plan for the beginning of the coming week. 4-hour trend turns bullish, market stands at strong daily support – monthly pivot support, daily confluence support 1.36-1.3630 area. Market has shown nice bounce on Friday from monthly pivot support. The one thing that worries me is 100% expansion target just below the market at 1.3512. This is also daily 1.618 Fib expansion by the way. As it was with 0.618 Fib expansion, so it could be with 100% Fib target. Market can reach it before starting a retracement up. Also it very close to weekly pivot support 1 at 1.3480.
Just above the market very strong area of resistance at 1.3779-1.3840. That’s the key. This area includes weekly pivot and intraday Fib confluence resistance. Also take a look at small ABC. 0.618 Fib expansion target is at 1.3782 – just above the previous highs. 1.3722 is no longer Fib resistance, because it was broken already. The next target is 100% Expansion at 1.3860 – very close to resistance. Personally I will be watching, how market response in this area. If it will fail there – then it will be just a retracement up, and down move will continue. If it will break it to the upside – then the next short-term target is 1.3987-1.4005 area – 1.618 Fib expansion, weekly pivot resistance 1 and Fib resistance.
Conclusion:
Long-term.
EUR has bullish bias but it overbought at monthly time frame. It’s not the time to establish long-term bullish position. Wait for retracement lower.
Short term
Market has reached first area of weekly support at 1.36. The next and crucial area for up move is at 1.3250-1.3350. Due to overbought at monthly chart, I think that chances of retracement lower is greater, than reestablishing of long-term bull trend currently. At the same time, we can’t exclude the market shifting to trading environment. It means that it will behave well on intraday charts but turn to consolidation on daily time frame.
The technical portion of Sive's analysis owes a great deal to Joe DiNapoli's methods, and uses a number of Joe's proprietary indicators. Please note that Sive's analysis is his own view of the market and is not endorsed by Joe DiNapoli or any related companies.
")