Sive Morten
Special Consultant to the FPA
- Messages
- 18,662
Monthly
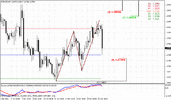
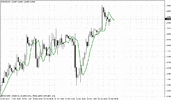
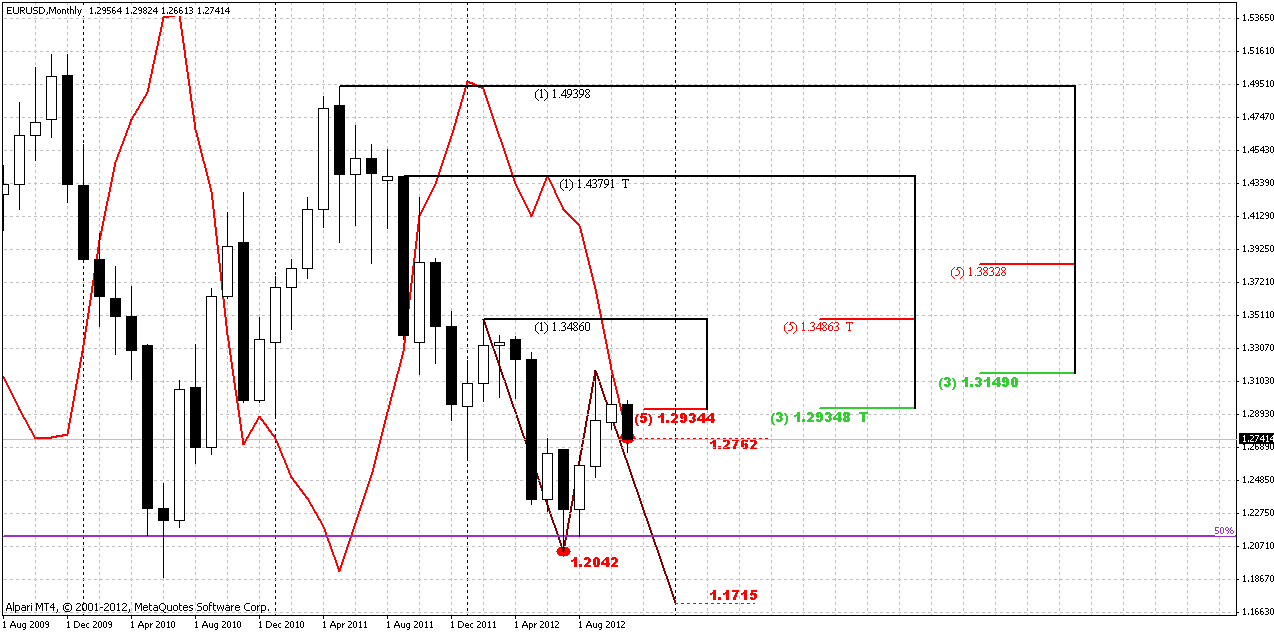
Monthly chart has not changed much, thus, all issues that we’ve specified previously are still valid. Now it is clear that market has stuck in monthly Confluence resistance area 1.2934-1.3149. In current moment, looking at pullback outside of it, we can suggest that the first challenge was unsuccessful, but will follow the next one? We can’t exclude this absolutely. For instance, some sort of double bottom could be formed, or something like that, we don’t know. I prefer to talk about it stick to the subject, that we do not have yet.
What is more important for us is that definitely some downward move should come. Since this is monthly time frame, this move could be really significant. Even if we mostly trade on daily and intraday charts, we could get definite direction for long-term perspective. That’s why higher time frames are important.
Now, pay attention to MACD Predictor. November bar stands very close to it, and by November open price trend has turned bullish. The trend breakeven point for current month is 1.2762, and take a look – price now stands below it. If monthly bar will close below this level we will get bearish stop grabber on monthly chart with minimum target – clearing of 1.2042 low. Since 1.2042 stands below 0.618 target of drawn AB=CD pattern, it’s a high probability that market will proceed to 1.17 area initially – target of AB=CD. 1.17 in turn, stands slightly lower previous long-term 2010 lows. Just imagine what will happen, if market will trigger stops below it. We easily could get achievement of our long term 1.15-1.16 target.
But let’s pass from one to another gradually. Our first task on monthly is to wait for November close. Let’s get stop grabber first and only after that will discuss other things.
Weekly
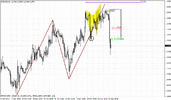
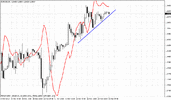
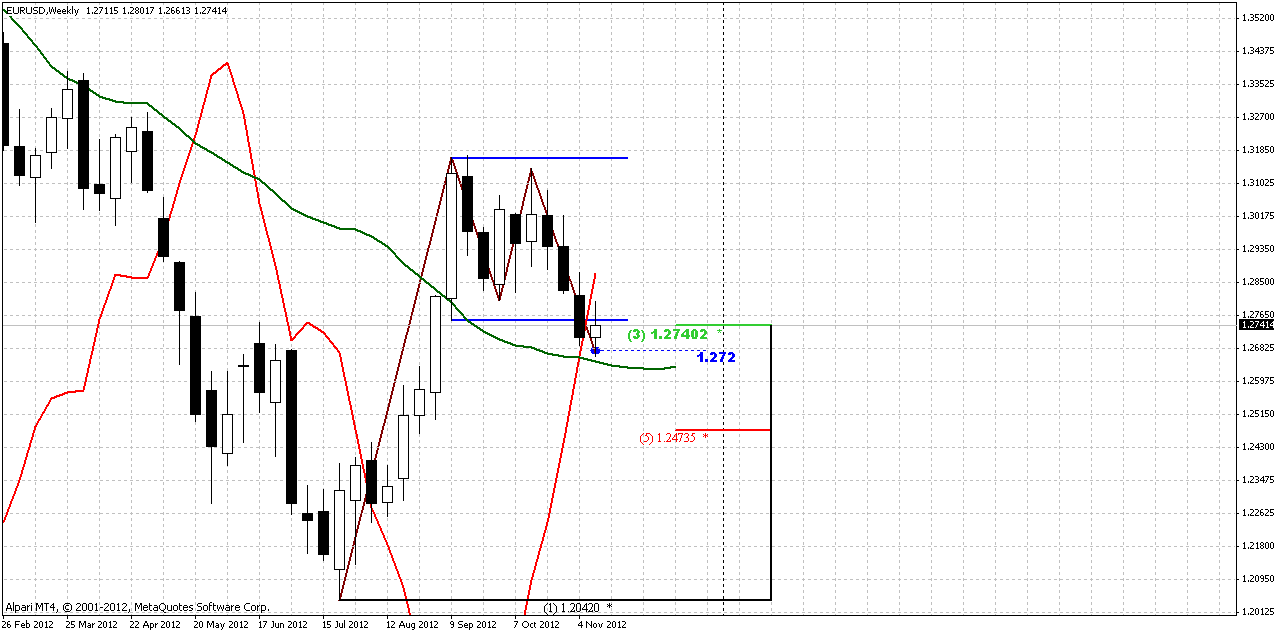
Well, guys, weekly chart still holds us with indecision. Although trend has turned bearish, price action was tight and some sort of spin has formed right inside of the range between 25x5 DMA and lower border of previous trading range. Although market has challenged it during the week – price has failed there and returned right back. What comments can I add with just small inside candle on weekly chart? Only the same one – until market will hold inside of this range – 1.2640-1.2750, we will not be able take any position based on weekly chart and could trade exclusively on lower time frames.
There is no need to repeat that if market will return back into the coil – it could be “222” buy and retest of 25x5 after breakout. This is extremely bullish scenario, that could lead to significant move up. Conversely, downward move could lead to downward continuation inside on 1.5 year channel on weekly chart and lead price to 1.17 area.
Daily
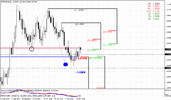
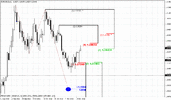
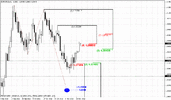
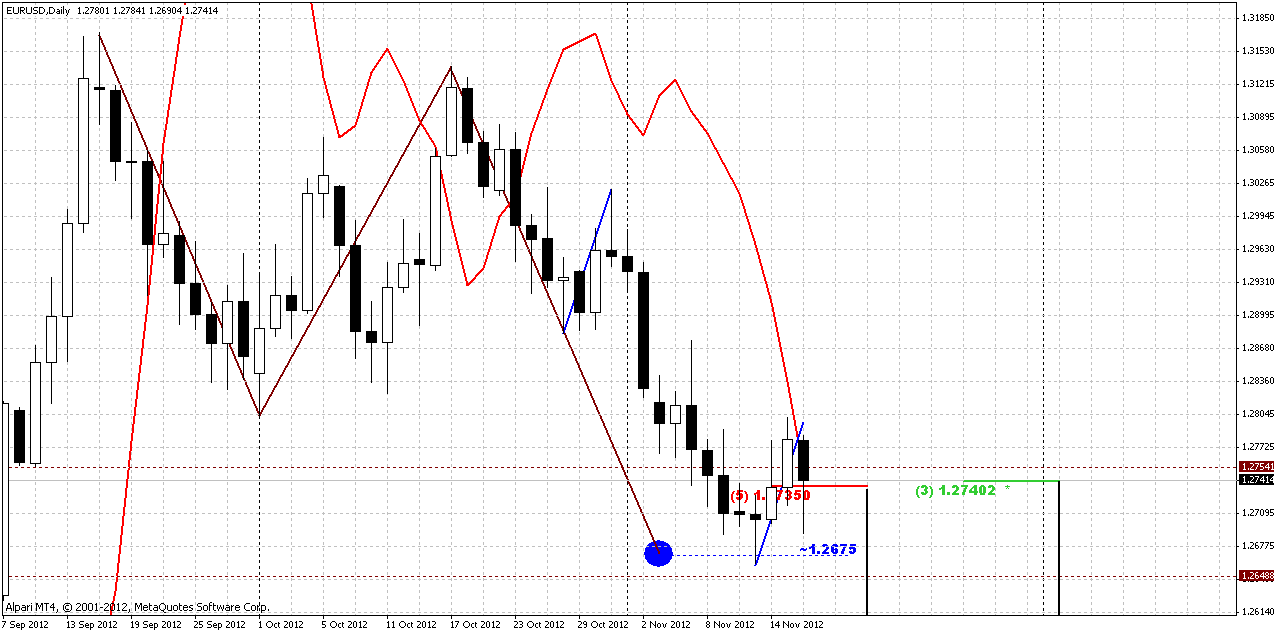
So it’s look like we can do nothing but focus on daily and lower time frames, and that is really makes sense, since we have something interesting here. First of all, market has done attempt to hold retracement harmony – recall these two blue cloned lines. They have the same slope and length. It means that market has found resistance precisely at the same distance as previously. Second – we’ve got bearish stop grabber, the pattern that we could stick with in the beginning of the coming week. The failure point of this pattern is its high price. Target is a previous swing low – around 1.2640. That is, in turn the level of weekly 25x5. Also take a look – market has returned right back again below 1.2750 area.
So, trend holds bearish, we have bearish pattern, probably we should search possibility to enter short.
4-hour
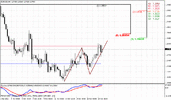
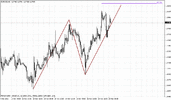
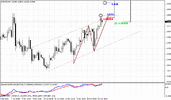
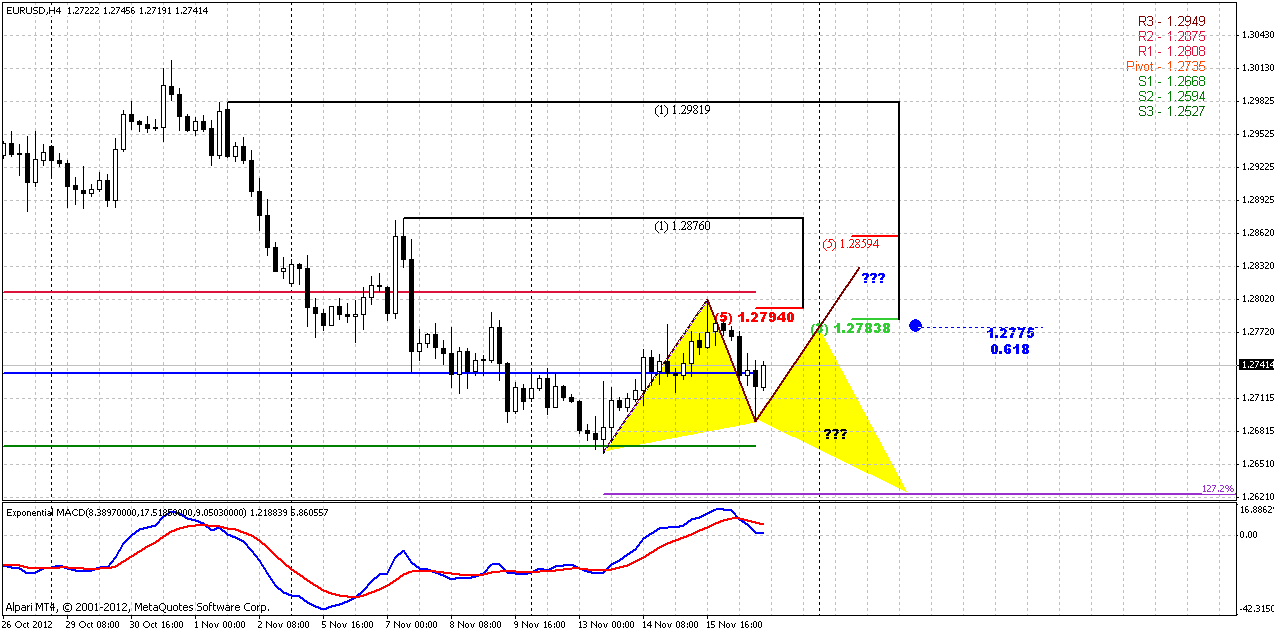
Here is potential risk for daily stop grabber pattern – upward AB=CD that we’ve discussed previously. Although currently not much points on it’s advantage, since both trends has turned bearish, we need to analyze this possibility as well. So, how we can combine both of them? I see only single possibility of this. That will happen if this will be only 0.618 AB=CD, since this level stands below the lows of stop grabber. That sort of development also could lead to Butterfly “Buy” here with target around 1.2635. Still, perfectly if there will not be any upward AB=CD of cause. This scenario we will discuss lower.
Also take a look at pivots. Market should open right at WPP=1.2735, WPS1 stands very close to weekly 25x5 and gives additional support. So, in short term perspective it’s better to use 1.2640 as short-term target, while we will not get any other patterns that will allow us to estimate it with more precision.
1-hour
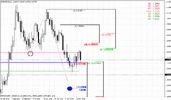
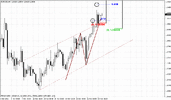
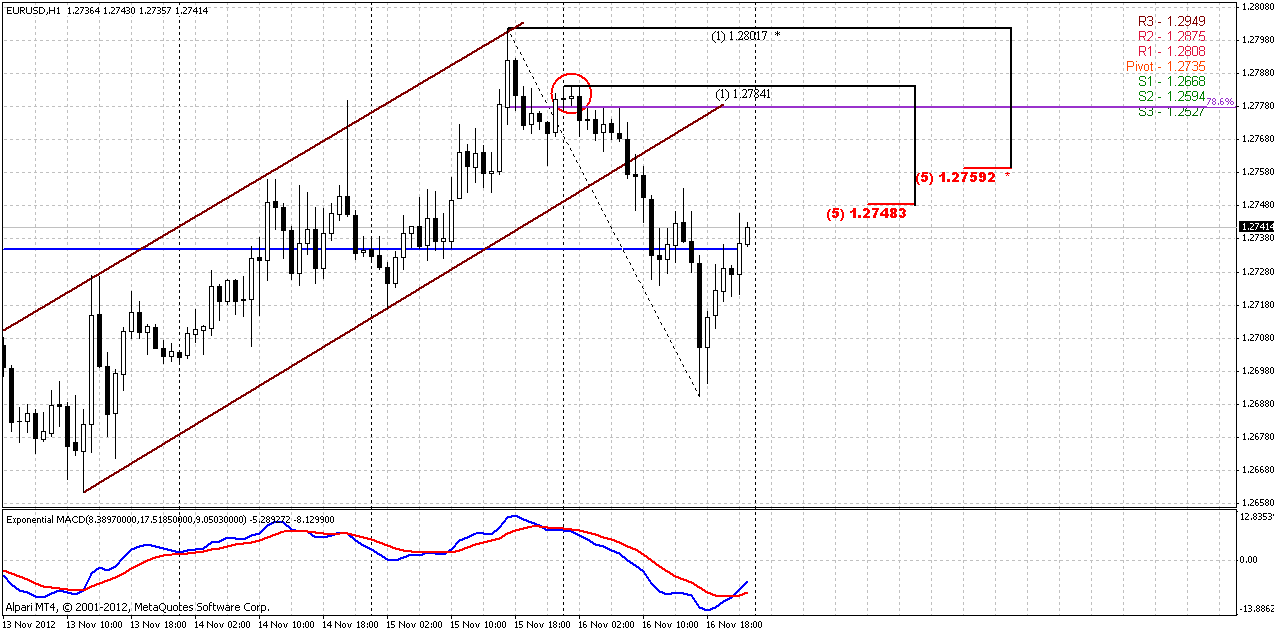
Trend is bullish here. Hourly picture gives us potential levels to watch for short entry. Red circle is a high of daily stop grabber and our working thrust. So, if there still will be AB-CD up, then we should keep an eye on 1.2775 that is Agreement of 0.618 AB=CD target and deep 0.786 resistance level. That development has a lot of chances to shift into Butterfly pattern on 4-hour chart.
IF this will not be any AB-CD’s up, then two closer levels are possible. Both of them 0.618 but from different swings.
Conclusion:
Coming week again will be for short-term trading. In the beginning of the week our primary object is daily Stop grabber pattern that could be realized as Butterfly “buy” on 4-hour chart. Potential levels to watch for short entry are 1.2750-1.2760 or Agreement at 1.2775. Failure point of stop grabber is high at 1.2784, but butterfly failure point stands a bit higher – 1.2802.
The technical portion of Sive's analysis owes a great deal to Joe DiNapoli's methods, and uses a number of Joe's proprietary indicators. Please note that Sive's analysis is his own view of the market and is not endorsed by Joe DiNapoli or any related companies.
Monthly chart has not changed much, thus, all issues that we’ve specified previously are still valid. Now it is clear that market has stuck in monthly Confluence resistance area 1.2934-1.3149. In current moment, looking at pullback outside of it, we can suggest that the first challenge was unsuccessful, but will follow the next one? We can’t exclude this absolutely. For instance, some sort of double bottom could be formed, or something like that, we don’t know. I prefer to talk about it stick to the subject, that we do not have yet.
What is more important for us is that definitely some downward move should come. Since this is monthly time frame, this move could be really significant. Even if we mostly trade on daily and intraday charts, we could get definite direction for long-term perspective. That’s why higher time frames are important.
Now, pay attention to MACD Predictor. November bar stands very close to it, and by November open price trend has turned bullish. The trend breakeven point for current month is 1.2762, and take a look – price now stands below it. If monthly bar will close below this level we will get bearish stop grabber on monthly chart with minimum target – clearing of 1.2042 low. Since 1.2042 stands below 0.618 target of drawn AB=CD pattern, it’s a high probability that market will proceed to 1.17 area initially – target of AB=CD. 1.17 in turn, stands slightly lower previous long-term 2010 lows. Just imagine what will happen, if market will trigger stops below it. We easily could get achievement of our long term 1.15-1.16 target.
But let’s pass from one to another gradually. Our first task on monthly is to wait for November close. Let’s get stop grabber first and only after that will discuss other things.

Weekly
Well, guys, weekly chart still holds us with indecision. Although trend has turned bearish, price action was tight and some sort of spin has formed right inside of the range between 25x5 DMA and lower border of previous trading range. Although market has challenged it during the week – price has failed there and returned right back. What comments can I add with just small inside candle on weekly chart? Only the same one – until market will hold inside of this range – 1.2640-1.2750, we will not be able take any position based on weekly chart and could trade exclusively on lower time frames.
There is no need to repeat that if market will return back into the coil – it could be “222” buy and retest of 25x5 after breakout. This is extremely bullish scenario, that could lead to significant move up. Conversely, downward move could lead to downward continuation inside on 1.5 year channel on weekly chart and lead price to 1.17 area.

Daily
So it’s look like we can do nothing but focus on daily and lower time frames, and that is really makes sense, since we have something interesting here. First of all, market has done attempt to hold retracement harmony – recall these two blue cloned lines. They have the same slope and length. It means that market has found resistance precisely at the same distance as previously. Second – we’ve got bearish stop grabber, the pattern that we could stick with in the beginning of the coming week. The failure point of this pattern is its high price. Target is a previous swing low – around 1.2640. That is, in turn the level of weekly 25x5. Also take a look – market has returned right back again below 1.2750 area.
So, trend holds bearish, we have bearish pattern, probably we should search possibility to enter short.

4-hour
Here is potential risk for daily stop grabber pattern – upward AB=CD that we’ve discussed previously. Although currently not much points on it’s advantage, since both trends has turned bearish, we need to analyze this possibility as well. So, how we can combine both of them? I see only single possibility of this. That will happen if this will be only 0.618 AB=CD, since this level stands below the lows of stop grabber. That sort of development also could lead to Butterfly “Buy” here with target around 1.2635. Still, perfectly if there will not be any upward AB=CD of cause. This scenario we will discuss lower.
Also take a look at pivots. Market should open right at WPP=1.2735, WPS1 stands very close to weekly 25x5 and gives additional support. So, in short term perspective it’s better to use 1.2640 as short-term target, while we will not get any other patterns that will allow us to estimate it with more precision.

1-hour
Trend is bullish here. Hourly picture gives us potential levels to watch for short entry. Red circle is a high of daily stop grabber and our working thrust. So, if there still will be AB-CD up, then we should keep an eye on 1.2775 that is Agreement of 0.618 AB=CD target and deep 0.786 resistance level. That development has a lot of chances to shift into Butterfly pattern on 4-hour chart.
IF this will not be any AB-CD’s up, then two closer levels are possible. Both of them 0.618 but from different swings.

Conclusion:
Coming week again will be for short-term trading. In the beginning of the week our primary object is daily Stop grabber pattern that could be realized as Butterfly “buy” on 4-hour chart. Potential levels to watch for short entry are 1.2750-1.2760 or Agreement at 1.2775. Failure point of stop grabber is high at 1.2784, but butterfly failure point stands a bit higher – 1.2802.
The technical portion of Sive's analysis owes a great deal to Joe DiNapoli's methods, and uses a number of Joe's proprietary indicators. Please note that Sive's analysis is his own view of the market and is not endorsed by Joe DiNapoli or any related companies.
