Sive Morten
Special Consultant to the FPA
- Messages
- 18,621
Monthly
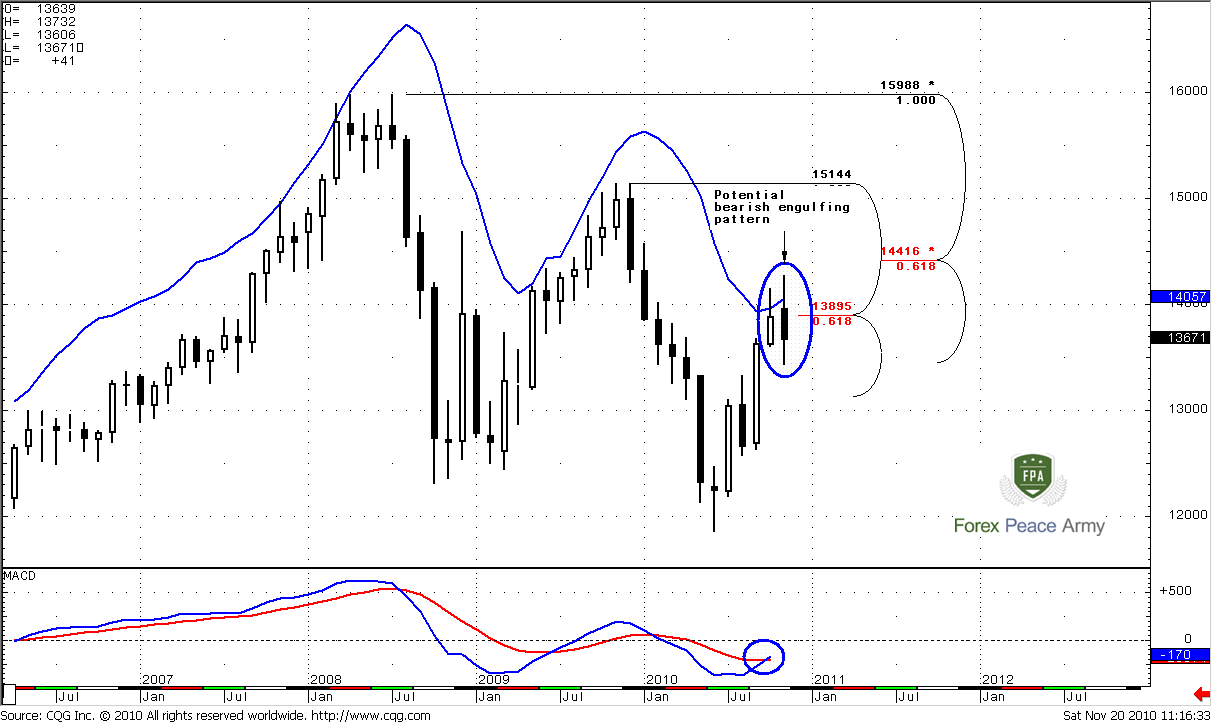
Monthly trend is bullish, but as I’ve said during couple of previously made researches – this is not the time to establish long-term bullish positions. The blue line on the chart is an upper border of Oscillator Predictor that shows overbought level. So, we can see that November overbought is 1.4057 level. Market struggles with this for the second month in a row. So, if you’re bullish – that’s fine, but you should buy at pullback, when market will normalize overbought. 1.40 area is also a 50% resistance from whole move down. Market has hit it twice already, so I think that 1.39 Fib level has been canceled already by the price, but overbought still in place. In general combination of Fib resistance and overbought is a DiNapoli Stretch “Sell” pattern. The major problem with it, however, is that you have to trade against the trend.
The next area of resistance is 1.4416 just above the market – 5/8 Fib resistance from a major high. Also, take a note, that if market will close below 1.36 area - this will be a bearish engulfing pattern on the monthly chart.
#1
Weekly
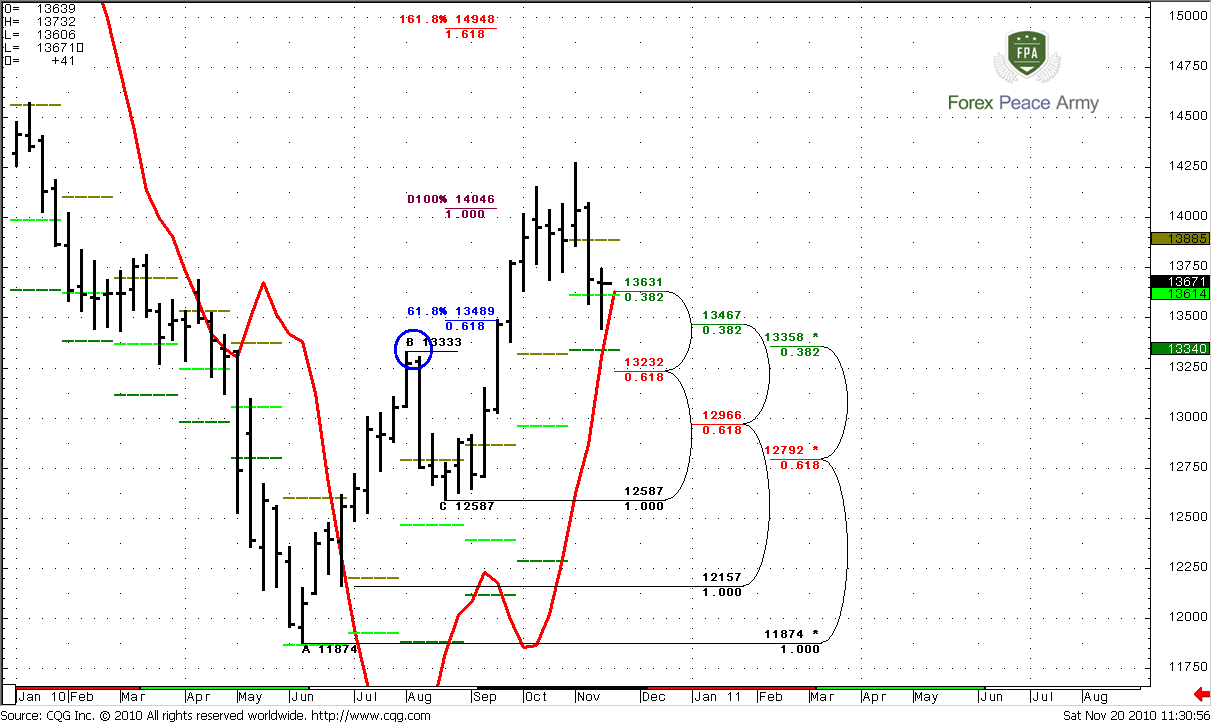
On this time frame however, there are some important changes. Look at initial price action – market has accelerated from 61.8% expansion directly to 100% expansion and hit weekly overbought. Market absolutely disrespected 61.8% target and didn’t even a bounce. Also note, that CD leg is faster than AB. Usually this kind of price action leads to 1.618% Fib expansion target that is at 1.4948, but after meaningful retracement. As a rule the depth of retracement is 5/8 Fib support from the latest swing up. This is at 1.3232-1.3358 area that includes weekly Confluence support, monthly pivot support 2 and previous highs at 1.3333.
Market has moved below monthly pivot and reached the first area of support that we’ve talked during the previous week – around 1.36-1.3650. I think that 1.3630 no more the Fib support, because penetration was too deep. The next Fib support is 1.3467 that has been touched once already. Also, there is a nice example how monthly pivot support holds the market. During the previous week we didn’t see MACD Predictor failure pattern that could give us a confidence of a further move up. But MACDP comes in play again on current week. Currently trend is bullish. The strong support that I treat as an ultimate level that should hold market from deeper move down is just below the market. This is 1.3232-1.3360 and includes weekly Fib Confluence support, previous highs and weekly pivot support 2. Also, as we’ve talked about it in daily videos – target of daily Butterfly “Buy” pattern. Bulls should hold it, or further up move will be under question.
Daily
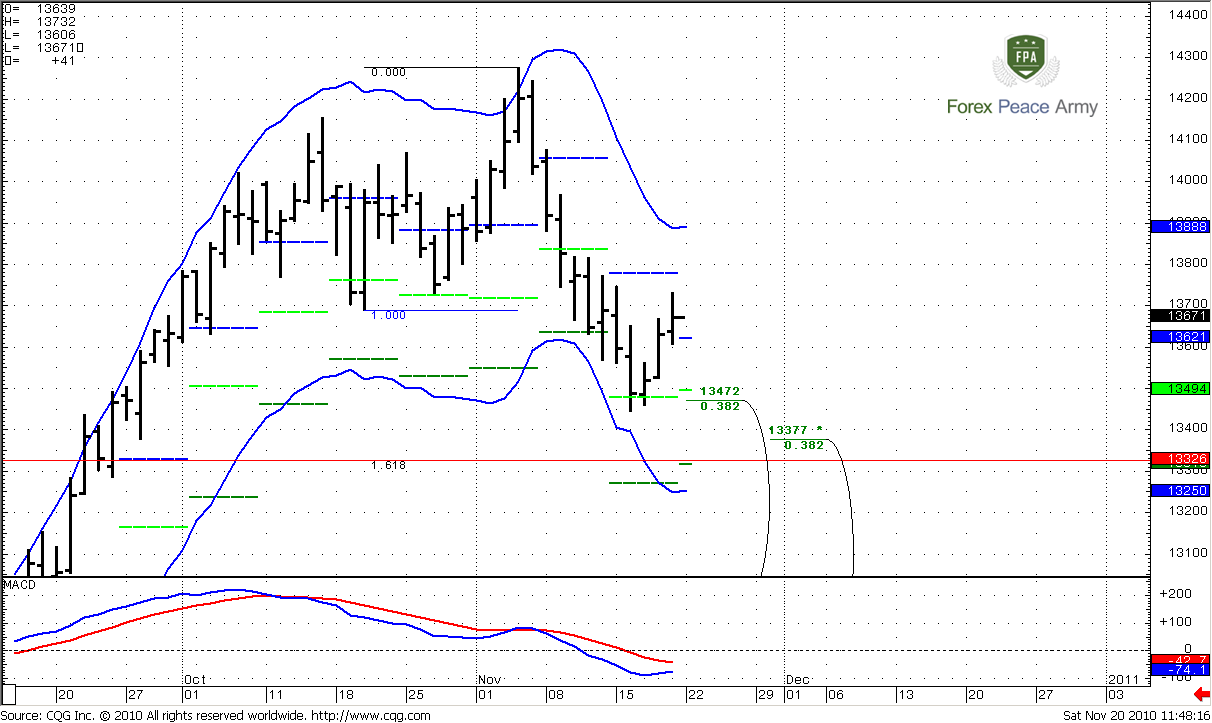
Daily trend is obviously bearish. As you can see, market stands just in the middle between blue lines of Oscillator Predictor. It means that market neither oversold nor overbought currently. Chart #1 has nothing new for those of you, who watch my daily videos regularly. Nice thrust down, market has not traded weekly pivot (blue dash line) and moves directly to weekly pivot support 1 (lime dash line). Also this is a Fib support 1.3472. This area has held the market and it shows retracement up.
#1
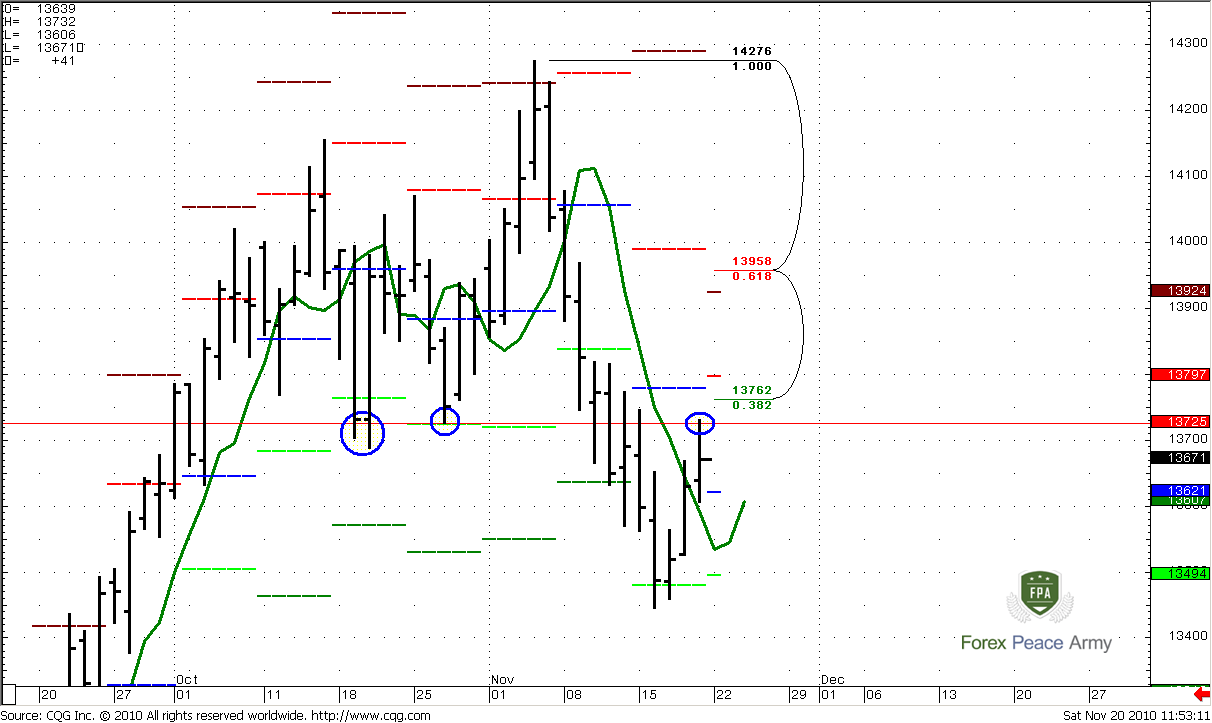
Chart#2 contains more important details that it seems for the first view. First of all, you can see how market protects previous area of consolidation (circles). Market has hit 1.3725 and pulled back, even not reached 1.3762 Fib resistance. Now, for coming week – 1.3621 is weekly pivot point, 1.3494 weekly pivot support 1 and 1.3797 weekly pivot resistance 1.
Second issue is a context for possible Bread & Butter Sell. The green line on the chart is 3x3 DMA. Market has closed above 3x3 for the first time during whole sell-off and almost reached Fib resistance. Thrust itself not very impressive it has minimum required number of bars (usually I prefer to see more bars in thrust to trade B&B), but it could work still. You may use this signal just for intraday B&B or to hold this position a bit longer. Now couple of important moments – where to enter, and what to do depending on market price action.
#2
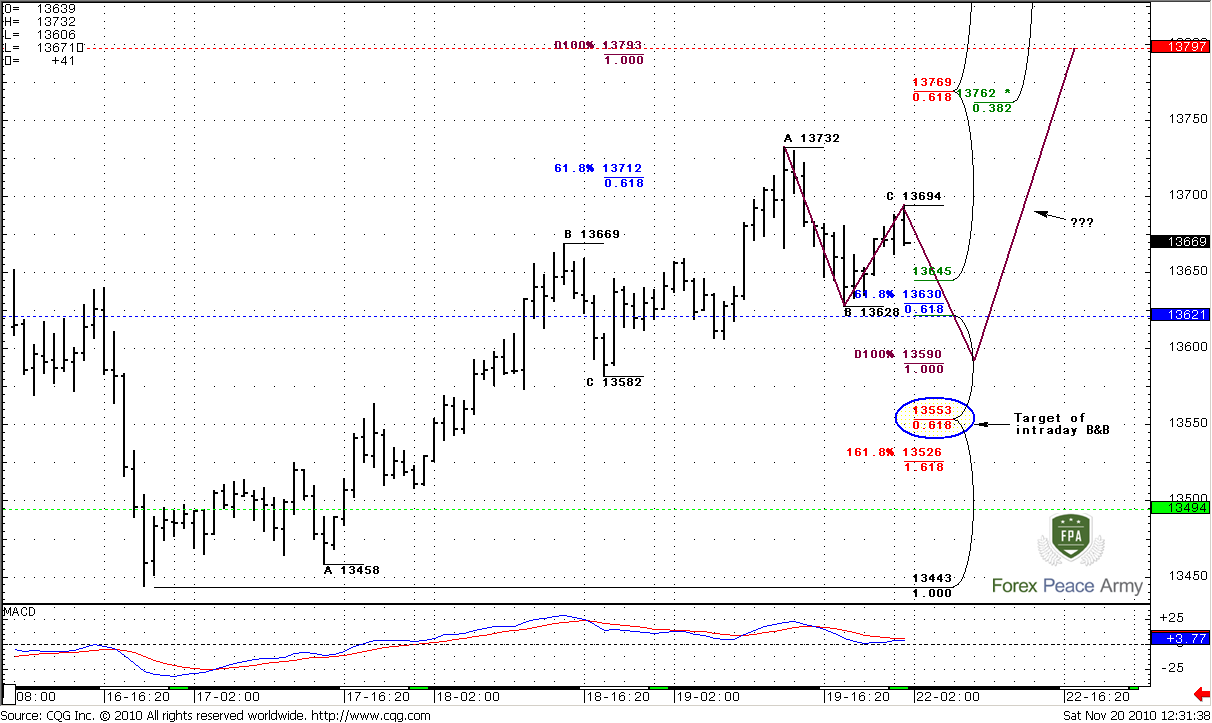
1-Hour
Hourly trend turns bearish. Market shows nice move up, has hit 0.618 Fib expansion target and started a retracement. The next target up is at 1.3793 just above hourly confluence resistance 1.3762-1.3769. 1.3797 – weekly resistance 1 – nice area to place a stop order. This is a really strong resistance and daily B&B should start from there if market will reach it. The question about “where to enter” is a bit more complicated. Look, market has started retracements down. From this recent ABC-top 0.618 expansion target is 1.3630, 1.3620 is hourly Fib support and weekly pivot point. 100% expansion target is at 1.3590. So, there could be couple of scenarios - market will hit the first target and turn to the upside, or accomplish 100% target by piercing pivot and Fib support and then also turn up. If market will break pivot to the downside and stay there – don’t be long. It will mean that B&B has already happened and it’s too late for this party. The one thing that still will have the sense is to enter in continuation of down move.
That’s being said – if market will hold 1.3590 area and continue move up – Sell from 1.3770-1.3790, target 1.3560, stop loss above 1.3810. Or, if you’re positional trader – you can keep that position a bit longer, just shift stop to breakeven and look, how market will break the previous lows. Also I do not see any problems in scalping from 1.3590 to 1.3770, if this kind of trade is suitable for you. But again – if market will hold below pivot – don’t be long.
The technical portion of Sive's analysis owes a great deal to Joe DiNapoli's methods, and uses a number of Joe's proprietary indicators. Please note that Sive's analysis is his own view of the market and is not endorsed by Joe DiNapoli or any related companies
Monthly trend is bullish, but as I’ve said during couple of previously made researches – this is not the time to establish long-term bullish positions. The blue line on the chart is an upper border of Oscillator Predictor that shows overbought level. So, we can see that November overbought is 1.4057 level. Market struggles with this for the second month in a row. So, if you’re bullish – that’s fine, but you should buy at pullback, when market will normalize overbought. 1.40 area is also a 50% resistance from whole move down. Market has hit it twice already, so I think that 1.39 Fib level has been canceled already by the price, but overbought still in place. In general combination of Fib resistance and overbought is a DiNapoli Stretch “Sell” pattern. The major problem with it, however, is that you have to trade against the trend.
The next area of resistance is 1.4416 just above the market – 5/8 Fib resistance from a major high. Also, take a note, that if market will close below 1.36 area - this will be a bearish engulfing pattern on the monthly chart.
#1
Weekly
On this time frame however, there are some important changes. Look at initial price action – market has accelerated from 61.8% expansion directly to 100% expansion and hit weekly overbought. Market absolutely disrespected 61.8% target and didn’t even a bounce. Also note, that CD leg is faster than AB. Usually this kind of price action leads to 1.618% Fib expansion target that is at 1.4948, but after meaningful retracement. As a rule the depth of retracement is 5/8 Fib support from the latest swing up. This is at 1.3232-1.3358 area that includes weekly Confluence support, monthly pivot support 2 and previous highs at 1.3333.
Market has moved below monthly pivot and reached the first area of support that we’ve talked during the previous week – around 1.36-1.3650. I think that 1.3630 no more the Fib support, because penetration was too deep. The next Fib support is 1.3467 that has been touched once already. Also, there is a nice example how monthly pivot support holds the market. During the previous week we didn’t see MACD Predictor failure pattern that could give us a confidence of a further move up. But MACDP comes in play again on current week. Currently trend is bullish. The strong support that I treat as an ultimate level that should hold market from deeper move down is just below the market. This is 1.3232-1.3360 and includes weekly Fib Confluence support, previous highs and weekly pivot support 2. Also, as we’ve talked about it in daily videos – target of daily Butterfly “Buy” pattern. Bulls should hold it, or further up move will be under question.
Daily
Daily trend is obviously bearish. As you can see, market stands just in the middle between blue lines of Oscillator Predictor. It means that market neither oversold nor overbought currently. Chart #1 has nothing new for those of you, who watch my daily videos regularly. Nice thrust down, market has not traded weekly pivot (blue dash line) and moves directly to weekly pivot support 1 (lime dash line). Also this is a Fib support 1.3472. This area has held the market and it shows retracement up.
#1
Chart#2 contains more important details that it seems for the first view. First of all, you can see how market protects previous area of consolidation (circles). Market has hit 1.3725 and pulled back, even not reached 1.3762 Fib resistance. Now, for coming week – 1.3621 is weekly pivot point, 1.3494 weekly pivot support 1 and 1.3797 weekly pivot resistance 1.
Second issue is a context for possible Bread & Butter Sell. The green line on the chart is 3x3 DMA. Market has closed above 3x3 for the first time during whole sell-off and almost reached Fib resistance. Thrust itself not very impressive it has minimum required number of bars (usually I prefer to see more bars in thrust to trade B&B), but it could work still. You may use this signal just for intraday B&B or to hold this position a bit longer. Now couple of important moments – where to enter, and what to do depending on market price action.
#2
1-Hour
Hourly trend turns bearish. Market shows nice move up, has hit 0.618 Fib expansion target and started a retracement. The next target up is at 1.3793 just above hourly confluence resistance 1.3762-1.3769. 1.3797 – weekly resistance 1 – nice area to place a stop order. This is a really strong resistance and daily B&B should start from there if market will reach it. The question about “where to enter” is a bit more complicated. Look, market has started retracements down. From this recent ABC-top 0.618 expansion target is 1.3630, 1.3620 is hourly Fib support and weekly pivot point. 100% expansion target is at 1.3590. So, there could be couple of scenarios - market will hit the first target and turn to the upside, or accomplish 100% target by piercing pivot and Fib support and then also turn up. If market will break pivot to the downside and stay there – don’t be long. It will mean that B&B has already happened and it’s too late for this party. The one thing that still will have the sense is to enter in continuation of down move.
That’s being said – if market will hold 1.3590 area and continue move up – Sell from 1.3770-1.3790, target 1.3560, stop loss above 1.3810. Or, if you’re positional trader – you can keep that position a bit longer, just shift stop to breakeven and look, how market will break the previous lows. Also I do not see any problems in scalping from 1.3590 to 1.3770, if this kind of trade is suitable for you. But again – if market will hold below pivot – don’t be long.
The technical portion of Sive's analysis owes a great deal to Joe DiNapoli's methods, and uses a number of Joe's proprietary indicators. Please note that Sive's analysis is his own view of the market and is not endorsed by Joe DiNapoli or any related companies
")