Sive Morten
Special Consultant to the FPA
- Messages
- 18,648
Monthly
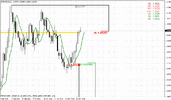
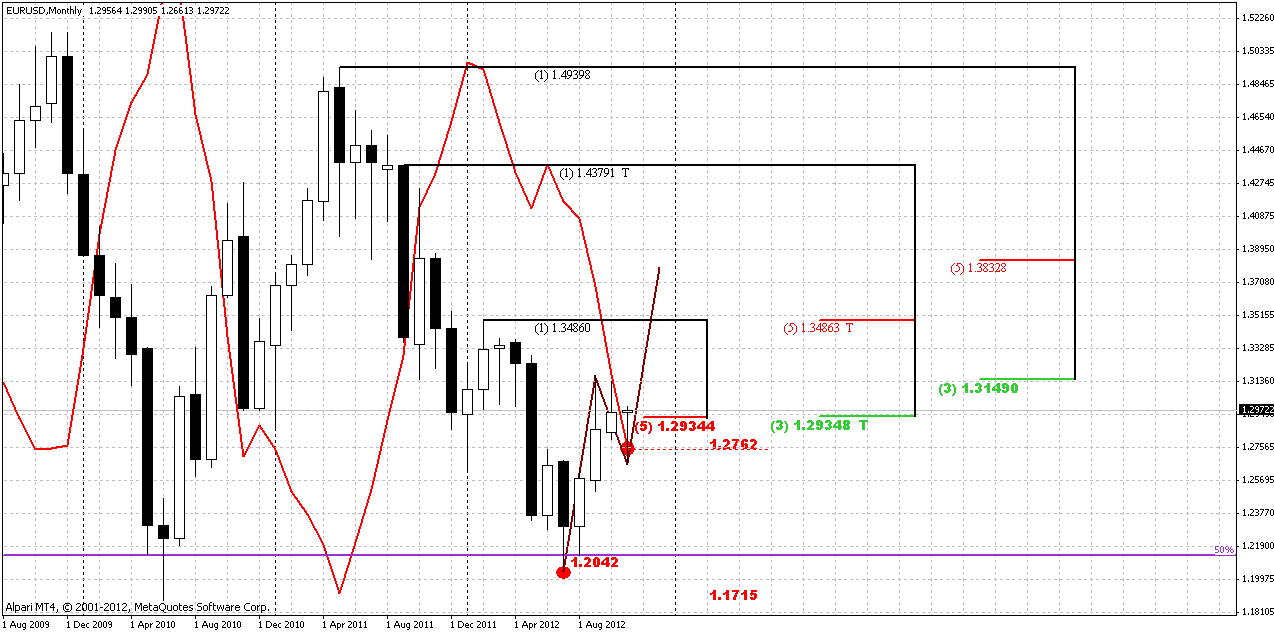
As you can see on monthly chart situation has changed drastically again. That is particular important, since we’re entering in final November’s week. Just on previous week we’ve discussed potential bearish stop grabber here, if market will close lower than 1.2762, but now we have no sign of it. Market has returned right back inside of 1.2934-1.3149 area K-resistance. That is significantly sophisticates overall picture, so that we even could get lightning bolt AB-CD right to 1.38 Agreement. Probably intrigue will hold right to November close – market still has time to return right back again. It does tell us that currently it’s not the time for long-term position. We need to get clarity – will K-resistance finally stop retracement up or not. Unfortunately monthly chart can’t help much us now.
Weekly
This time frame gives us really tough picture, and major question, will we have enough courage to accept these possible drastical changes. And should we accept it? May be it’s too early? Now let’s go right to the point.
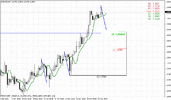
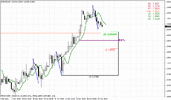
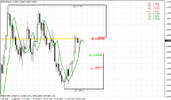
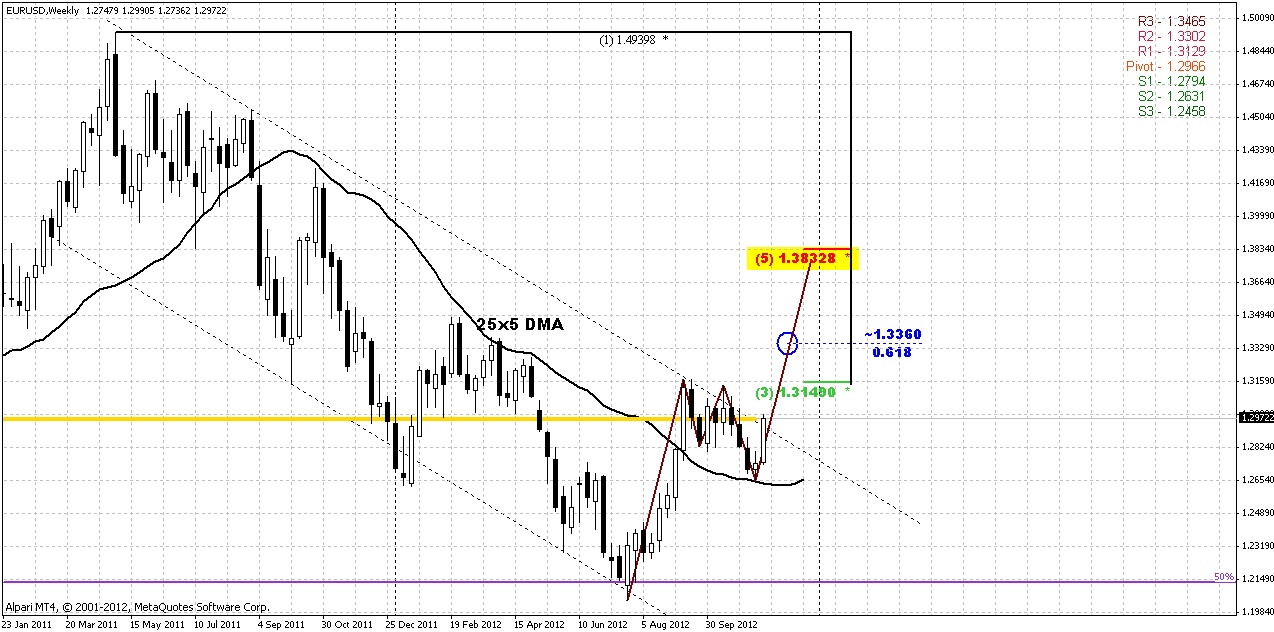
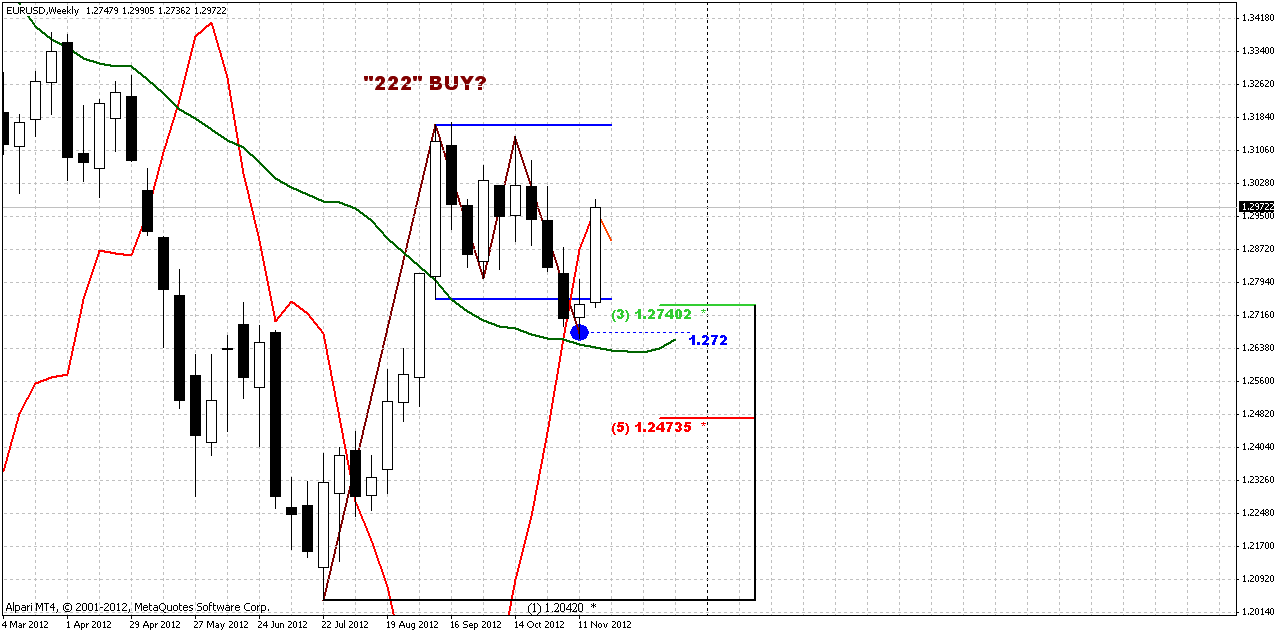
Within previous month we’ve announced some suspicions, that it could be retracement right to 1.38, but in recent time all signs of it have turned to the zero. Now this prespective is reborning and on previous week we’ve told about it – by mentioning exceptional role of 25x5 on weekly chart. On first chart - that is a larger picture, we see a lot of bullish signs. If you will scroll all EUR weekly chart, you’ll see that there was never failure breakout of 25x5, when market breaks it, holds higher (or lower) and then immediately returns right back. Always breakout leads to continuation in the same direction. Very often this happens after re-testing of 25x5 from another side. May be one day failure breakout will happen, but currently it looks as previously – breakout and retesting. That’s bullish, no doubt. Second, is – we have rather bullish Gartley “222” pattern. Why it’s bullish – because AB-CD retracement has finished right at 0.382 support level – minimum possible retracement. Next is MPP, market has reached it and touched at first time within the month, and simultaneously has approached to upper border of parallel channel. On second chart, take a look, how market re-establish bullish trend again. That a kind of hybrid of stop grabber and dynamic pressure, since within two weeks market went against the trend. Very often such action leads to further upward acceleration.
Well, it’s all clear if this bullish development will take place. We have upward AB=CD with 0.618 extension targets higher than previous top, by the way, so that top will not hold anyway. Potential target is Agreement with 1.3883 area. That is also 1.27 extension of previous swing low – recall butterfly “Buy”.
Still, by some unknown reason I feel some worring about cloudness of current scenario. I always look with suspicion at some obvious stuff on the market. Conservative tactic will be, probably, to wait breakout of previous highs. In this case market will prove its bullish ambitions. Another moment, that I do not like is a situation on JPY:
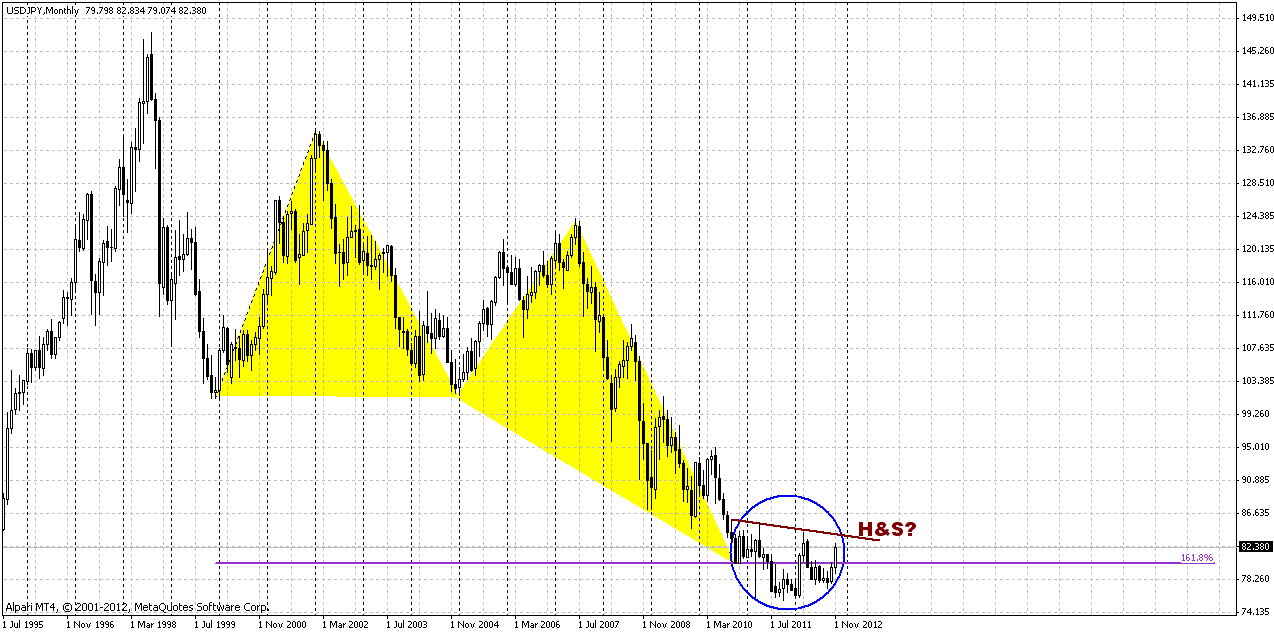
EUR could grow by itself, not just due dollar weaken, but what the reasons for that now? Kicking and pushing among EU leaders for new EU budget? From the techincal point of view market has a lot of reasons and possiblities to reverse down on weekly. May be this is just retracement after hitting of 1.27 target (look at 2nd weekly chart), or this is just testing of MPP? What if market will hit just WPR1 at 1.3129 (around the same nearest Fib resistance) and will turn down again? A lot of if, if, if even without addling brains with fundamental and political variables. In such environment best decision is sticking with patterns, that stand in agreement with major trend, and trade precise close targets, not hold for gaint steps. Start from small pattern, take it, and if you will lucky and market will show greater move than you’ve extected or even give you more facts of bullishness, you can keep position. That is what I itend to offer you in the beginning of the week.
Daily
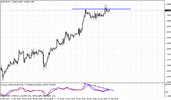
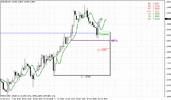
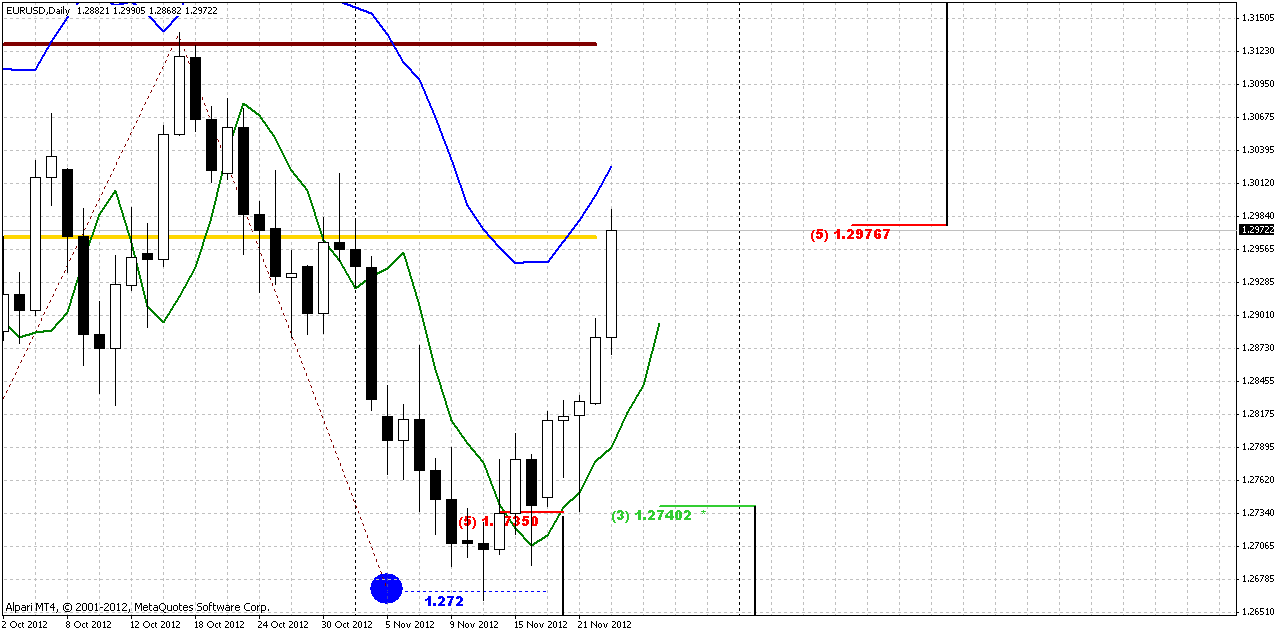
What pure technical approach does give us on daily? Weekly and daily trends are bullish, price action is bullish on daily chart, market has shown nice acceleration from daily K-support area. Now market stands at resistance – 5/8 major Fib resistance + MPP. Daily 90% overbought stands close as well. Since we do not have any bearish directional patterns here yet and we have a bullish trend that accompanied by bullish price action, hence, probably we can try to catch some deep to buy into.
Although current thrust a bit small, but still, we can try to look at this daily thrust for B&B “Buy” Look-alike probably. It could give us just more assistance with catching right point to enter. Still, the same procedure could be accomplished just by watching on trends on multiple time frames and using some intraday patterns.
4-hour
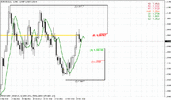
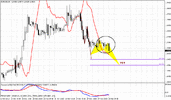
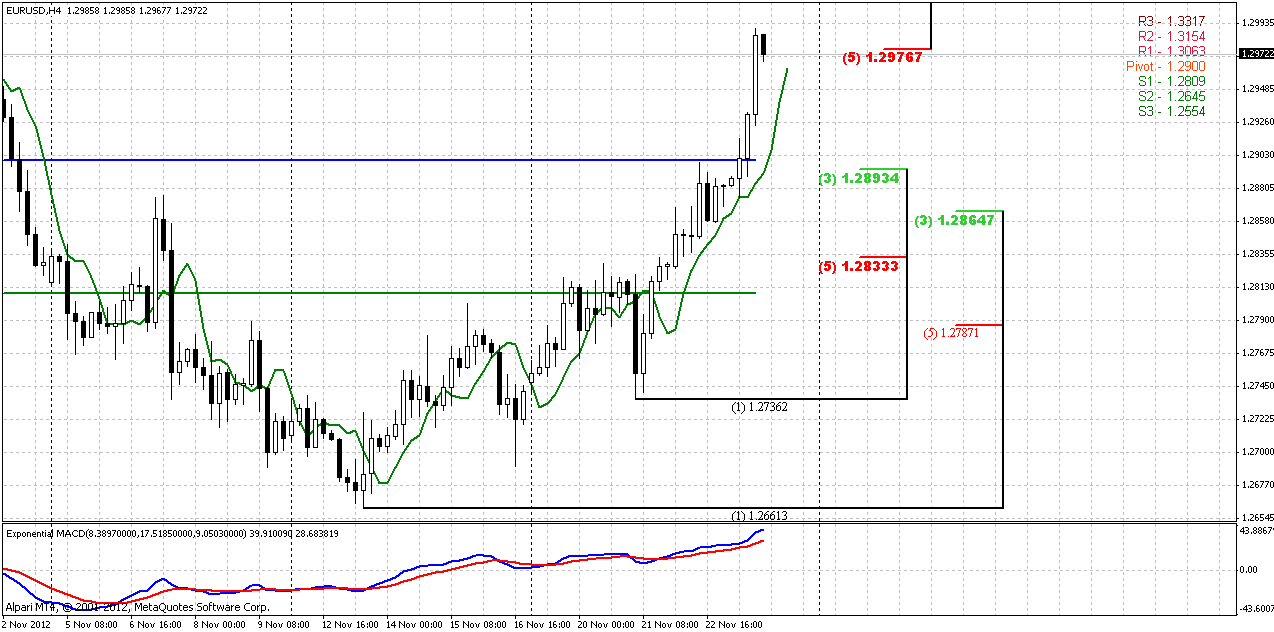
If you do not like much thrust on daily, here is another one, more pretty. I prefer to get B&B rather that DRPO here. If this will be B&B, first level to watch for is nearest support – 1.2893 that is WPP=1.29 as well. Next support is Confluence area – 1.2833-1.2864, that also includes 50% support of recent thrust. On hourly chart I do not see any singificant add-on to current picture.
Conclusion:
Although market is showing thrilling changes on long-term charts, and potentially they are very attractive, overall situation is very difficult and it’s quite uneasy to take into consideration all parts of puzzle. In such sort of environment, may be we should move with direction of these changes, but controlling our risk by sticking with particular patterns on lower time frames. That should let us flow with the market and take advantage with unexpected possible acceleration.
The technical portion of Sive's analysis owes a great deal to Joe DiNapoli's methods, and uses a number of Joe's proprietary indicators. Please note that Sive's analysis is his own view of the market and is not endorsed by Joe DiNapoli or any related companies.
As you can see on monthly chart situation has changed drastically again. That is particular important, since we’re entering in final November’s week. Just on previous week we’ve discussed potential bearish stop grabber here, if market will close lower than 1.2762, but now we have no sign of it. Market has returned right back inside of 1.2934-1.3149 area K-resistance. That is significantly sophisticates overall picture, so that we even could get lightning bolt AB-CD right to 1.38 Agreement. Probably intrigue will hold right to November close – market still has time to return right back again. It does tell us that currently it’s not the time for long-term position. We need to get clarity – will K-resistance finally stop retracement up or not. Unfortunately monthly chart can’t help much us now.

Weekly
This time frame gives us really tough picture, and major question, will we have enough courage to accept these possible drastical changes. And should we accept it? May be it’s too early? Now let’s go right to the point.
Within previous month we’ve announced some suspicions, that it could be retracement right to 1.38, but in recent time all signs of it have turned to the zero. Now this prespective is reborning and on previous week we’ve told about it – by mentioning exceptional role of 25x5 on weekly chart. On first chart - that is a larger picture, we see a lot of bullish signs. If you will scroll all EUR weekly chart, you’ll see that there was never failure breakout of 25x5, when market breaks it, holds higher (or lower) and then immediately returns right back. Always breakout leads to continuation in the same direction. Very often this happens after re-testing of 25x5 from another side. May be one day failure breakout will happen, but currently it looks as previously – breakout and retesting. That’s bullish, no doubt. Second, is – we have rather bullish Gartley “222” pattern. Why it’s bullish – because AB-CD retracement has finished right at 0.382 support level – minimum possible retracement. Next is MPP, market has reached it and touched at first time within the month, and simultaneously has approached to upper border of parallel channel. On second chart, take a look, how market re-establish bullish trend again. That a kind of hybrid of stop grabber and dynamic pressure, since within two weeks market went against the trend. Very often such action leads to further upward acceleration.
Well, it’s all clear if this bullish development will take place. We have upward AB=CD with 0.618 extension targets higher than previous top, by the way, so that top will not hold anyway. Potential target is Agreement with 1.3883 area. That is also 1.27 extension of previous swing low – recall butterfly “Buy”.


Still, by some unknown reason I feel some worring about cloudness of current scenario. I always look with suspicion at some obvious stuff on the market. Conservative tactic will be, probably, to wait breakout of previous highs. In this case market will prove its bullish ambitions. Another moment, that I do not like is a situation on JPY:

EUR could grow by itself, not just due dollar weaken, but what the reasons for that now? Kicking and pushing among EU leaders for new EU budget? From the techincal point of view market has a lot of reasons and possiblities to reverse down on weekly. May be this is just retracement after hitting of 1.27 target (look at 2nd weekly chart), or this is just testing of MPP? What if market will hit just WPR1 at 1.3129 (around the same nearest Fib resistance) and will turn down again? A lot of if, if, if even without addling brains with fundamental and political variables. In such environment best decision is sticking with patterns, that stand in agreement with major trend, and trade precise close targets, not hold for gaint steps. Start from small pattern, take it, and if you will lucky and market will show greater move than you’ve extected or even give you more facts of bullishness, you can keep position. That is what I itend to offer you in the beginning of the week.
Daily
What pure technical approach does give us on daily? Weekly and daily trends are bullish, price action is bullish on daily chart, market has shown nice acceleration from daily K-support area. Now market stands at resistance – 5/8 major Fib resistance + MPP. Daily 90% overbought stands close as well. Since we do not have any bearish directional patterns here yet and we have a bullish trend that accompanied by bullish price action, hence, probably we can try to catch some deep to buy into.
Although current thrust a bit small, but still, we can try to look at this daily thrust for B&B “Buy” Look-alike probably. It could give us just more assistance with catching right point to enter. Still, the same procedure could be accomplished just by watching on trends on multiple time frames and using some intraday patterns.

4-hour
If you do not like much thrust on daily, here is another one, more pretty. I prefer to get B&B rather that DRPO here. If this will be B&B, first level to watch for is nearest support – 1.2893 that is WPP=1.29 as well. Next support is Confluence area – 1.2833-1.2864, that also includes 50% support of recent thrust. On hourly chart I do not see any singificant add-on to current picture.

Conclusion:
Although market is showing thrilling changes on long-term charts, and potentially they are very attractive, overall situation is very difficult and it’s quite uneasy to take into consideration all parts of puzzle. In such sort of environment, may be we should move with direction of these changes, but controlling our risk by sticking with particular patterns on lower time frames. That should let us flow with the market and take advantage with unexpected possible acceleration.
The technical portion of Sive's analysis owes a great deal to Joe DiNapoli's methods, and uses a number of Joe's proprietary indicators. Please note that Sive's analysis is his own view of the market and is not endorsed by Joe DiNapoli or any related companies.
