Damian1987
Corporal
- Messages
- 149
I would say "YES".

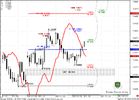
Sive, would you agree we have a B&B SELL on the S&P (Daily) in this area (1195ish)?
I would say "YES".View attachment 4388
Hi Sive , picking up the point re holding long term bearish positions , in what area would you consider placing stop-losses and what time frame and analysis would you use to calculate this please . Thanks as always.
")
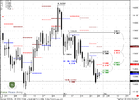
hey sive, hope your well, would you say that the trend on the 4 hour chart is bullish? because i can see DiNapoli MACD crossing, but 25x5 DMA is holding the bearish trend very well. on the 4 hour chart we have seen 3 candles with wash and rinse of the 25x5 DMA.
Yousuf.
i can't believe this! just checked my trade from a remote location a couple of hours after opening it. i had to leave the house, so i let the trade ride, with S/L and T/P properly set.. and what happens? the market reverses 6 pips before hitting my T/P!!! and is now 17 pips below entry level! jesus christ! i am so pissed off right now. why, but why is there a sell-off just at 3444??? it makes no sense!
sive, do you have any idea why the market reversed right at 3444? all my levels pointed to at least 346x. what happened? anybody?
cheers and thanks.