Triantus Shango
Sergeant Major
- Messages
- 1,371
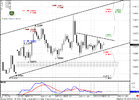
alright... alright... i need to calm down. upward channel, eh? ok gotta rush home and check that. thanks, as always.
the answer to that question is on page 3 mate.hey sive, we have seen wash and rinse of 1.3460 (ALMOST) 1.3444 to be exact, which is the agreement area, do u think the upward movement still has probability?
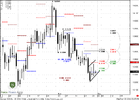
hey damian, thanks for your answer, but the question was contradictory because sive said probability is that it will continue higher as the target has not been hit, i said well, its ALMOST hit, so i dont think it will continue, and as of now the price has fallen to week open level of 1.3300. My understanding was that the retracement is over and we are ready to continue the bearish trend. if you could comment on that and if sive will too, that will confirm the short term market direction.


I agree with Damien,looking at price action today have to wait for clear signals as probably the 95% are short so for the market to get the stops is probable! but this is the market where anything can happen,our trading plan gives us a higher probability that we may be correct but not always works like this,thats why main thing in this bussiness is dertimine your Risk!! and set your ratio accordingly and if wrong move on to the next one.
Good charts Damien like it mate!!
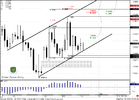
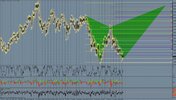
We may have a 3 drive sell (1 hr TF). First Drive at 1.3340, second at 1.3400 and the last at 1.3444 and now we have had a sell off with a small ABCD on 15 minute. A break below 1.3284 would confirm.
") i have a order to open at 13450 so could be stop grabber before hitting pivot resistance 1. so lets see how market plays tomorrow.At least by having and following Sives plan we have some idea what may happen on the Market!
i have a order to open at 13450 so could be stop grabber before hitting pivot resistance 1. so lets see how market plays tomorrow.At least by having and following Sives plan we have some idea what may happen on the Market!We may have a 3 drive sell (1 hr TF). First Drive at 1.3340, second at 1.3400 and the last at 1.3444 and now we have had a sell off with a small ABCD on 15 minute. A break below 1.3284 would confirm.