Sive Morten
Special Consultant to the FPA
- Messages
- 18,621
Fundamentals
I suppose that currently there is single major event on the market and it has major influence on FX market. This is Ireland bailout plan. So, I offer to discuss some important moment of this issue and find out how the situation with Ireland can influence on EUR currency in near term.
Ireland has released their recovery plan on 24th of November. This plan is assumed to be realized in 4 years. I do not want to make any parallels between Greece and Ireland, but there is a solid probability that austerity measures will trigger some rumbles among the population. Let’s take a look at some basic moments of this plan, so that it becomes clear for you:
1. First of all, Ireland budget deficit is a 32% of GDP (including bank support measures);
2. Ireland undertakes to reduce public service staff numbers by 24,750 employees;
3. Reduce minimum wage;
4. Corporate tax rate will not be raised and stays at 12.5%;
5. E10Bln in spending cuts: E3Bln in capital expenditures and 7Bln from current expenditures (healthcare, agriculture, defense etc.);
6. E5Bln in tax and revenue raising measures. Ireland intends to raise VAT tax to 2% by 2014, land, property and other taxes;
7. The carbon tan fee will be raised to E30 per tonne;
8. Ireland promises that E6Bln to E15B in savings measures will occur in 2011.
In general this plan looks tight and strict enough, so I will not be surprised if it will lead to some kind of population’s backlash. Although there were some statements from EU officials that the plan is a basis for negotiations for final details of the international bailout, I hardly believe that the scrutiny of Ireland is over. One of the potential weak points in plan is 12.5% corporate tax. I don’t think that EU members can continue to push on Ireland for getting more adequate actions from it on this front. This is relatively confirmed by German chancellor - she said that aid to Ireland will come with conditions. It means that uncertainty whether EU officials are pleased with plan or not leads to some nervous situation on the market. Market participants can’t be absolutely happy with it, because there is a risk that this plan still could be changed. Also there is some uncertainty with the value of bailout and the percent rate. Since the very shallow and indefinite information appear and no one politician can intelligibly explain the overall situation, the risk aversion will remain on the market and can interrupt any rally in EUR. There is also worthy to be noted here, that the year is close to the end and some de-risking and shifting to the safe haven can take place in the near future. All these facts are supporting for dollar in near term.
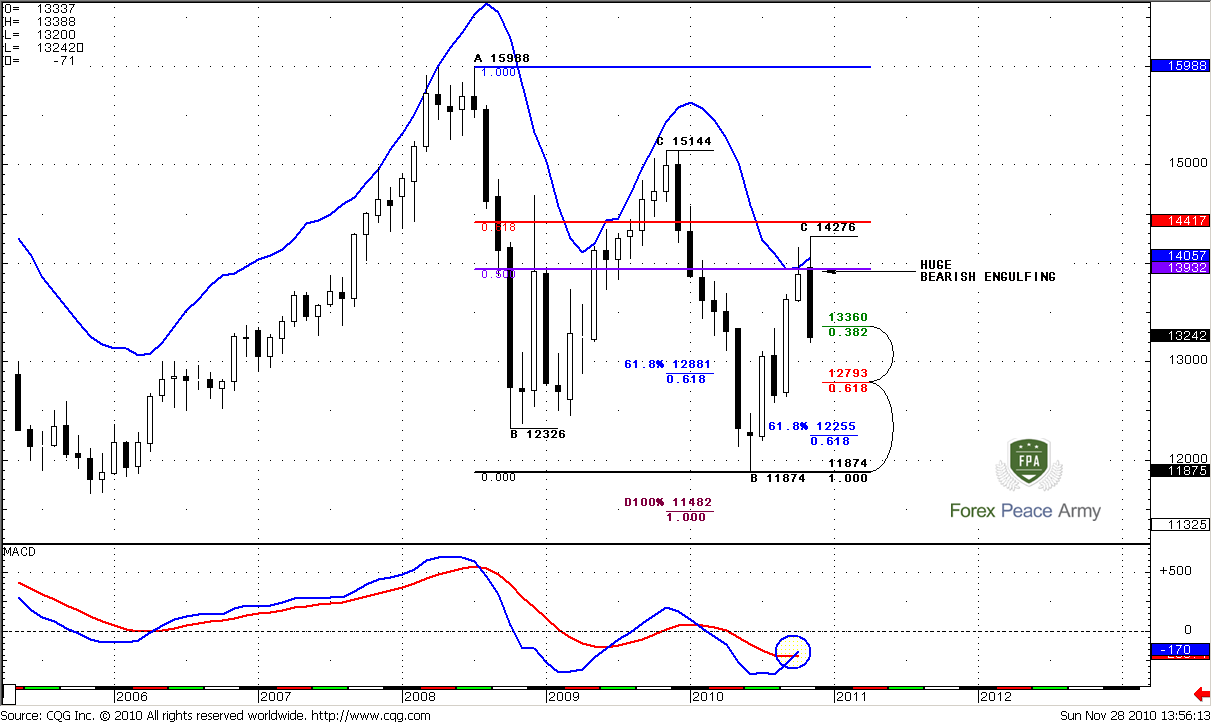
Monthly
There is something new to talk about here. Monthly trend is bullish, and MACD shows very good angle of lines crossing. But currently the more important is the long-term targets of possible move, based on monthly chart analysis. Let’s see – down move has started due to situation that could be interpreted twofold. From the one point of view – this was “Stretch” sell pattern (market has reached Fib resistance simultaneously with overbought). Usual target of this pattern is a zero point on Detrended oscillator or the middle between two lines of Oscillator predictor. I will not bother you with calculations and just tell that this is approximately 1.27 area.
From another point of view – we may treat current retracement up as B&B LAL pattern from the previous swing down. I say LAL (Look-alike) because thrust down has no sufficient number of bars. The target of this trade is 5/8 Fib support from whole opposite to trust price move. This is 1.2793. Interesting, right? Also take a look at recent ABC-top pattern. The nearest target is 0.618 expansion at 1.2255
So, I expect that market can hit 1.27-1.28 area of support, especially if we take into consideration fundamental part of the research and huge engulfing pattern on monthly tine frame. Also this is a reverse bar, by the way.
#1
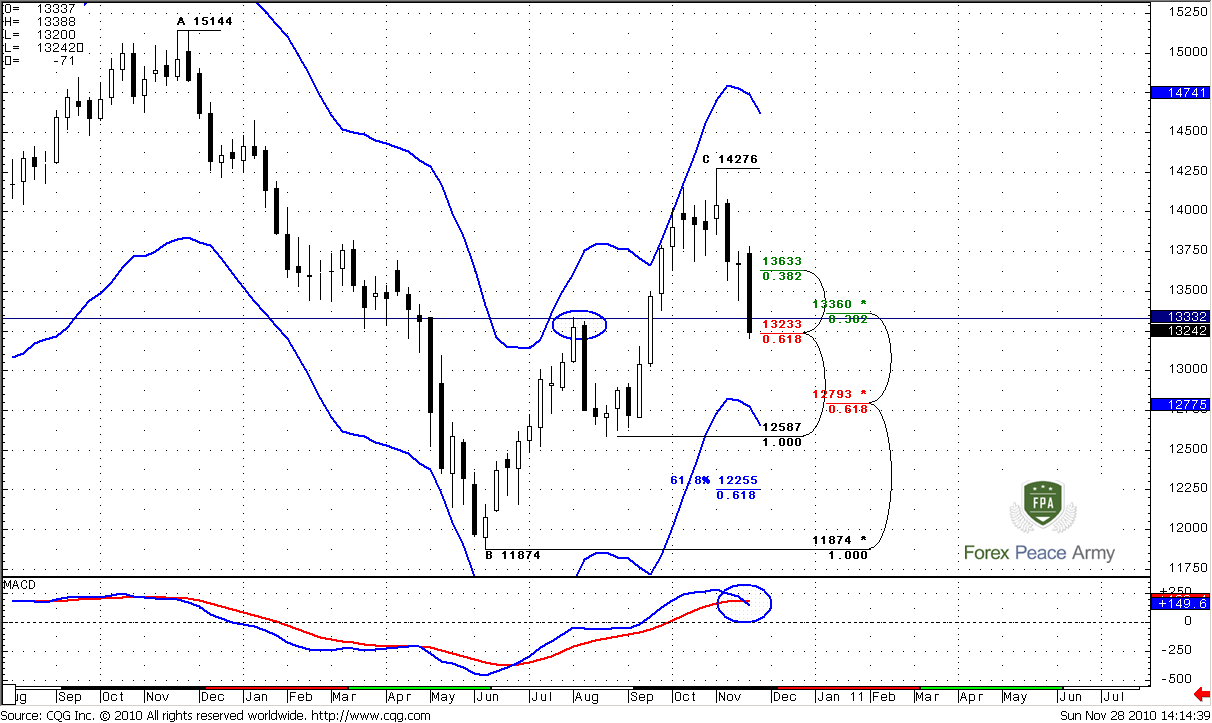
Weekly
As I’ve said in previous researches current support area will be decisive for the further up move continuation. This is 1.3233-1.3360 weekly confluence support and previous highs area. But now I’m not very exciting with price action around there. Yes, market has not passed it totally yet, so how market will response there during coming week is the key will we go down or up. But, let me some notes to be made here. First – we see two nasty week bars down. We’ve talked about possible MACDP failure pattern around this support – this has not happened. I do not even have it on the chart, because trend shifting to bearish has been confirmed and MACD shows excellent angle of line piercing. Trend is clearly bearish, price action is bearish. All monthly pivot points have been totally broken to the downside. I have very shallow expectations that market will hold this area. But, we should trade our trading plan and not rely only on feelings.
Daily
Daily trend is obviously bearish. Now market has reached 0.618 1.3271 Fib expansion target at 5/8 Fib support 1.3232. This is area of Agreement. The next target is also an area of Agreement 1.2953, which is 100% expansion from ABC pattern at 1.2974 Fib support. Also there is a weekly pivot support at 1.3033 But this target is not logical know, because it beyond of daily oversold area. 1.3174 is a level of oversold for Monday. So, we are at Agreement and oversold. Personally I do not want to sell right here and I suppose that we can count on some pullback. At the same time market is not at oversold right now and I can’t exclude some piercing of this area, some attempts to continue down move before meaningful retracement.
#1
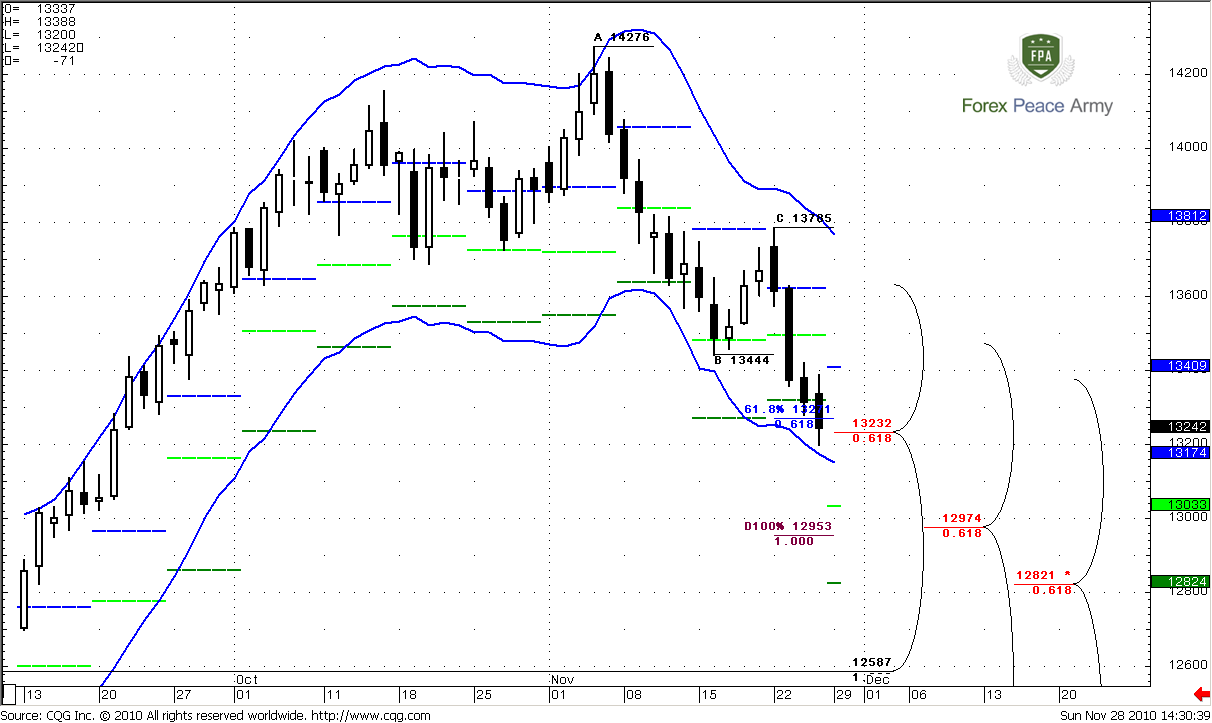
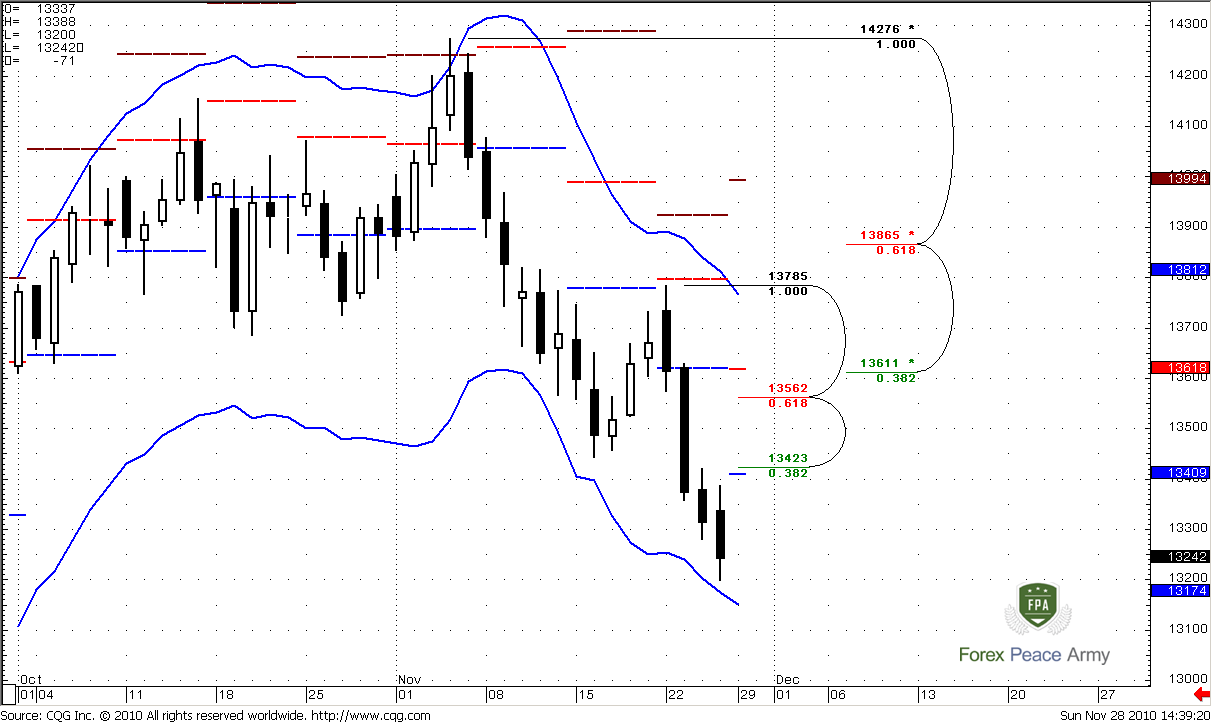
Let’s find the levels that are suitable for enter on the short side with Chart#2. The first area that we should watch for is 1.3409-1.3423 that is weekly pivot point and Fib resistance. The point is that market has reached only 0.618 expansion and usually it makes shallow retracement after that. When market accelerates in down thrust, it usually fails at pivot and goes down. The one problem with it however is that market is near oversold. Take a look at previous retracement – it almost has reached the level of overbought and weekly pivot resistance 1. So, if market will blast through this area of resistance – don’t be short.
The second area is 1.3562-1.3618. It includes daily Confluence resistance and weekly pivot resistance 1. When market corrects in bear trend – it corrects to pivot resistance 1. This is my preferable area. Also because you will be able to place tighter stop – above the previous high 1.3785, this is also an area of daily overbought. If bears are really control the market – Confluence area of resistance should hold, I do not even talk about previous high at 1.3785.
#2
4-Hour
I do not see any interesting currently on this time frame, may be except of bullish divergence on MACD. We need to wait when retracement will start, to point some ABC’s or something to establish the level for entering more precisely.
The technical portion of Sive's analysis owes a great deal to Joe DiNapoli's methods, and uses a number of Joe's proprietary indicators. Please note that Sive's analysis is his own view of the market and is not endorsed by Joe DiNapoli or any related companies.
I suppose that currently there is single major event on the market and it has major influence on FX market. This is Ireland bailout plan. So, I offer to discuss some important moment of this issue and find out how the situation with Ireland can influence on EUR currency in near term.
Ireland has released their recovery plan on 24th of November. This plan is assumed to be realized in 4 years. I do not want to make any parallels between Greece and Ireland, but there is a solid probability that austerity measures will trigger some rumbles among the population. Let’s take a look at some basic moments of this plan, so that it becomes clear for you:
1. First of all, Ireland budget deficit is a 32% of GDP (including bank support measures);
2. Ireland undertakes to reduce public service staff numbers by 24,750 employees;
3. Reduce minimum wage;
4. Corporate tax rate will not be raised and stays at 12.5%;
5. E10Bln in spending cuts: E3Bln in capital expenditures and 7Bln from current expenditures (healthcare, agriculture, defense etc.);
6. E5Bln in tax and revenue raising measures. Ireland intends to raise VAT tax to 2% by 2014, land, property and other taxes;
7. The carbon tan fee will be raised to E30 per tonne;
8. Ireland promises that E6Bln to E15B in savings measures will occur in 2011.
In general this plan looks tight and strict enough, so I will not be surprised if it will lead to some kind of population’s backlash. Although there were some statements from EU officials that the plan is a basis for negotiations for final details of the international bailout, I hardly believe that the scrutiny of Ireland is over. One of the potential weak points in plan is 12.5% corporate tax. I don’t think that EU members can continue to push on Ireland for getting more adequate actions from it on this front. This is relatively confirmed by German chancellor - she said that aid to Ireland will come with conditions. It means that uncertainty whether EU officials are pleased with plan or not leads to some nervous situation on the market. Market participants can’t be absolutely happy with it, because there is a risk that this plan still could be changed. Also there is some uncertainty with the value of bailout and the percent rate. Since the very shallow and indefinite information appear and no one politician can intelligibly explain the overall situation, the risk aversion will remain on the market and can interrupt any rally in EUR. There is also worthy to be noted here, that the year is close to the end and some de-risking and shifting to the safe haven can take place in the near future. All these facts are supporting for dollar in near term.
Monthly
There is something new to talk about here. Monthly trend is bullish, and MACD shows very good angle of lines crossing. But currently the more important is the long-term targets of possible move, based on monthly chart analysis. Let’s see – down move has started due to situation that could be interpreted twofold. From the one point of view – this was “Stretch” sell pattern (market has reached Fib resistance simultaneously with overbought). Usual target of this pattern is a zero point on Detrended oscillator or the middle between two lines of Oscillator predictor. I will not bother you with calculations and just tell that this is approximately 1.27 area.
From another point of view – we may treat current retracement up as B&B LAL pattern from the previous swing down. I say LAL (Look-alike) because thrust down has no sufficient number of bars. The target of this trade is 5/8 Fib support from whole opposite to trust price move. This is 1.2793. Interesting, right? Also take a look at recent ABC-top pattern. The nearest target is 0.618 expansion at 1.2255
So, I expect that market can hit 1.27-1.28 area of support, especially if we take into consideration fundamental part of the research and huge engulfing pattern on monthly tine frame. Also this is a reverse bar, by the way.
#1
Weekly
As I’ve said in previous researches current support area will be decisive for the further up move continuation. This is 1.3233-1.3360 weekly confluence support and previous highs area. But now I’m not very exciting with price action around there. Yes, market has not passed it totally yet, so how market will response there during coming week is the key will we go down or up. But, let me some notes to be made here. First – we see two nasty week bars down. We’ve talked about possible MACDP failure pattern around this support – this has not happened. I do not even have it on the chart, because trend shifting to bearish has been confirmed and MACD shows excellent angle of line piercing. Trend is clearly bearish, price action is bearish. All monthly pivot points have been totally broken to the downside. I have very shallow expectations that market will hold this area. But, we should trade our trading plan and not rely only on feelings.
Daily
Daily trend is obviously bearish. Now market has reached 0.618 1.3271 Fib expansion target at 5/8 Fib support 1.3232. This is area of Agreement. The next target is also an area of Agreement 1.2953, which is 100% expansion from ABC pattern at 1.2974 Fib support. Also there is a weekly pivot support at 1.3033 But this target is not logical know, because it beyond of daily oversold area. 1.3174 is a level of oversold for Monday. So, we are at Agreement and oversold. Personally I do not want to sell right here and I suppose that we can count on some pullback. At the same time market is not at oversold right now and I can’t exclude some piercing of this area, some attempts to continue down move before meaningful retracement.
#1
Let’s find the levels that are suitable for enter on the short side with Chart#2. The first area that we should watch for is 1.3409-1.3423 that is weekly pivot point and Fib resistance. The point is that market has reached only 0.618 expansion and usually it makes shallow retracement after that. When market accelerates in down thrust, it usually fails at pivot and goes down. The one problem with it however is that market is near oversold. Take a look at previous retracement – it almost has reached the level of overbought and weekly pivot resistance 1. So, if market will blast through this area of resistance – don’t be short.
The second area is 1.3562-1.3618. It includes daily Confluence resistance and weekly pivot resistance 1. When market corrects in bear trend – it corrects to pivot resistance 1. This is my preferable area. Also because you will be able to place tighter stop – above the previous high 1.3785, this is also an area of daily overbought. If bears are really control the market – Confluence area of resistance should hold, I do not even talk about previous high at 1.3785.
#2
4-Hour
I do not see any interesting currently on this time frame, may be except of bullish divergence on MACD. We need to wait when retracement will start, to point some ABC’s or something to establish the level for entering more precisely.
The technical portion of Sive's analysis owes a great deal to Joe DiNapoli's methods, and uses a number of Joe's proprietary indicators. Please note that Sive's analysis is his own view of the market and is not endorsed by Joe DiNapoli or any related companies.