Hi Jimmy. RRT is Railroad Tracks. It is one of Joe DiNapoli's trade patterns. It is described in Sive's glossary in this forum. You can read more about it in Joe DiNapoli's book (do a search online). The second bar must close higher (or lower in case of a bear bar) than the previous bar; it can appear on any time frame and must not have touched those prices for at least 100 bars previously. It is a rejection of price and the target of this pattern is the length of the bars. Also, the price must not go back down below about .618 of the bar up. If it does, then this is a failed RRT and means the price will probably go heavily in the other direction. I hope I got all of this right - maybe Sive can comment or correct me if not.hi Icarus, what's RRT ?
Where i can learn about RRT ?
-Thank You-
- Forex, Gold, BTC Market Analysis | Trading Signals
- Sive Morten- Currencies, Gold, Bitcoin Daily Video
You are using an out of date browser. It may not display this or other websites correctly.
You should upgrade or use an alternative browser.
You should upgrade or use an alternative browser.
FOREX PRO Weekly October 03-07, 2011
- Thread starter Sive Morten
- Start date
Damian1987
Corporal
- Messages
- 149
at least 100 bars previously.
I think it's more like 140 - 180. I would let myself in at even a .786 retracement if it's not on close, just simple penetration of that fibonacci level.
Sive Morten
Special Consultant to the FPA
- Messages
- 18,655
EUR/USD Daily Update, Thu 06, October 2011
Good morning,
today we will speak more about perspectives, since curent price action is very lazy and choppy, and, probably it will remain so till NFP release tomorrow.
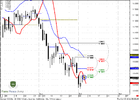
In the beginning couple of words about previous expectations. Market has not shown retracement down, although we've expected it. I suppose that the reason was one, that we've mentioned yesterday - 1.0 extension of AB-CD on hourly chart. Market just has gravitated to it and hit it by shadows. Now it turns to some retracement.
Next target stands precisely in the area of daily K-resistance area and pivot point.
IF market intends to reach it, it should not move below 1.3233 Fib support, although some retracement is possible, expecially today, after hitting of 1.0 target. Probably market will stuck between 1.3285 hourly K-support and 1.3375 - previous highs.
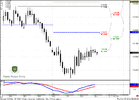
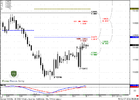
Now about perspectives - daily chart.
First, market stands at MACDP line. It means that we will get either stop grabber tomorrow or bull daily trend.
Current low stands at 1.618 extension of previous upswing. So, potentially we can get reverse H&S pattern. Now remember what we've told about strong 1.3650-1.3750 monthly K-area and 1.34 weekly support area. That could be the pattern that we've expected for respect of that levels.
If it will really appear - then we can see retracement to 1.41 area.
Good morning,
today we will speak more about perspectives, since curent price action is very lazy and choppy, and, probably it will remain so till NFP release tomorrow.
In the beginning couple of words about previous expectations. Market has not shown retracement down, although we've expected it. I suppose that the reason was one, that we've mentioned yesterday - 1.0 extension of AB-CD on hourly chart. Market just has gravitated to it and hit it by shadows. Now it turns to some retracement.
Next target stands precisely in the area of daily K-resistance area and pivot point.
IF market intends to reach it, it should not move below 1.3233 Fib support, although some retracement is possible, expecially today, after hitting of 1.0 target. Probably market will stuck between 1.3285 hourly K-support and 1.3375 - previous highs.
Now about perspectives - daily chart.
First, market stands at MACDP line. It means that we will get either stop grabber tomorrow or bull daily trend.
Current low stands at 1.618 extension of previous upswing. So, potentially we can get reverse H&S pattern. Now remember what we've told about strong 1.3650-1.3750 monthly K-area and 1.34 weekly support area. That could be the pattern that we've expected for respect of that levels.
If it will really appear - then we can see retracement to 1.41 area.
Attachments
Sive Morten
Special Consultant to the FPA
- Messages
- 18,655
Hi Sive!
Regarding B/B directional indicator Dinapoli states in his book that the level of retracement (where we enter) after the initial penetracion on close of the 3x3 should manifest within one to three periods. Last week on daily GBP/USD it took 4 periods,(4 days) and today on 4-hour EUR/USD we are on the 7th bar and still no clear signals. How are we supposed to treat this kind of price action? It exist a BB signal failure just like with DRPO???
Have a good day and thanks!
Hi Damian,
Well, presonally for me B&B is more blur pattern than DRPO. May be it's better to folllow DiNapoli rule about 3-periods after penetration. But this is just his observation, you know. It could happen that, as you've said, B&B starts after 4 bars...
So, I think this moments could help us, if we want to deal with relatively safe and reliable B&B or DRPO:
1. No less than daily time frame (or higher)
2. Apply no more than 3 periods after penetration.
3. Using as support/resistance K-areas with or w/o Agreement is prefferable
4. Apply 3-period rule after entering. IF market will not move how it expected - close position.
That is as perfect B&B should look like. All deviations from that - add more risk. To deal with it or not - this is up to you
")
Hope this helps.
Sive Morten
Special Consultant to the FPA
- Messages
- 18,655
hi sive,
would you tread the yesterdays bull candle and the the day before's bear candle,
as DiNapoli's RAIL ROAD TRACK directional indicator?
Yousuf.
Hi Yousuf,
on spot market looks like RRT, probably we can treat it as RRT...
On futures market there is no RRT - reverse Hammer instead.
Sive Morten
Special Consultant to the FPA
- Messages
- 18,655
your daily analysis is very helpful and i have never had to study so much. lol. do you ever use the euro vix, as an inverse indicator in your trading? it seems to be almost leading. thank you.
Hi Cashcorn,
No, I do not use volatility index for EUR, but sometimes I take a look at other tools, that linked with volatility and help to estimate true reversals.
Probably you should visit our FPA School, but this chapter, dedicated to volatility will be published a bit later:
Forex Military School | Complete Forex Education by a Pro Banker - Forex Peace Army Forum
Sive Morten
Special Consultant to the FPA
- Messages
- 18,655
EUR/USD Daily Update, Fri 07, October 2011
Good morning,
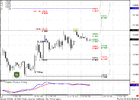
well, our yesterday's plan was relatively successful, since market has shown 0.618 retracement to 1.3235 area and then continued move up.
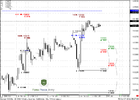
What to expect today? On daily time frame trend has turned bullish. The nearest area of resistance is 1.3440-1.3470 + pivot at 1.3485. Also this is an Agreement, since some intraday targets stand at 1.3464. Market probably will reach and respect it before NFP release.
The next target on daily chart is Agreement at 1.3605-1.3626 ,that is also a daily Overbought + monthly pivot at 1.3717, but this is a topic for next week, I suppose...
So,
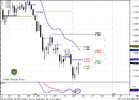
If you're scalper, you may try to do a scalp short sell at 5-min chart from 1.3460-1.3485 area. If you have bullish view, then probably to sit on hands and wait some pullback.
Areas that are suitable for enter long are 1.3365 + previous highs and 1.3315-1.3330 that is K-support + 50% support of long bar.
That area should survive, if market is really bullish in short-term. If this will not be the case - then we have to prepare for new downward move.
Other words, 1.33 is a crucial level for further price action.
Good morning,
well, our yesterday's plan was relatively successful, since market has shown 0.618 retracement to 1.3235 area and then continued move up.
What to expect today? On daily time frame trend has turned bullish. The nearest area of resistance is 1.3440-1.3470 + pivot at 1.3485. Also this is an Agreement, since some intraday targets stand at 1.3464. Market probably will reach and respect it before NFP release.
The next target on daily chart is Agreement at 1.3605-1.3626 ,that is also a daily Overbought + monthly pivot at 1.3717, but this is a topic for next week, I suppose...
So,
If you're scalper, you may try to do a scalp short sell at 5-min chart from 1.3460-1.3485 area. If you have bullish view, then probably to sit on hands and wait some pullback.
Areas that are suitable for enter long are 1.3365 + previous highs and 1.3315-1.3330 that is K-support + 50% support of long bar.
That area should survive, if market is really bullish in short-term. If this will not be the case - then we have to prepare for new downward move.
Other words, 1.33 is a crucial level for further price action.
Attachments
Similar threads
- Replies
- 1
- Views
- 50
- Replies
- 0
- Views
- 61
- Replies
- 4
- Views
- 847
- Replies
- 7
- Views
- 763
- Replies
- 0
- Views
- 35
- Forex, Gold, BTC Market Analysis | Trading Signals
- Sive Morten- Currencies, Gold, Bitcoin Daily Video