Forex FOREX PRO WEEKLY, October 07 - 12, 2019

Good day Mr Sive,
Please explain these terms and how to recognize them on currency pair charts. COP,OP,XOP, DRPO, LOL
Thanks.
 
Morning guys,

So, let's go back to the EUR. Finally our suggestion is done as EUR has challenged recent tops and realized bullish dynamic pressure on intraday chart. Now we're coming to daily K-resistance area. It means that no new longs should be taken, scalp traders could think about short positions, those who keeps longs right now have to think about money and stop management.
eur_d_10_10_19.png


On 4H chart market finally has hit our XOP target and now we could turn to larger AB-CD pattern. Usually we ignore COP targets but not today as it creates an Agreement with 5/8 Fib level here and with daily K-resistance area.
eur_4h_10_10_19.png


On 1H chart upside action could be finalized by AB=CD target of reverse H&S pattern and butterfly 1.27 extension. Thus, market probably will get som difficulty around 1.1015-1.1020 area.
eur_1h_10_10_19.png


It means that we sit on the hands and wait for retracement. Scalpers drop time frame to 15-min and try to catch bearish reversal patterns once major targets will be reached.


Disclaimer

This FPA Investment Research is for information and education purposes only. Any decision to make any trade on the market has to be made solely by the reader. Information that is presented in research or its update is not an offer or call to make the trade on the financial markets and expresses just a personal opinion of the author who is might be wrong. Reader has to make decision on any trade solely and care all responsibility for results of this trade.

The technical portion of Sive's analysis owes a great deal to Joe DiNapoli's methods, and uses a number of Joe's proprietary indicators. Please note that Sive's analysis is his own view of the market and is not endorsed by Joe DiNapoli or any related companies.
 
Morning everybody,

In general EUR has completed our suggestion. Indeed upward action has happened and specified targets have been hit. Now EUR is challenging the K-resistance area. Slightly higher, at 1.1040 area we also have MPR1.

As we have to follow the odds, it is not good point for new long positions. We can't sell here as well, because daily context is bullish. Thus, daily traders should wait for retracement and manage existed long positions if any.
eur_d_11_10_19.png


On 4H chart market has hit our COP and even slightly exceeded it. It is difficult to be on spot with future price action, but we could suggest few things. First is - if EUR starts to form small triangle/pennant here, it will be early sign of coming breakout and action right to OP target. Conversely, drop back to the lows suggests some downside AB-CD - either to nearest 1.10 level or, what is more probable, to 1.0975 K-support:
eur_4h_11_10_19.png


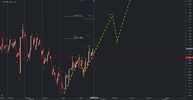
For example, in case of pennant on 4H chart, here we could get upside butterfly and reaching of XOP target.
Short position here on 1H chart is suitable only for scalp traders, if any bearish reversal patterns will be formed. All other time frames have bullish context.
eur_1h_11_10_19.png


Disclaimer

This FPA Investment Research is for information and education purposes only. Any decision to make any trade on the market has to be made solely by the reader. Information that is presented in research or its update is not an offer or call to make the trade on the financial markets and expresses just a personal opinion of the author who is might be wrong. Reader has to make decision on any trade solely and care all responsibility for results of this trade.

The technical portion of Sive's analysis owes a great deal to Joe DiNapoli's methods, and uses a number of Joe's proprietary indicators. Please note that Sive's analysis is his own view of the market and is not endorsed by Joe DiNapoli or any related companies.
 
I think this is an impulse as wava cFlat with target 1,12++.
This wave could be used also in case of bigger correction and entering in zone above 1,14..
 

Attachments

  • 20191011_13.37_Chart_EUR_USD_4 Hours_snapshot.png
    20191011_13.37_Chart_EUR_USD_4 Hours_snapshot.png
    46.3 KB · Views: 0
Back
Top