FOREX PRO Weekly October 08-12, 2012

check your elliot wave oscillator. Is tghere a new peak lower than previous one. Look at 100-140 bars of data
 
newbat.jpg
TO me this looks like a bat

Looking at the elliot wave oscilaltor:
removed as count poss wrong

I wonder if this means that we are going to get a 5th wave up?
just an alternative!
 
Last edited:
Hey,
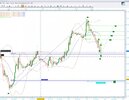
there is some add-on. Take a look at Gold - it might me DRPO "Sell" LAL. ALthough by shape it's look hard, but by price action that is DRPO. Or DRPO Failure... But be patient - wait for confirmation.
If it will be DRPO - then we should be ready for move to 1690-1700. Imagine what will happen on EUR then.

And continue to keep in eye on NASDAQ - H&S in progress and it stands right above previous highs. If it move below it - downward move could accelerate.

Please Sive, does that mean gold and Nasdaq are correlated with eash other, and inversely to euro/dollar?
i.e gold weaker, dollar stronger therefore eur/usd goes down?
 
Please Sive, does that mean gold and Nasdaq are correlated with eash other, and inversely to euro/dollar?
i.e gold weaker, dollar stronger therefore eur/usd goes down?

Hi Quinch,
No, I mean not the correlation of Nasdaq and Gold. Gold and Eur are linked by dollar. So, dollar becomes stronger and this presses as on EUR/USD as on Gold.
Speaking about Nasdaq - every time we tell that current US market growth is artificial. There is just 3 weeks till election and market starts to give bearish signs. Now new period of statements is starting. So, if earnings will be anemic (and I'm sure that they will) this could be another round of risk aversion after election euphoria.
I still keep the same investing idea - Emerging bonds and gold. I do not see anything else that could give some sensible return. May be Spain bonds as well if Spain will call for aid, but this is a bit risky game.
 
Sive: "So, if earnings will be anemic (and I'm sure that they will)"
One point to keep in mind as the earnings season begins is that most companies have INTENTIONALLY lowered their earnings forecasts so that when they report actual (mediocre) earnings, they still look good to (more or less inexperienced) investors , which could give indexes (S&P and others) a temporary boost till after the elections.
 
SO, FROM THE CARTS I HAVE POSTED, I`M PINNED TO AN EGO STAEMENT OF
A) UP TO POSS1.3050
b) down to 1.2830
then up to d of first chart @ 1.3120
utter madness, ignore everything i say, must thrash out a better top down process!
only good thing about this is the idea that a bullish M may lead into completion of a berarish W.
ive been thinking about the patternd of patterns for the last few days.
 
so what i am saying it, is it possible to have
bearbat.jpg
A Bearish Bat on the H4 timeframe

within which there is a Bullish M pattern(possibly a bat)
on m30 timeframe
fpa103.jpg

within which, there is a bearish W pattern undeveloped (projeceted) whode d point is at the c point of the harmonic shape one degree larger.
this bearsh pattern would fire the cd led of bearish m30 bat to complete at 1.2834
the point of clarity will be when the whole edifice crumbles as my b point is broken. good r/r at least

my only issue with this idea in construction terms,
is the d point of bullish bat on m15 chart is lower than c point on h4 bearish bat chart. BUT not lower than "a" point......

if i have not made enough sense, please ask me to clarify
 
Last edited:
Here i have added the currently fictitious bc leg projection. it falls exact on 0.886 xa blue line to complete the bullish bat
bcproj.jpg
edit:
the bearish W pattern with the purple d point would be a Gartley with that Fib retracement of its xa swing (x not yet marked but x for this shape would be the green"A"
)
 
Last edited:
Back
Top