Sive Morten
Special Consultant to the FPA
- Messages
- 18,644
Monthly
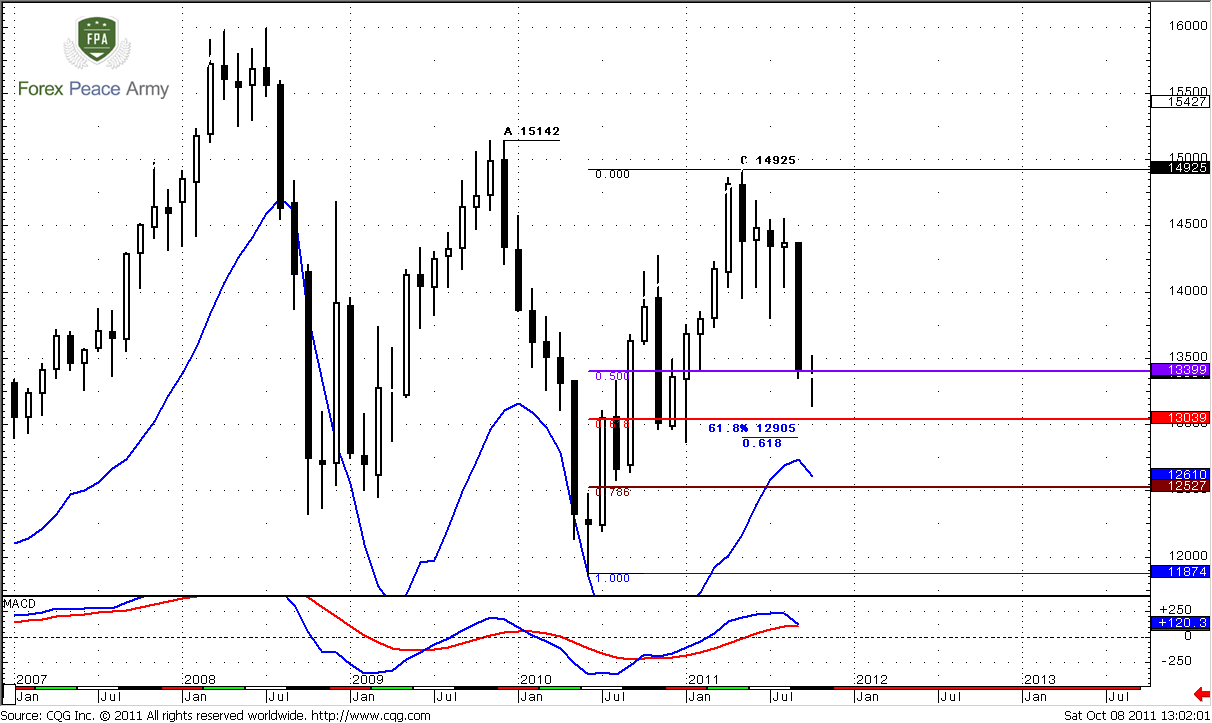
It’s very difficult to comment just new single small candle on Monthly chart and create some wise thoughts here, so I leave mostly previous monthly analysis intact, since we need some more action to make discussion of monthly time frame useful and interesting.
Monthly trend formally still stands bullish. Although currently we see unconfirmed bear trend, we will be able to speak about trend change only at the end of October if market will close lower than 1.40 level. Current situation usually treats as “confirmed trend is bullish – unconfirmed trend is bearish”. Still, for most of us monthly trend is not very important, since there are not much traders who trade precisely on monthly chart. Significant Fib levels and areas of overbought/oversold are rather more interesting and important for us.
September month has closed at low and shown plunge that looks impressive. What we could expect from October from that standpoint? Well, only two things – downward continuation or consolidation. Monthly chart is not at oversold, so formally market has room to continue move down. We hardly could count on drastic reversal, since now monthly price action has downward momentum, and to reverse it needs to decrease pace first. Take a look at price action after strong down months, for example in April 2010 or October 2008 – they are doji. They are months of previous pace decreasing before reversal. Something like that market should to do if it will intend to change direction. If this will not be the case, then market will show downward continuation, and honestly speaking this looks more probable.
Still, market now stands at support area between 50% and 61.8% at 1.30-1.34 from whole move up. As we’ve said in previous research, this is also weekly Agreement area.
That’s why we still can’t exclude some pullback and some retracement on daily time frame. For instance, market could try to touch monthly pivot point at 1.3717, since pivots are traded in 70% of cases during the trading period.
Simultaneously we have to keep mind open for opposite price action, if bears are really strong – we should not be too surprised if market will break all supports and accelerates down further. Nearest target on monthly chart stands at 1.2905 from large AB-CD pattern – near major 0.618 Fib support 1.3039, so we might say that this is also a monthly Agreement. Current price action looks like Gartley “222” from AB swing on chart.
Weekly
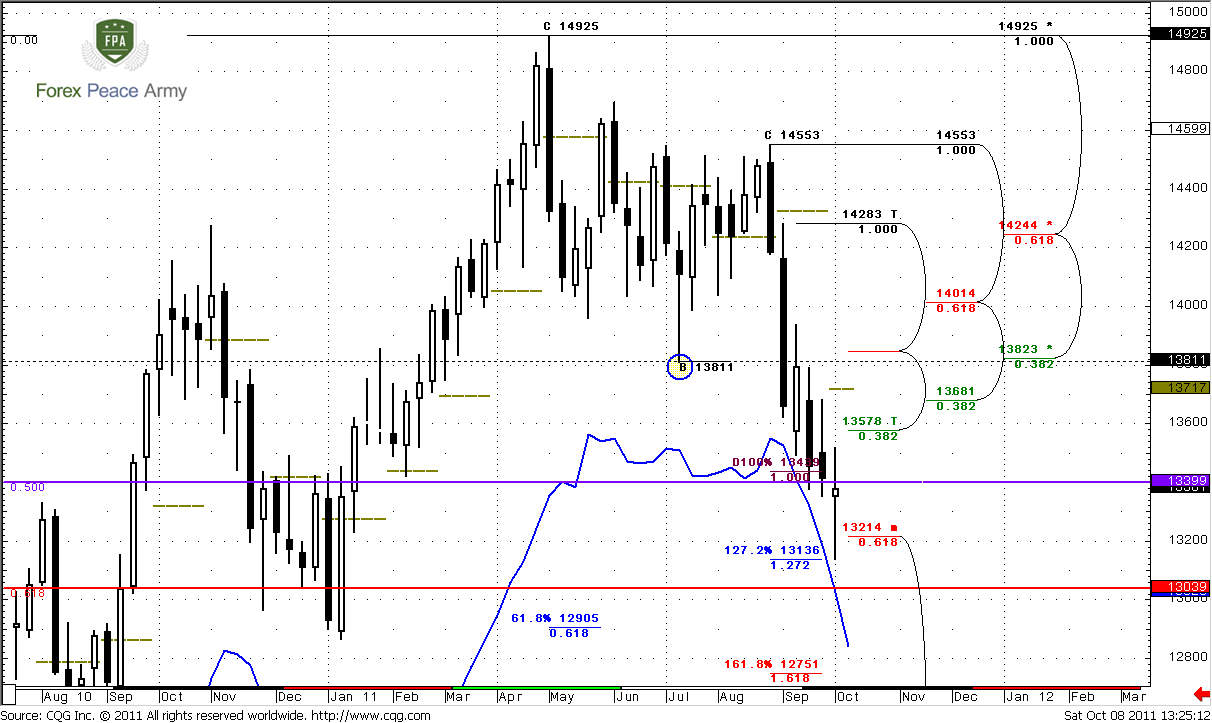
This chart is a bit overload with details, but all of them are important for us. Trend is extremely bearish, so that I even not draw MACD indicator here. From that standpoint we should be interested in shorting this market. The nearest target that market could achieve during week is 1.29-1.30 Agreement area. This area is also weekly oversold and contains monthly pivot support. This is too early to speak about 1.618 target at 1.2750, since it stands beyond weekly oversold area.
Although during previous week retracement has had more chances to happen and currently they still remain, some signs tell that market has extremely bearish bias. Price has not respected strong monthly area and strong support around 50% monthly level. Now we see that market has accelerated right to 1.27 extension, significantly pierced 50% support level and creeps across with oversold without any bouncing. So, what can we do in terms of weekly chart – just jump-in is very dangerous, since market stands at support. Wait for retracement – but will it happen? It’s very difficult to say with confidence, since all that we have are – hammer pattern on weekly chart at support and hitting 1.27 Fib extension target.
Another potential reason for retracement, as we’ve discussed on previous week is pivot point of new month that stands slightly above the market at 1.3717. We know that market trades pivots in 70% of cases during the period. So this is logical to assume that market still could touch pivot before downward continuation. Very often, especially when market shows solid moves, it tests pivots in the beginning of period, it calls as “test and go”.
Hence, from this point of view, retracement up, even small, could happen. What levels market could reach? There are only two of them – nearest Fib resistance that coincides with pivot at 1.3680-1.3717, and, second one is K-area around previous lows at 1.3811-1.3850.
So, all that we can do is watch for lower time frames for signs of retracement, will they appear or not. On weekly time frame they are quite shallow.
Daily
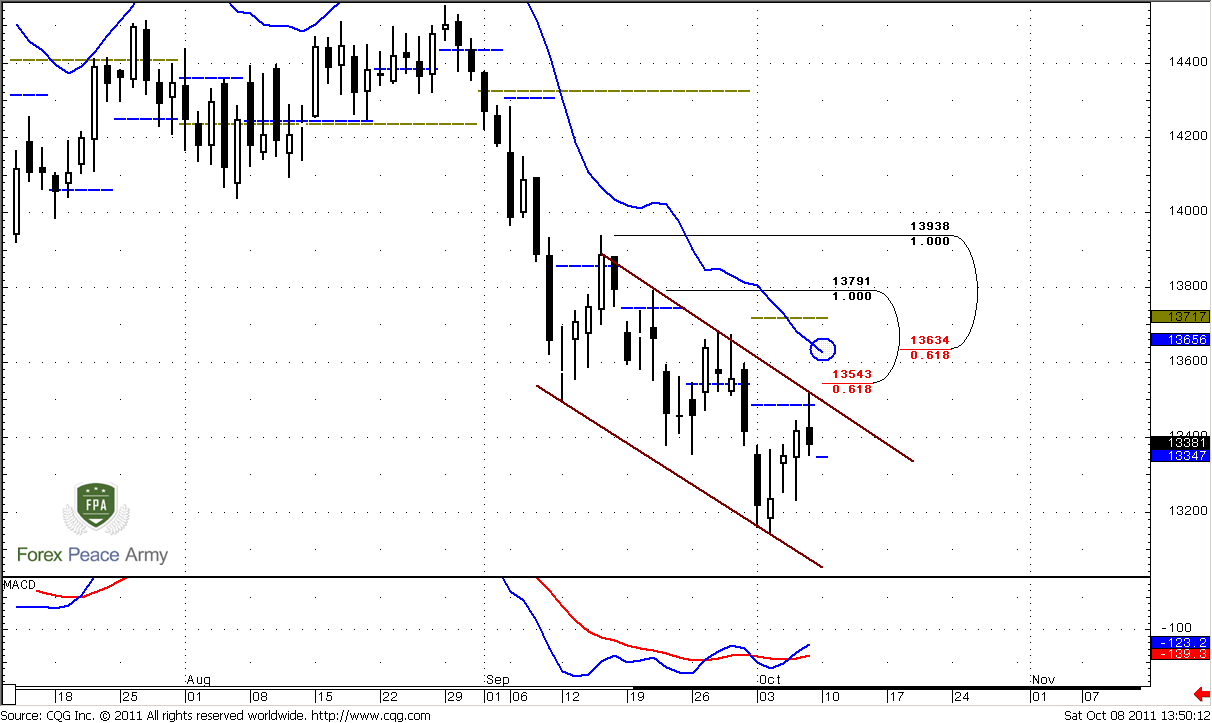
Trend is bullish currently, but in such kind of price action this is not so important. Triple bullish divergence is still here. Market now is some kind of downward trading channel. Market has accomplished our target, that we’ve discussed on Friday – touched weekly pivot, K-resistance and turned to downside again.
Since we do not have any significant patterns, let’s discuss some levels that could become important for coming week. First, this is pivot point at 1.3347. If market at the beginning of the week will move below it, then, probably move down inside channel will continue, probably to 1.29 - 1.30 monthly 0.618 Support and Agreement area.
If, otherwise, it will hold above pivot, then there will be some chances of upward breakout of this channel, but market hardly will show significant move up fast, since 1.3640 is daily overbought. I suspect, that we will able to speak about retracement only after breakout of this channel.
4-hour
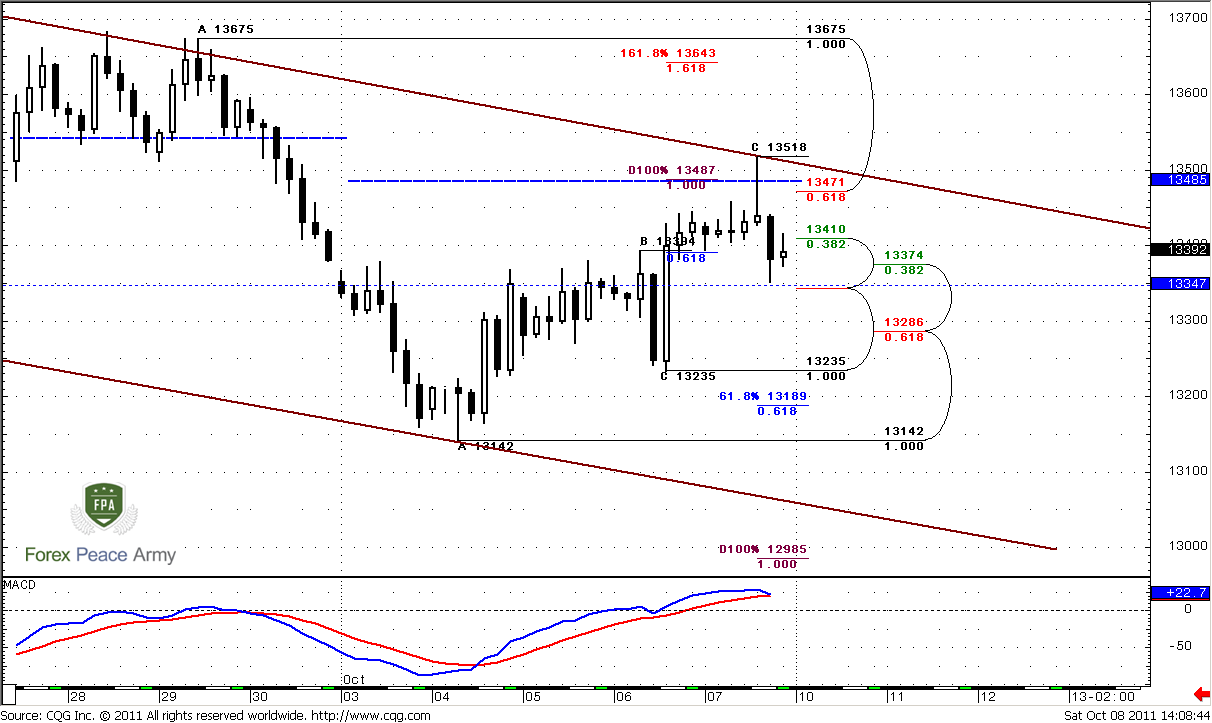
Here trend is turned bearish. Market has accomplished AB-CD pattern that we’ve discussed on previous week and turned to move down. In general this picture looks like Gartley “222” pattern, but target of this pattern could be different – it could continue move down right to 1.30 (large AB-CD pattern), or it could show just small retracement, say, to 1.33 area and then turn up again. Currently we can’t say that. But what we can do is to watch over 1.3350 area and pivot point as a breakeven point between bears and bulls, as we’ve said above. 1.618 extension target stands right at daily overbought at 1.3643. Downward target agrees with monthly Fib support level.
Conclusion:
Until market stands in downward channel we can’t be focus on some extended moves. Although, there are still chances exist of upward retracement on weekly chart, since market stands at support, on daily chart we have no confirmation and clear signs of that yet.
That’s why, in the beginning of the week our level to watch is pivot at 1.3350. I suspect that market could show retracement to 1.3280-1.33 area, since it has hit some intraday targets and shows “222” Sell pattern. After that the moment of truth will come – if market will return right above 1.3350, we may count on move to 1.3650. If not – then, I suppose, market will move to 1.30.
The technical portion of Sive's analysis owes a great deal to Joe DiNapoli's methods, and uses a number of Joe's proprietary indicators. Please note that Sive's analysis is his own view of the market and is not endorsed by Joe DiNapoli or any related companies.
It’s very difficult to comment just new single small candle on Monthly chart and create some wise thoughts here, so I leave mostly previous monthly analysis intact, since we need some more action to make discussion of monthly time frame useful and interesting.
Monthly trend formally still stands bullish. Although currently we see unconfirmed bear trend, we will be able to speak about trend change only at the end of October if market will close lower than 1.40 level. Current situation usually treats as “confirmed trend is bullish – unconfirmed trend is bearish”. Still, for most of us monthly trend is not very important, since there are not much traders who trade precisely on monthly chart. Significant Fib levels and areas of overbought/oversold are rather more interesting and important for us.
September month has closed at low and shown plunge that looks impressive. What we could expect from October from that standpoint? Well, only two things – downward continuation or consolidation. Monthly chart is not at oversold, so formally market has room to continue move down. We hardly could count on drastic reversal, since now monthly price action has downward momentum, and to reverse it needs to decrease pace first. Take a look at price action after strong down months, for example in April 2010 or October 2008 – they are doji. They are months of previous pace decreasing before reversal. Something like that market should to do if it will intend to change direction. If this will not be the case, then market will show downward continuation, and honestly speaking this looks more probable.
Still, market now stands at support area between 50% and 61.8% at 1.30-1.34 from whole move up. As we’ve said in previous research, this is also weekly Agreement area.
That’s why we still can’t exclude some pullback and some retracement on daily time frame. For instance, market could try to touch monthly pivot point at 1.3717, since pivots are traded in 70% of cases during the trading period.
Simultaneously we have to keep mind open for opposite price action, if bears are really strong – we should not be too surprised if market will break all supports and accelerates down further. Nearest target on monthly chart stands at 1.2905 from large AB-CD pattern – near major 0.618 Fib support 1.3039, so we might say that this is also a monthly Agreement. Current price action looks like Gartley “222” from AB swing on chart.
Weekly
This chart is a bit overload with details, but all of them are important for us. Trend is extremely bearish, so that I even not draw MACD indicator here. From that standpoint we should be interested in shorting this market. The nearest target that market could achieve during week is 1.29-1.30 Agreement area. This area is also weekly oversold and contains monthly pivot support. This is too early to speak about 1.618 target at 1.2750, since it stands beyond weekly oversold area.
Although during previous week retracement has had more chances to happen and currently they still remain, some signs tell that market has extremely bearish bias. Price has not respected strong monthly area and strong support around 50% monthly level. Now we see that market has accelerated right to 1.27 extension, significantly pierced 50% support level and creeps across with oversold without any bouncing. So, what can we do in terms of weekly chart – just jump-in is very dangerous, since market stands at support. Wait for retracement – but will it happen? It’s very difficult to say with confidence, since all that we have are – hammer pattern on weekly chart at support and hitting 1.27 Fib extension target.
Another potential reason for retracement, as we’ve discussed on previous week is pivot point of new month that stands slightly above the market at 1.3717. We know that market trades pivots in 70% of cases during the period. So this is logical to assume that market still could touch pivot before downward continuation. Very often, especially when market shows solid moves, it tests pivots in the beginning of period, it calls as “test and go”.
Hence, from this point of view, retracement up, even small, could happen. What levels market could reach? There are only two of them – nearest Fib resistance that coincides with pivot at 1.3680-1.3717, and, second one is K-area around previous lows at 1.3811-1.3850.
So, all that we can do is watch for lower time frames for signs of retracement, will they appear or not. On weekly time frame they are quite shallow.
Daily
Trend is bullish currently, but in such kind of price action this is not so important. Triple bullish divergence is still here. Market now is some kind of downward trading channel. Market has accomplished our target, that we’ve discussed on Friday – touched weekly pivot, K-resistance and turned to downside again.
Since we do not have any significant patterns, let’s discuss some levels that could become important for coming week. First, this is pivot point at 1.3347. If market at the beginning of the week will move below it, then, probably move down inside channel will continue, probably to 1.29 - 1.30 monthly 0.618 Support and Agreement area.
If, otherwise, it will hold above pivot, then there will be some chances of upward breakout of this channel, but market hardly will show significant move up fast, since 1.3640 is daily overbought. I suspect, that we will able to speak about retracement only after breakout of this channel.
4-hour
Here trend is turned bearish. Market has accomplished AB-CD pattern that we’ve discussed on previous week and turned to move down. In general this picture looks like Gartley “222” pattern, but target of this pattern could be different – it could continue move down right to 1.30 (large AB-CD pattern), or it could show just small retracement, say, to 1.33 area and then turn up again. Currently we can’t say that. But what we can do is to watch over 1.3350 area and pivot point as a breakeven point between bears and bulls, as we’ve said above. 1.618 extension target stands right at daily overbought at 1.3643. Downward target agrees with monthly Fib support level.
Conclusion:
Until market stands in downward channel we can’t be focus on some extended moves. Although, there are still chances exist of upward retracement on weekly chart, since market stands at support, on daily chart we have no confirmation and clear signs of that yet.
That’s why, in the beginning of the week our level to watch is pivot at 1.3350. I suspect that market could show retracement to 1.3280-1.33 area, since it has hit some intraday targets and shows “222” Sell pattern. After that the moment of truth will come – if market will return right above 1.3350, we may count on move to 1.3650. If not – then, I suppose, market will move to 1.30.
The technical portion of Sive's analysis owes a great deal to Joe DiNapoli's methods, and uses a number of Joe's proprietary indicators. Please note that Sive's analysis is his own view of the market and is not endorsed by Joe DiNapoli or any related companies.
")