Sive Morten
Special Consultant to the FPA
- Messages
- 18,627
EUR/USD Daily Update, Thu 13, October 2011
Good morning,
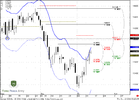
Despite how wise we are - market is always wiser. It seems - what stronger we can imagine, than combination of K-area, overbought and Agreement + pivot point? Nothing, I suppose, but still market has pierced this area and reached 1.618 target of Butterfly rather than just 1.27. I'm sure that in most cases - market starts the retracement in such conditions, but not always of cause...
So, what do we have today?
For daily bulls nothing has changed much - we are at overbought and Agreement. It's not the time to jump in. Wait for pullback. Probably the same we could apply to intraday bulls. But what about bears?
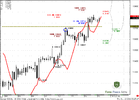
On 4-hour chart we see that 1.0 extension target from recent AB-CD stands right at daily overbought and creates an Agreement with daily Fib resistance at 1.3843. Also we see strong up bar right to 0.618 target, that is also a 1.618 form farer AB-CD. Existing of such bars near targets tells that there are a high probability of upward continuation. Also pay attention, that this could be Stop grabber on 4-hour chart at last candle, although it has not closed yet.
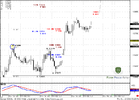
On hourly chart we see the same. Although trend has turned bearish and market is forming something like H&S - be extra carefull if you intend to take that signal. Strong thrusting move right to the target of Butterfly and AB-CD target tells that the probability of failure is high.
That's why if you still want to sell due this H&S - place stop somewhere above 1.3785 - Agreement and Overbought. This will add you more protection.
For conservative enter, I suppose we should see move below 1.37 to confirm intraday turning to retracement.
Good morning,
Despite how wise we are - market is always wiser. It seems - what stronger we can imagine, than combination of K-area, overbought and Agreement + pivot point? Nothing, I suppose, but still market has pierced this area and reached 1.618 target of Butterfly rather than just 1.27. I'm sure that in most cases - market starts the retracement in such conditions, but not always of cause...
So, what do we have today?
For daily bulls nothing has changed much - we are at overbought and Agreement. It's not the time to jump in. Wait for pullback. Probably the same we could apply to intraday bulls. But what about bears?
On 4-hour chart we see that 1.0 extension target from recent AB-CD stands right at daily overbought and creates an Agreement with daily Fib resistance at 1.3843. Also we see strong up bar right to 0.618 target, that is also a 1.618 form farer AB-CD. Existing of such bars near targets tells that there are a high probability of upward continuation. Also pay attention, that this could be Stop grabber on 4-hour chart at last candle, although it has not closed yet.
On hourly chart we see the same. Although trend has turned bearish and market is forming something like H&S - be extra carefull if you intend to take that signal. Strong thrusting move right to the target of Butterfly and AB-CD target tells that the probability of failure is high.
That's why if you still want to sell due this H&S - place stop somewhere above 1.3785 - Agreement and Overbought. This will add you more protection.
For conservative enter, I suppose we should see move below 1.37 to confirm intraday turning to retracement.
")