Sive Morten
Special Consultant to the FPA
- Messages
- 18,630
Fundamentals
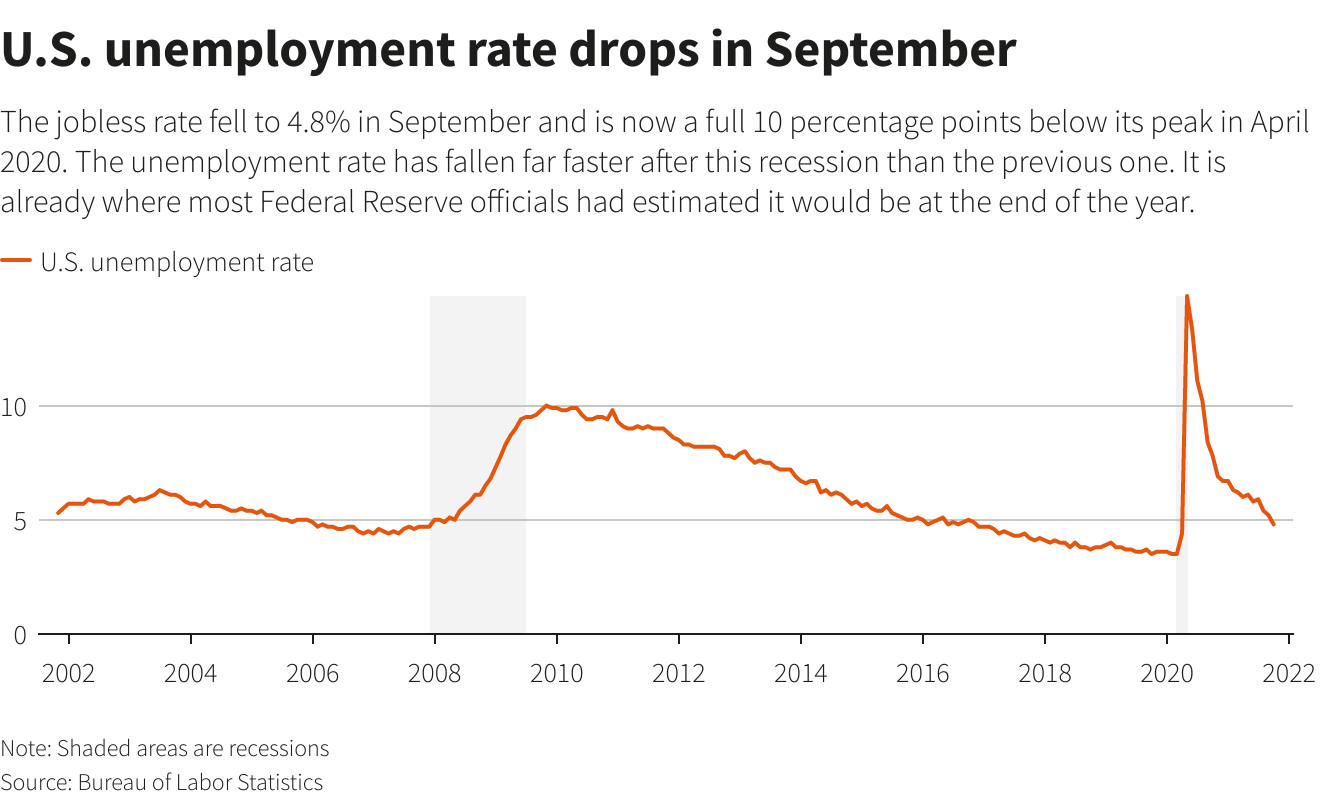
This week all eyes were on NFP report that has brought some volatility, especially on the gold market. But at the same time currently it is consensus opinion that any statistics barely change the Fed strategy as it was widely announced and only big misses in statistics could change something. Recent report actually was not as bad as it seems at first glance. Yes, numbers are two times worse, but last report was reviewed up and total NFP for September stands around 300K. Second is unemployment dropped to 4.8% while wage inflation jumps above expectations. So, I would treat report more in favor of US Dollar right now. If take a look at the structure of the numbers - you can see that private sector shows healthy surplus while major negative lag is because of government sector. But particularly private sector right now is the most important and it stands well. Thus, with proper analysis we could see the real context of report and are not deceived with bold numbers.
Market overview
The dollar climbed across the board on Wednesday, as surging energy prices fuelled concerns about inflation and interest rate hikes, knocking investors' appetite for riskier assets and driving flows to safe-havens. With oil prices hitting their highest in seven years, shares fell and government bond yields rose across the world early on Wednesday, before reversing some of the moves later in the session.
Crude oil rallied to a seven-year high before taking a breather from its recent torrid gains, while natural gas jumped to a record peak in Europe and coal prices from major exporters also hit all-time highs.
Rising inflationary pressures could pose headwinds to growth and have implications for how soon the Federal reserve can raise interest rates. The Federal Reserve has said it is likely to begin reducing its monthly bond purchases as soon as November and then follow it up with interest rate increases, as the U.S. central bank's turn from pandemic crisis policies gains momentum.
Investors remained on edge regarding U.S. debt ceiling negotiations, even as the top U.S. Senate Republican Mitch McConnell said his party would allow an extension of the federal debt ceiling into December, a move that would head off a historic default with a heavy economic toll.
Sterling/dollar implied volatility, a gauge of expected swings embedded in currency options, rose to a seven-month high around 7.9% on Wednesday, as soaring energy prices and a surge in bond yields sent the pound 0.3% lower against the greenback.
On Wednesday, Poland's central bank raised its main interest rate to 0.5% from 0.1% on Wednesday, it said in a statement, moving to increase borrowing costs earlier than analysts had expected to counter a surge in inflation.
The greenback's strength, combined with an aversion toward riskier currencies, sent the New Zealand dollar down 0.7% despite New Zealand's central bank hiking interest rates on Wednesday for the first time in seven years and signalling further tightening to come.
The U.S. dollar was little moved by a disappointing U.S. employment report on Friday, as traders bet that the numbers will not sway the Federal reserve from starting a tapering of its asset purchases as early as November. The Labor Department said in its employment report on Friday that nonfarm payrolls increased by 194,000 last month. Economists polled by Reuters had forecast an increase of 500,000 jobs.
The fact that the gain was modest could temper expectations for a swift acceleration in economic growth following an apparent sharp slowdown in the third quarter, but is unlikely to stop the Federal Reserve from starting the process of reducing its monthly bond purchases as soon as November, analysts said. September's employment report is the last one available before the Federal Reserve's Nov. 2-3 policy meeting.
Not surprisingly, President Joe Biden cast his lot with the first group. "Jobs up, wages up, unemployment down. That's progress," he said after the release of the report. Here are four data points that stood out.
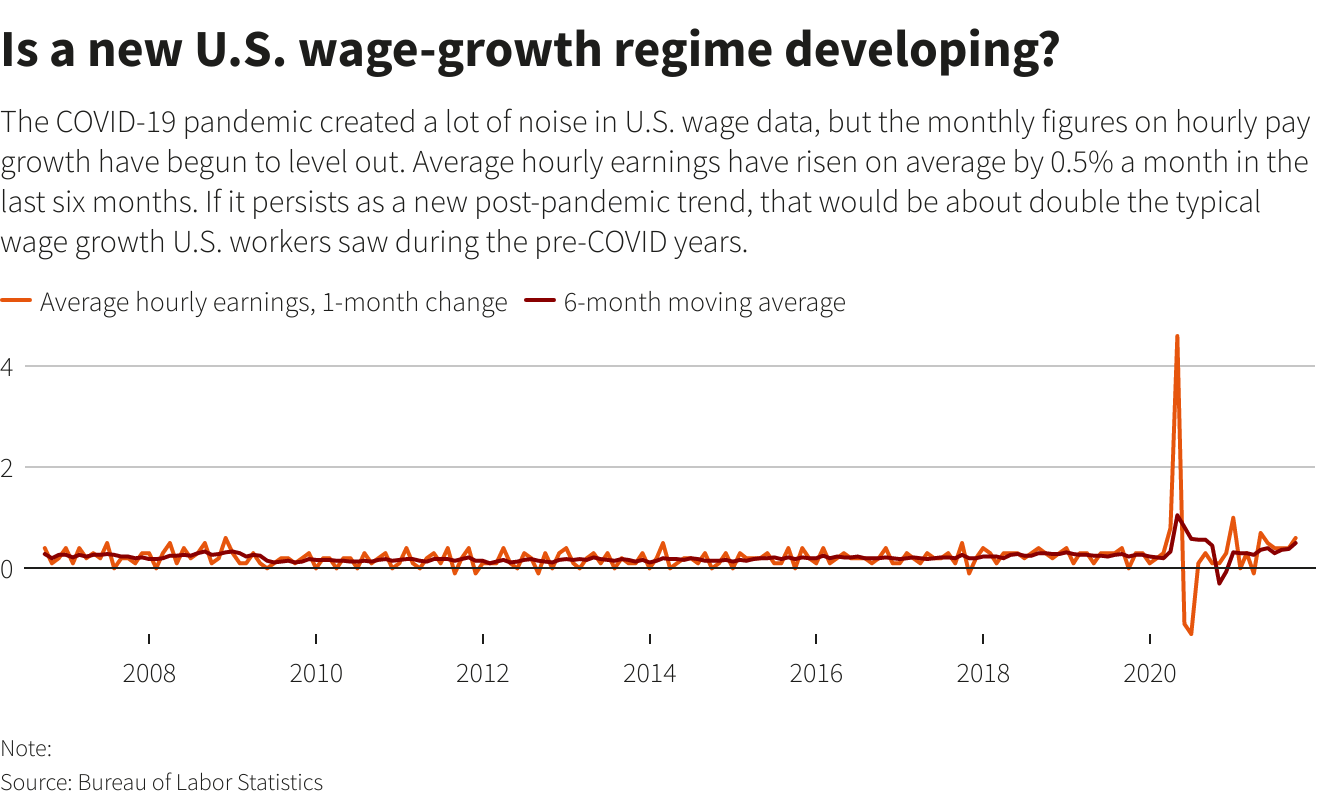
The Labor Department's average hourly earnings data, however, has settled down in the past half a year and a new - and for now higher - growth pattern appears to be emerging. Average hourly pay rose 0.6% last month - again more than expected - and over the last six months has now averaged a gain of 0.5% per month. That's roughly twice the monthly wage increase that prevailed before the pandemic.
Inflation running above the Bank of England's target of 2.0% is very concerning and must be managed to prevent it from becoming permanently embedded, the bank's governor, Andrew Bailey, said in an interview with The Yorkshire Post newspaper.
Bailey's comments appeared to favour the more hawkish side of the debate regarding the outlook for interest rates in Britain, despite growing signs of a slowing economy. Financial markets have already priced in a roughly 90% chance of a rate hike before the end of the year.
Consensus view on the US Dollar
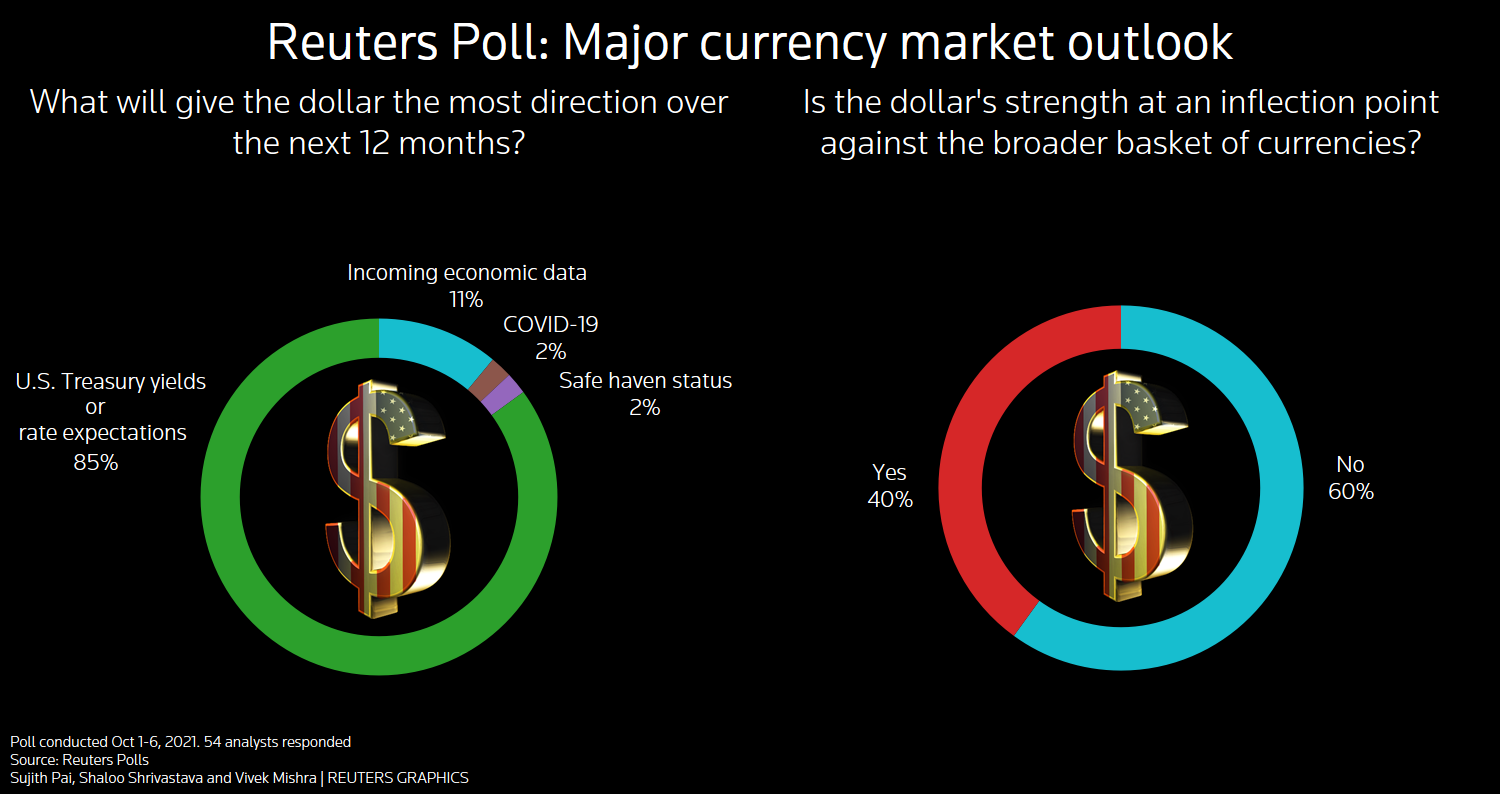
A Reuters poll of FX strategists found that the majority expect the dollar to remain dominant in the near term before ceding ground to its peers in a year. King dollar will dominate currency markets in the near term before ceding ground to its peers in a year, found a Reuters poll of FX strategists who said U.S. Treasury yields would give the greenback the most direction over the next 12 months.
Bolstered by the U.S. Federal Reserve's tapering plans and a growing chorus of Federal Open Market Committee members now forecasting a rate hike by the end of next year, benchmark yields in the U.S. have risen sharply. That has sent the dollar to levels not seen in more than a year.
Tracking the rise in U.S. Treasury yields, the dollar index (DXY) was up around 5% against majors for the year. Nearly half of those gains came in the past month, a trend expected to remain over the coming year.
An 85% majority of analysts, 46 of 54, who answered an additional question said U.S. Treasury yields and rate expectations would give the dollar the most direction over the next 12 months. Six said incoming economic data, one said its safe-haven status. The remaining analyst said developments around the COVID-19 pandemic would be the main driver.
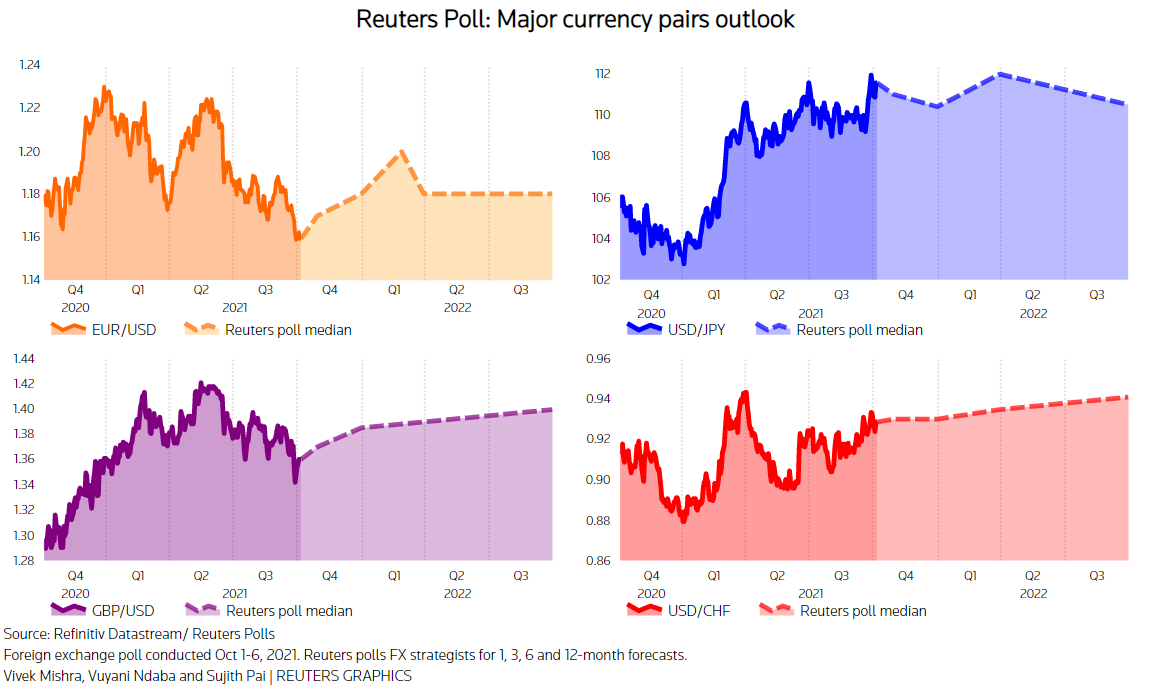
Results from a separate Reuters bonds poll forecast that while yields on U.S. Treasuries would rise further from current levels, the rate at which they have soared over the past month would not be sustained. Those findings lined up with the latest Reuters poll of more than 80 FX strategists, taken Oct. 1-6, who expected the dollar to dip marginally against most major currencies over the next 12 months.
The latest CFTC data showed speculators had raised their net long dollar positions to the highest since March 2020. While analysts held to their view the euro and other major currencies would strengthen against the dollar over the next 12 months - a view they have clung to for several years now - they forecast weaker gains than just a month ago.
Last changing hands around $1.15 on Wednesday, the common currency was forecast to rise around 2.3% to trade at $1.18 in a year. The latest median prediction was the lowest since August 2020.
Indeed, 22 of 76 analysts - nearly a third - who had forecasts that far into future expected the euro to weaken.
Among analysts who answered an additional question on whether the greenback's strength was at an inflection point, a near 60% majority of analysts, 29 of 48, said no. Asked when that point would be reached, only a handful expected it to come this year. The remaining majority gave a timeline ranging between early 2022 to end-2024.
COT Report
With the recent NFP impact we do not think that net EUR position should change too much. In fact, report was neutral, and I would say even dollar supportive a bit. Anyway, recent CFTC numbers shows big crush in sentiment as EUR net position has turned negative for the first time since Jan 2020. Data shows big jump in bearish positions as among speculators as among hedgers (who opened longs to hedge the EUR drop). All these stuff happens on a background of rising open interest:


Source: cftc.gov, charting by Investing.com
Next week to watch
#1 UK Data
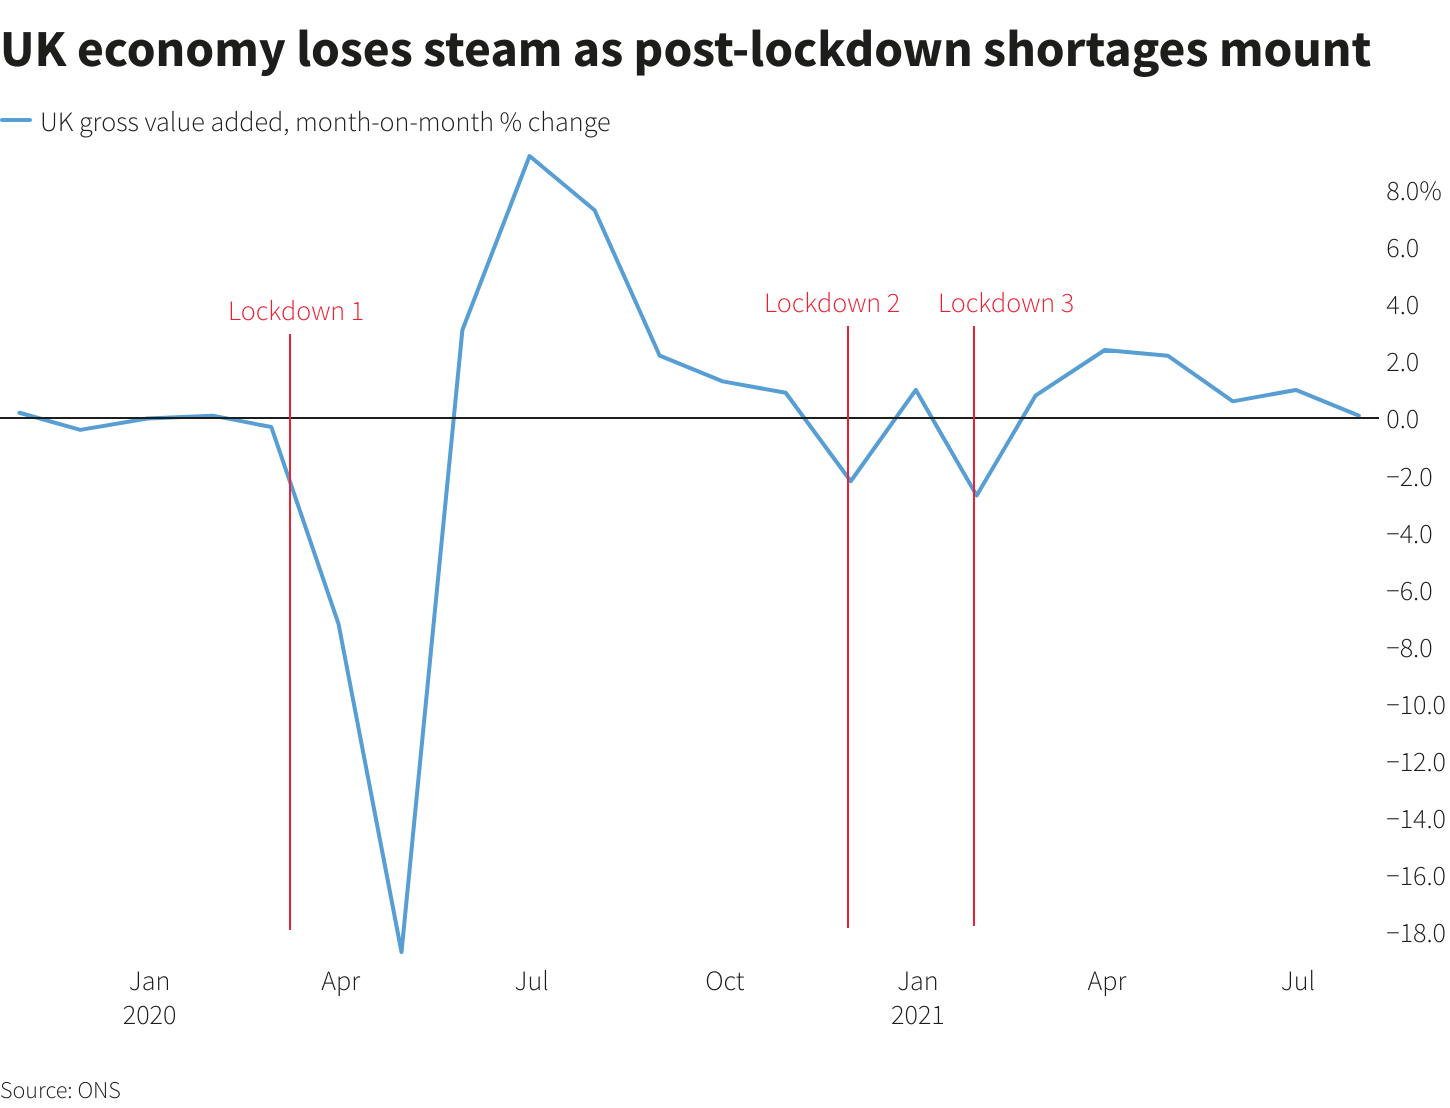
As Britain's economy shows signs of slowing amid rising prices, supply chain disruptions and staff shortages, upcoming data releases will grab attention. On Tuesday, the September unemployment count is published, with August unemployment rates and wage data. August gross domestic product data is released on Wednesday, alongside industrial and manufacturing numbers.
Markets are betting the Bank of England will join its peers and raise interest rates in February. But while British gilt yields have surged, the expectations have done nothing to lift sterling.
#2 US Debt Ceiling
Funds rebalancing portfolios and U.S. banks rushing to meet cash reserve rules tend to lift the dollar towards the end of each year. This year there are even more sources of support. First, the Fed looks set to taper stimulus. "Real" U.S. yields -- adjusted for inflation -- are deeply negative, but at -0.9%, compare favorably to Germany's -1.9%. With the ECB in no rush to tighten policy, the gap could widen.
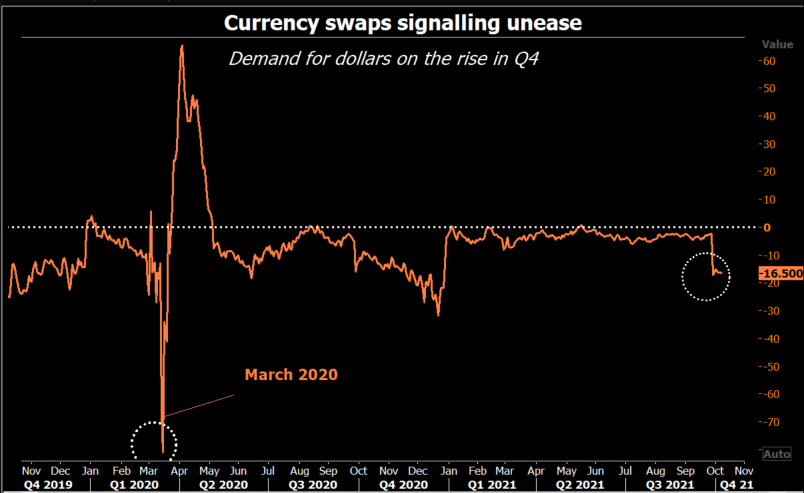
Second as economic growth moderates, stocks have fallen and boosted demand for safer assets including the dollar. The rally in commodities, traded mainly in dollars, is another inducement to buy the greenback. Unsurprisingly, the premium to access greenbacks is rising; euro-dollar three-month swap spreads are around 16 basis points, more than double end-September levels.
Headwinds? Markets could "sell the fact" once tapering happens. Another risk is the debt ceiling deadline, kicked out to Dec 3; a default while unlikely, could prove catastrophic. But even then, the dollar could catch a bid, as it did in 2008.
From the information above it becomes clear that general market opinion and its view on US Dollar perspective stands in tight relation to the interest rates and its dynamic. In fact this is not something new as all economy cycles are twisting around interest rates. While in a short-term we see consensus that interest rates should rise and dollar should keep its leadership, the difference stand on how long this tendency will last. With some opinion exists that interest rates can't rise with the same pace forever. Besides ECB also could adjust and review its inflation position. These factors potentially are treated as headwind for the US Dollar performance.
Based on forecasts above - EUR is expected to be flat around 1.18 (which takes 58% of dollar Index), while GBP is expected to rise slowly (which takes around 12% of the index). Combination of these currencies suggest that Dollar Index should turn to slow downside trend in 2022-2023.
We could be wrong but few reasons make us tend to idea of stronger dollar and have doubts on its weakness because a kind of interest rates slowdown and rivals performance. First reason is purely technical - our long-term Dollar index view. Yes, we have uncompleted 87.40 target and maybe it will be completed particularly because of reasons, mentioned above -
Second reason is fundamental processes in global economy. Inflation doesn't look temporal with 20% of global GDP was printed in recent 2 years (~ $20-25 Trln.) by Central Banks. Commodity prices go crazy showing big jump that is most evident sign of inflation. Statistics as in EU as in US shows consistent inflationary pressure in different numbers (NFP, CPI, PPI, PCE etc). Big personal savings in developed countries also suggest that sooner or later but this liquidity returns back into economy. Fiat money is loosing value incrementally. Even people who are far from any financial market could see this, when they try to buy something except food, maybe. This makes us think that if even dollar could get some temporal relief in some transition stages from now to first tapering and from last tapering to first rate change because of "Sell on fact", but in longer term dollar position looks stronger, at least in relation to EUR. ECB is too passive. And even with inflation hazard on horizon, they probably turn from a bit more aggressive PEPP to former and longer term APP. All these moments together makes us think that USD is in better long term shape than EUR.
Technicals
Monthly
This week guys, we need to update only short-term charts as long term picture mostly stands the same. It is difficult to call September as positive month to EUR. Trend remains bearish and market shows two bearish signs right in single month - confirms downside pennant breakout. Second - forms bearish reversal month in September. Despite that we could get some bounce in October as we've discussed, it seems that bearish saga on EUR is not over yet and could get continuation in Nov-Dec as we come closer to the first hawkish Fed step.

Weekly
Picture has not changed since last week. Market still stands in an area of important and strong support. Some reaction should happen but it seems that background for it is not ready yet. So, we need to wait a bit more. Supposedly, based on harmony here we could suggest a H&S - looking price action. It means that market could show 50% bounce to form potential right arm. Based on the EUR chart it should be somewhere to 1.20-1.21 area.
Market now stands slightly below as K-area as OP target. But it doesn't mean that level is broken yet as Dollar Index stands precisely at the level.

Daily
The most interesting things stand on daily chart. If EUR shows nothing interesting, but Dollar index does. We have bullish grabber, suggesting W&R of previous top, which correspondingly means that our plan of washing 1.15 area is still valid. In general if you take a look at markets reaction on NFP numbers you could see inconsistency to the numbers. Reaction stands like nothing negative was in the data. US interest rates has jumped ignoring headline poor numbers and watching to the core. The same is dollar index and EUR that was able to show just minor bounce on Friday. For us it means that we're still not hurry up with long entry...

Intraday
On 1H chart the upside retracement has changed the shape slightly but stuck at the same K-area and Agreement resistance. Now we have bearish (for EUR) grabber on DXY and clear "222" Sell on 1H chart. It seems that journey to 1.15 area has all chances to be continued. Besides, the AB-CD shape doesn't let us to conclude that EUR is reversing as it is typical for retracement.

This week all eyes were on NFP report that has brought some volatility, especially on the gold market. But at the same time currently it is consensus opinion that any statistics barely change the Fed strategy as it was widely announced and only big misses in statistics could change something. Recent report actually was not as bad as it seems at first glance. Yes, numbers are two times worse, but last report was reviewed up and total NFP for September stands around 300K. Second is unemployment dropped to 4.8% while wage inflation jumps above expectations. So, I would treat report more in favor of US Dollar right now. If take a look at the structure of the numbers - you can see that private sector shows healthy surplus while major negative lag is because of government sector. But particularly private sector right now is the most important and it stands well. Thus, with proper analysis we could see the real context of report and are not deceived with bold numbers.
Market overview
The dollar climbed across the board on Wednesday, as surging energy prices fuelled concerns about inflation and interest rate hikes, knocking investors' appetite for riskier assets and driving flows to safe-havens. With oil prices hitting their highest in seven years, shares fell and government bond yields rose across the world early on Wednesday, before reversing some of the moves later in the session.
Crude oil rallied to a seven-year high before taking a breather from its recent torrid gains, while natural gas jumped to a record peak in Europe and coal prices from major exporters also hit all-time highs.
"What you are seeing this week is more inflationary fears percolating into the overall market," said Minh Trang, senior currency trader at Silicon Valley Bank in Santa Clara, California. The question will be, does it force the Fed to move faster than expectations. If we are somewhere in the ballpark ... it supports the dollar trend that we have been seeing," Trang said.
Rising inflationary pressures could pose headwinds to growth and have implications for how soon the Federal reserve can raise interest rates. The Federal Reserve has said it is likely to begin reducing its monthly bond purchases as soon as November and then follow it up with interest rate increases, as the U.S. central bank's turn from pandemic crisis policies gains momentum.
Investors remained on edge regarding U.S. debt ceiling negotiations, even as the top U.S. Senate Republican Mitch McConnell said his party would allow an extension of the federal debt ceiling into December, a move that would head off a historic default with a heavy economic toll.
"This extension can ease some of the near‑term upside risk facing USD, but it will take a more resolute agreement than kicking the can down the road to remove the upside USD risk," Commonwealth Bank of Australia strategists wrote in a client note.
Sterling/dollar implied volatility, a gauge of expected swings embedded in currency options, rose to a seven-month high around 7.9% on Wednesday, as soaring energy prices and a surge in bond yields sent the pound 0.3% lower against the greenback.
On Wednesday, Poland's central bank raised its main interest rate to 0.5% from 0.1% on Wednesday, it said in a statement, moving to increase borrowing costs earlier than analysts had expected to counter a surge in inflation.
The greenback's strength, combined with an aversion toward riskier currencies, sent the New Zealand dollar down 0.7% despite New Zealand's central bank hiking interest rates on Wednesday for the first time in seven years and signalling further tightening to come.
"The biggest risk to a firmer dollar index probably comes from any substantial re-assessment of inflation risk from the European Central Bank," said ING strategists in a note to clients.
The U.S. dollar was little moved by a disappointing U.S. employment report on Friday, as traders bet that the numbers will not sway the Federal reserve from starting a tapering of its asset purchases as early as November. The Labor Department said in its employment report on Friday that nonfarm payrolls increased by 194,000 last month. Economists polled by Reuters had forecast an increase of 500,000 jobs.
The fact that the gain was modest could temper expectations for a swift acceleration in economic growth following an apparent sharp slowdown in the third quarter, but is unlikely to stop the Federal Reserve from starting the process of reducing its monthly bond purchases as soon as November, analysts said. September's employment report is the last one available before the Federal Reserve's Nov. 2-3 policy meeting.
"(It's a) miss on the headline number for sure, but the underlying details are not as really nefarious as the top-line miss would suggest and so, ultimately, it’s still consistent with the Fed delivering taper next month," said Mazen Issa, senior FX strategist, at TD Securities in New York.
Not surprisingly, President Joe Biden cast his lot with the first group. "Jobs up, wages up, unemployment down. That's progress," he said after the release of the report. Here are four data points that stood out.
The Labor Department's average hourly earnings data, however, has settled down in the past half a year and a new - and for now higher - growth pattern appears to be emerging. Average hourly pay rose 0.6% last month - again more than expected - and over the last six months has now averaged a gain of 0.5% per month. That's roughly twice the monthly wage increase that prevailed before the pandemic.
The disappointing jobs number could lead to a dip in the dollar but any such weakness was likely to be fleeting. I think the market is going to need a lot more convincing that just one jobs report that’s on the softer side is going to price the Fed out beyond late 2022 and into 2023," Issa said.
"I think that the Federal Reserve made it very clear that they don’t need a blockbuster jobs report to taper in November, so while you’re seeing a little bit of a pullback in the dollar, I think the Fed remains on track," said Kathy Lien, managing director at BK Asset Management in New York.
In the week following jobs data the dollar tends to reverse most of the gain or loss that has occurred from the day of the NFP release, FX strategists said in a BofA Global Research report on Thursday.
Inflation running above the Bank of England's target of 2.0% is very concerning and must be managed to prevent it from becoming permanently embedded, the bank's governor, Andrew Bailey, said in an interview with The Yorkshire Post newspaper.
"We are going to have a very delicate and challenging job on our hands so we have got to in a sense prevent the thing becoming permanently embedded because that would obviously be very damaging," Bailey told the newspaper. "Unfortunately, if you look at our last forecast, it is going to go higher, I am afraid."
Bailey's comments appeared to favour the more hawkish side of the debate regarding the outlook for interest rates in Britain, despite growing signs of a slowing economy. Financial markets have already priced in a roughly 90% chance of a rate hike before the end of the year.
Consensus view on the US Dollar
A Reuters poll of FX strategists found that the majority expect the dollar to remain dominant in the near term before ceding ground to its peers in a year. King dollar will dominate currency markets in the near term before ceding ground to its peers in a year, found a Reuters poll of FX strategists who said U.S. Treasury yields would give the greenback the most direction over the next 12 months.
Bolstered by the U.S. Federal Reserve's tapering plans and a growing chorus of Federal Open Market Committee members now forecasting a rate hike by the end of next year, benchmark yields in the U.S. have risen sharply. That has sent the dollar to levels not seen in more than a year.
Tracking the rise in U.S. Treasury yields, the dollar index (DXY) was up around 5% against majors for the year. Nearly half of those gains came in the past month, a trend expected to remain over the coming year.
An 85% majority of analysts, 46 of 54, who answered an additional question said U.S. Treasury yields and rate expectations would give the dollar the most direction over the next 12 months. Six said incoming economic data, one said its safe-haven status. The remaining analyst said developments around the COVID-19 pandemic would be the main driver.
Results from a separate Reuters bonds poll forecast that while yields on U.S. Treasuries would rise further from current levels, the rate at which they have soared over the past month would not be sustained. Those findings lined up with the latest Reuters poll of more than 80 FX strategists, taken Oct. 1-6, who expected the dollar to dip marginally against most major currencies over the next 12 months.
"The market in the near term is going to focus on the fact that we expect U.S. Treasury yields to keep rising on the back of the Fed's tapering of QE and also the ongoing recovery in the U.S. economy," said Tai Hui, chief Asia market strategist at JP Morgan Asset Management. Treasury yields are not going to rise indefinitely. At some point they're going to stabilize and I think that's when the dollar is going to face a bit more downward pressure and that's why we are still expecting the dollar to get weaker."
The latest CFTC data showed speculators had raised their net long dollar positions to the highest since March 2020. While analysts held to their view the euro and other major currencies would strengthen against the dollar over the next 12 months - a view they have clung to for several years now - they forecast weaker gains than just a month ago.
Last changing hands around $1.15 on Wednesday, the common currency was forecast to rise around 2.3% to trade at $1.18 in a year. The latest median prediction was the lowest since August 2020.
Indeed, 22 of 76 analysts - nearly a third - who had forecasts that far into future expected the euro to weaken.
"I think at this point in time, unless there's a real significant shift in fundamentals I don't think a correction in the dollar would extend very far," said Jane Foley, head of FX strategy at Rabobank.
Among analysts who answered an additional question on whether the greenback's strength was at an inflection point, a near 60% majority of analysts, 29 of 48, said no. Asked when that point would be reached, only a handful expected it to come this year. The remaining majority gave a timeline ranging between early 2022 to end-2024.
"The extrapolation of the dollar move and the rates move is probably excessive. I think you have to be careful not to exaggerate how much you actually know," said Steve Englander, head of G10 FX strategy at Standard Chartered.
COT Report
With the recent NFP impact we do not think that net EUR position should change too much. In fact, report was neutral, and I would say even dollar supportive a bit. Anyway, recent CFTC numbers shows big crush in sentiment as EUR net position has turned negative for the first time since Jan 2020. Data shows big jump in bearish positions as among speculators as among hedgers (who opened longs to hedge the EUR drop). All these stuff happens on a background of rising open interest:
Source: cftc.gov, charting by Investing.com
Next week to watch
#1 UK Data
As Britain's economy shows signs of slowing amid rising prices, supply chain disruptions and staff shortages, upcoming data releases will grab attention. On Tuesday, the September unemployment count is published, with August unemployment rates and wage data. August gross domestic product data is released on Wednesday, alongside industrial and manufacturing numbers.
Markets are betting the Bank of England will join its peers and raise interest rates in February. But while British gilt yields have surged, the expectations have done nothing to lift sterling.
#2 US Debt Ceiling
Funds rebalancing portfolios and U.S. banks rushing to meet cash reserve rules tend to lift the dollar towards the end of each year. This year there are even more sources of support. First, the Fed looks set to taper stimulus. "Real" U.S. yields -- adjusted for inflation -- are deeply negative, but at -0.9%, compare favorably to Germany's -1.9%. With the ECB in no rush to tighten policy, the gap could widen.
Second as economic growth moderates, stocks have fallen and boosted demand for safer assets including the dollar. The rally in commodities, traded mainly in dollars, is another inducement to buy the greenback. Unsurprisingly, the premium to access greenbacks is rising; euro-dollar three-month swap spreads are around 16 basis points, more than double end-September levels.
Headwinds? Markets could "sell the fact" once tapering happens. Another risk is the debt ceiling deadline, kicked out to Dec 3; a default while unlikely, could prove catastrophic. But even then, the dollar could catch a bid, as it did in 2008.
From the information above it becomes clear that general market opinion and its view on US Dollar perspective stands in tight relation to the interest rates and its dynamic. In fact this is not something new as all economy cycles are twisting around interest rates. While in a short-term we see consensus that interest rates should rise and dollar should keep its leadership, the difference stand on how long this tendency will last. With some opinion exists that interest rates can't rise with the same pace forever. Besides ECB also could adjust and review its inflation position. These factors potentially are treated as headwind for the US Dollar performance.
Based on forecasts above - EUR is expected to be flat around 1.18 (which takes 58% of dollar Index), while GBP is expected to rise slowly (which takes around 12% of the index). Combination of these currencies suggest that Dollar Index should turn to slow downside trend in 2022-2023.
We could be wrong but few reasons make us tend to idea of stronger dollar and have doubts on its weakness because a kind of interest rates slowdown and rivals performance. First reason is purely technical - our long-term Dollar index view. Yes, we have uncompleted 87.40 target and maybe it will be completed particularly because of reasons, mentioned above -
But, 87.40 is just a last bearish stage in global cycle that should start new upward stage, once 87.40 is hit. At least, this follows from technical picture."The market in the near term is going to focus on the fact that we expect U.S. Treasury yields to keep rising on the back of the Fed's tapering of QE and also the ongoing recovery in the U.S. economy," said Tai Hui, chief Asia market strategist at JP Morgan Asset Management. Treasury yields are not going to rise indefinitely. At some point they're going to stabilize and I think that's when the dollar is going to face a bit more downward pressure and that's why we are still expecting the dollar to get weaker."
Second reason is fundamental processes in global economy. Inflation doesn't look temporal with 20% of global GDP was printed in recent 2 years (~ $20-25 Trln.) by Central Banks. Commodity prices go crazy showing big jump that is most evident sign of inflation. Statistics as in EU as in US shows consistent inflationary pressure in different numbers (NFP, CPI, PPI, PCE etc). Big personal savings in developed countries also suggest that sooner or later but this liquidity returns back into economy. Fiat money is loosing value incrementally. Even people who are far from any financial market could see this, when they try to buy something except food, maybe. This makes us think that if even dollar could get some temporal relief in some transition stages from now to first tapering and from last tapering to first rate change because of "Sell on fact", but in longer term dollar position looks stronger, at least in relation to EUR. ECB is too passive. And even with inflation hazard on horizon, they probably turn from a bit more aggressive PEPP to former and longer term APP. All these moments together makes us think that USD is in better long term shape than EUR.
Technicals
Monthly
This week guys, we need to update only short-term charts as long term picture mostly stands the same. It is difficult to call September as positive month to EUR. Trend remains bearish and market shows two bearish signs right in single month - confirms downside pennant breakout. Second - forms bearish reversal month in September. Despite that we could get some bounce in October as we've discussed, it seems that bearish saga on EUR is not over yet and could get continuation in Nov-Dec as we come closer to the first hawkish Fed step.
Weekly
Picture has not changed since last week. Market still stands in an area of important and strong support. Some reaction should happen but it seems that background for it is not ready yet. So, we need to wait a bit more. Supposedly, based on harmony here we could suggest a H&S - looking price action. It means that market could show 50% bounce to form potential right arm. Based on the EUR chart it should be somewhere to 1.20-1.21 area.
Market now stands slightly below as K-area as OP target. But it doesn't mean that level is broken yet as Dollar Index stands precisely at the level.
Daily
The most interesting things stand on daily chart. If EUR shows nothing interesting, but Dollar index does. We have bullish grabber, suggesting W&R of previous top, which correspondingly means that our plan of washing 1.15 area is still valid. In general if you take a look at markets reaction on NFP numbers you could see inconsistency to the numbers. Reaction stands like nothing negative was in the data. US interest rates has jumped ignoring headline poor numbers and watching to the core. The same is dollar index and EUR that was able to show just minor bounce on Friday. For us it means that we're still not hurry up with long entry...
Intraday
On 1H chart the upside retracement has changed the shape slightly but stuck at the same K-area and Agreement resistance. Now we have bearish (for EUR) grabber on DXY and clear "222" Sell on 1H chart. It seems that journey to 1.15 area has all chances to be continued. Besides, the AB-CD shape doesn't let us to conclude that EUR is reversing as it is typical for retracement.