Dear Sive,
Thank you for your excellent analysis. No question, you're one of the best and please keep us teaching as long as you can.
But, if you don't mind I'd like to add my view, because I think a short from this level is not really a good action.
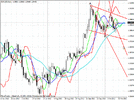
If we draw a triangle around current consolidation on the daily chart and not a flag as you suggested that changes the picture in my opinion.
Also, because the last Thu&Fri closes are above 1.2920 which was an important resistance at the left leg of the double bottom consolidation.
Of course we can't ignore the short potential to 1.27, 1.26 and finally to 1.2430-1.25, but I think the current momentum is quite bullish when you consider that on top of the above the last week was only an inside week after the bullish engulfing candle from the week before.
So, I think the best is probably to wait for the breakout or at least enter short a bit higher. It can be reasonable 1.3030-1.3050 at the top border once the gap is filled from last week.
Looking a bit further a rally above 1.32 is also reasonable. I trade naked, looking only supply & demand. As you will see on the chart the 1.618 fibo extension (1.3260 ish) of the last swing is in the same range as the next important supply zone (1.3230-1.3280).
I'm far not as experienced as you are, but when your harmonic pattern targets or entries are matching the supply / demand zones I'm trading, I found this scenarios quite high probability trade setups.
Could you comment?
Thnx

Thank you for your excellent analysis. No question, you're one of the best and please keep us teaching as long as you can.
But, if you don't mind I'd like to add my view, because I think a short from this level is not really a good action.
If we draw a triangle around current consolidation on the daily chart and not a flag as you suggested that changes the picture in my opinion.
Also, because the last Thu&Fri closes are above 1.2920 which was an important resistance at the left leg of the double bottom consolidation.
Of course we can't ignore the short potential to 1.27, 1.26 and finally to 1.2430-1.25, but I think the current momentum is quite bullish when you consider that on top of the above the last week was only an inside week after the bullish engulfing candle from the week before.
So, I think the best is probably to wait for the breakout or at least enter short a bit higher. It can be reasonable 1.3030-1.3050 at the top border once the gap is filled from last week.
Looking a bit further a rally above 1.32 is also reasonable. I trade naked, looking only supply & demand. As you will see on the chart the 1.618 fibo extension (1.3260 ish) of the last swing is in the same range as the next important supply zone (1.3230-1.3280).
I'm far not as experienced as you are, but when your harmonic pattern targets or entries are matching the supply / demand zones I'm trading, I found this scenarios quite high probability trade setups.
Could you comment?
Thnx