Sive Morten
Special Consultant to the FPA
- Messages
- 18,648
Monthly
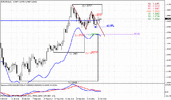
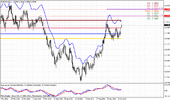
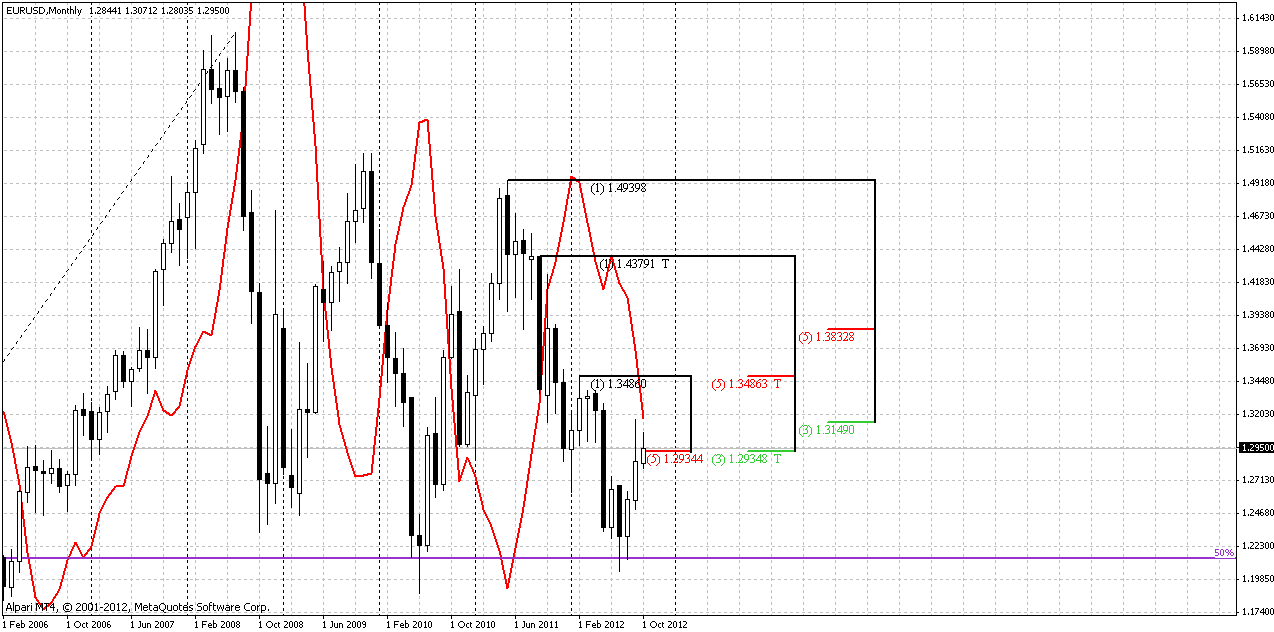
Although market has shown some deeper invasion inside of monthly Confluence resistance overall picture has not changed much since previous week. Probably in today’s research we again will be focused on lower time frame analysis.
On monthly chart trend holds bullish. After first pullback from K-resistance area, price again has entered inside this range. After two weeks passed October is still an inside month for September bar. All that we can see here is that market stands at long-term strong resistance.
Weekly
If you let me, I hold some text from previous research for some time, since this looks important for me. If you remember this discussion – you can skip reading this and move right to current weeks ovbservation:
“Speaking about weekly chart, it makes sense to re-read previous comments. All our suggestions are based on thought that currently we have first bullish swing up. This is very important for medium term perspective. Take a look – if we will treat as last swing down just small swing down from 1.2750, then our assumption is correct. But what if we have to treat as recent swing down whole butterfly move? This suspicion has come to me, because it was too small retracement on a way down before 1.2750 top. In this case we do not have bullish reversal swing. Hence we will not get deep retracement to 1.25. If market indeed is reversing up – it should show upward reversal swing, but it should be higher than 1.35 – the starting point of butterfly swing down. From the other side, if market will not reverse, we should get downward continuation, since from that swing calculation we just have next lower high in long term bear trend.
Speaking simply, if we were wrong by treating current swing up as reversal, we could get upward continuation and our thought about downward AB=CD on daily will be wrong. If this is not a reversal swing, then donward move will start, but it will not stop around 1.25 and continue futher.”
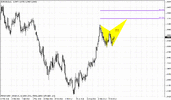
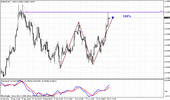
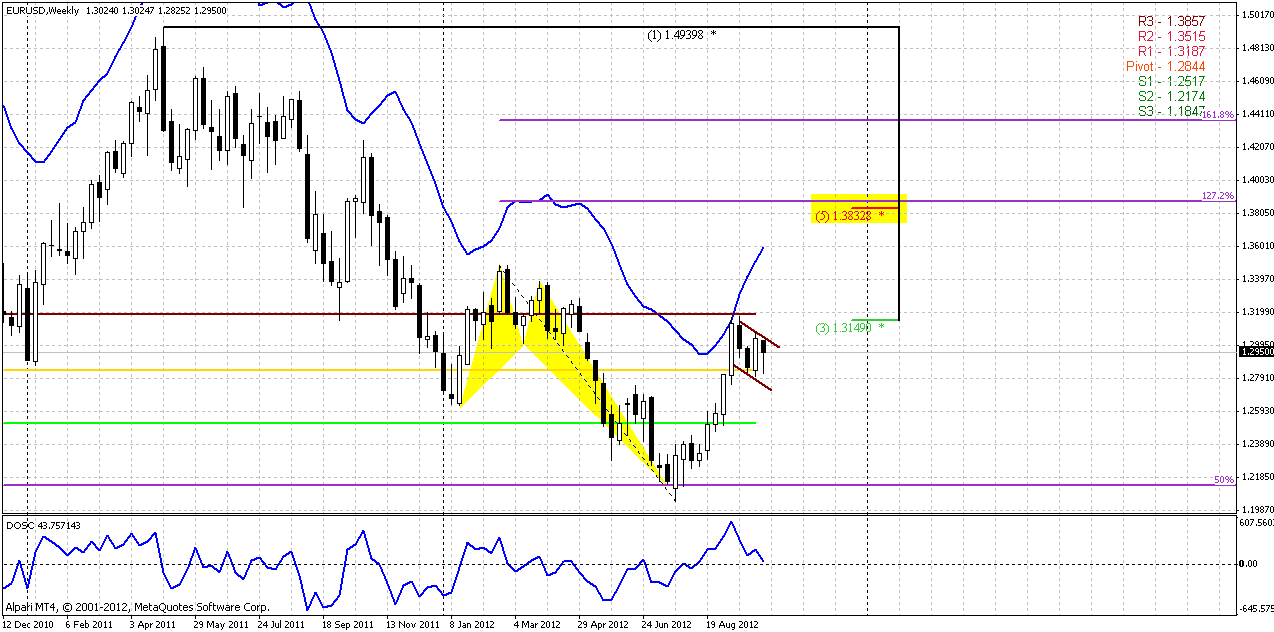
Today there are some moments on weekly that worthy of our attention. First one is most educational and relates to Stretch pattern. Now you can see clear example why Stretch is tricky pattern. Since we know that oversold and overbought levels are dynamic and stretch pattern target is a middle point between them (zero point on DOSC) – you can see how overbought line drifts higher and target point moves to current price level while price itself holds flat in tight range. Thus, without any price action target itself reaches current price. When such correction of overbought/oversold happens fast – you can get even a loss, since it needs to close position while price action might not show desireble move in favor of position. Always keep in mind this, when think about taking position by Stretch pattern.
Now let’s turn to pratical issues. Trend holds bullish here and price stands above MPP. Fortunately we have a pattern here – bullish flag. It can become very useful for our understanding of price action in medium-term perspective, especially with some difficulties of swing treatment. If market will break down bullish pattern this will tell us that something is wrong with bullish ambitions. Besides, market will probably move below MPP in this case. That is very important, because such price action could mean first - continuation of 1.5 year bear trend, second – that current swing up mistakenly treated as bullish reversal swing (read higher about it).
If situation will develop in nominal bullish mode and bullish flag, as it has to, will lead price to upward continuation, then classical target measurement points on the same 1.3840 level – length of the flag’s mast counted up from flag’s breakout point. That is also target of butterfly “buy” and major 5/8 Fib resistance on monthly chart.
May be flag, as a pattern of foundation, is not impressive, but, from the other side we do have nothing else here.
I foresee your question about down retracement on daily to 1.26 - 1.2750 level, how we can combine them? Here is no contradiction, if market will show another week inside the flag – then even move to 1.2650 area will not break the support line of the flag. But if you remember, we’ve discussed that there might be no downward continuation, if market will break 1.3040 level on daily.
Daily
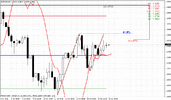
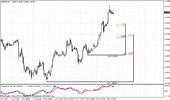
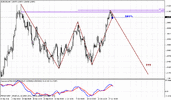
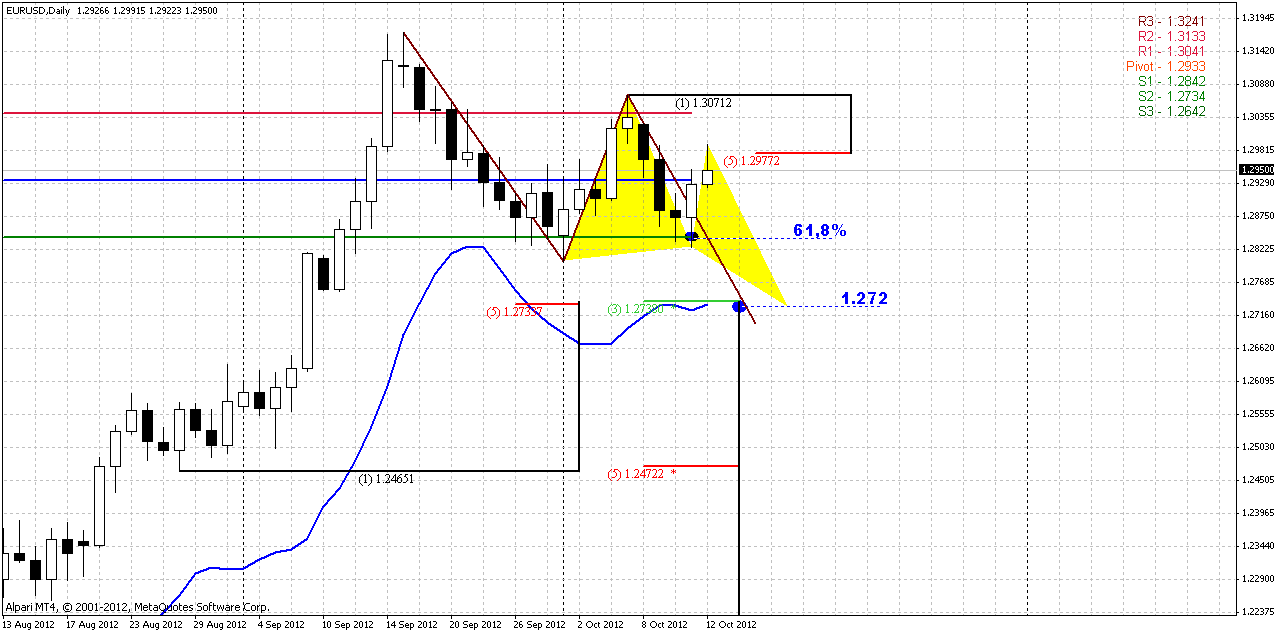
Current analysis is, in fact, just a continuation of our updates on previous week. The key figure here is 0.618 target of downward AB=CD pattern and upper retracement after it. Such retracements after hitting of just 0.618 minor fib extension target are not forbidden, but they should not trigger too deep retracement, if market holds bearish bias. On daily time frame we already have this retracement. If market will hold here then we can count on move to 1.2730-1.2740 area. Here three different pattern have their targets – large AB=CD, Butterfly “Buy” and small AB=CD inside the butterfly pattern.
4-hour
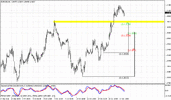
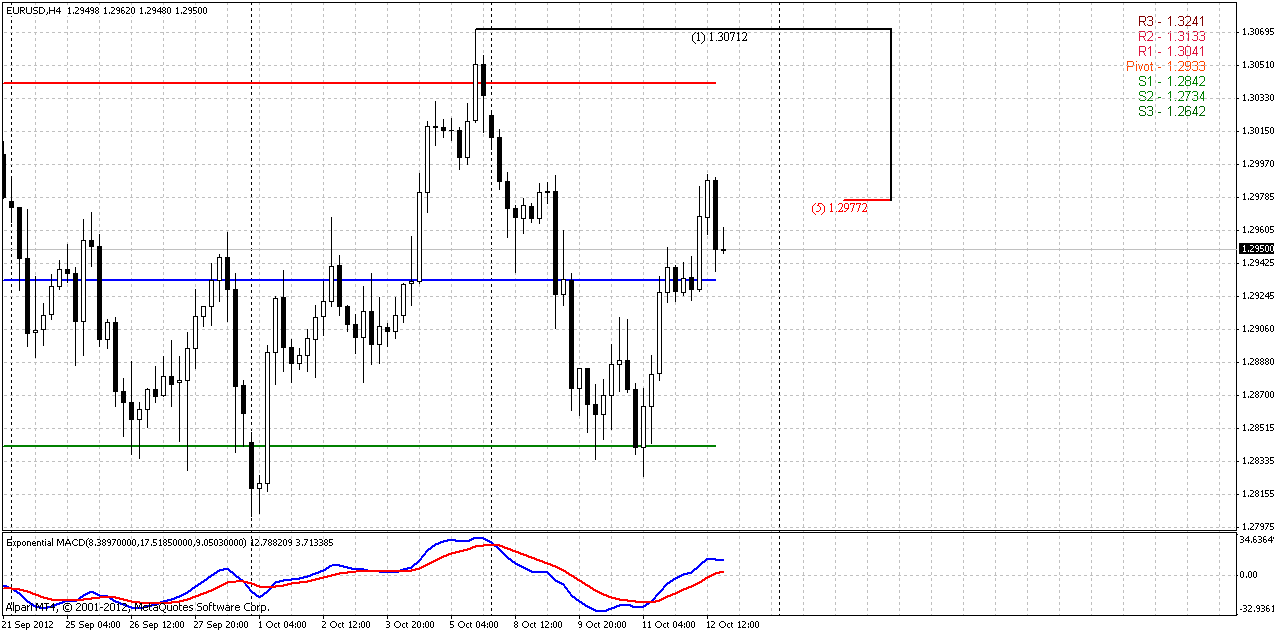
This chart shows nice bearish engulfing pattern right at resistance that might be a finish point of retracement up before move to 1.27-1.2750 area. Pattern might be usefull as well, since it could assist us in stop placing.
1-hour
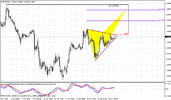
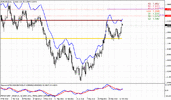
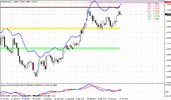
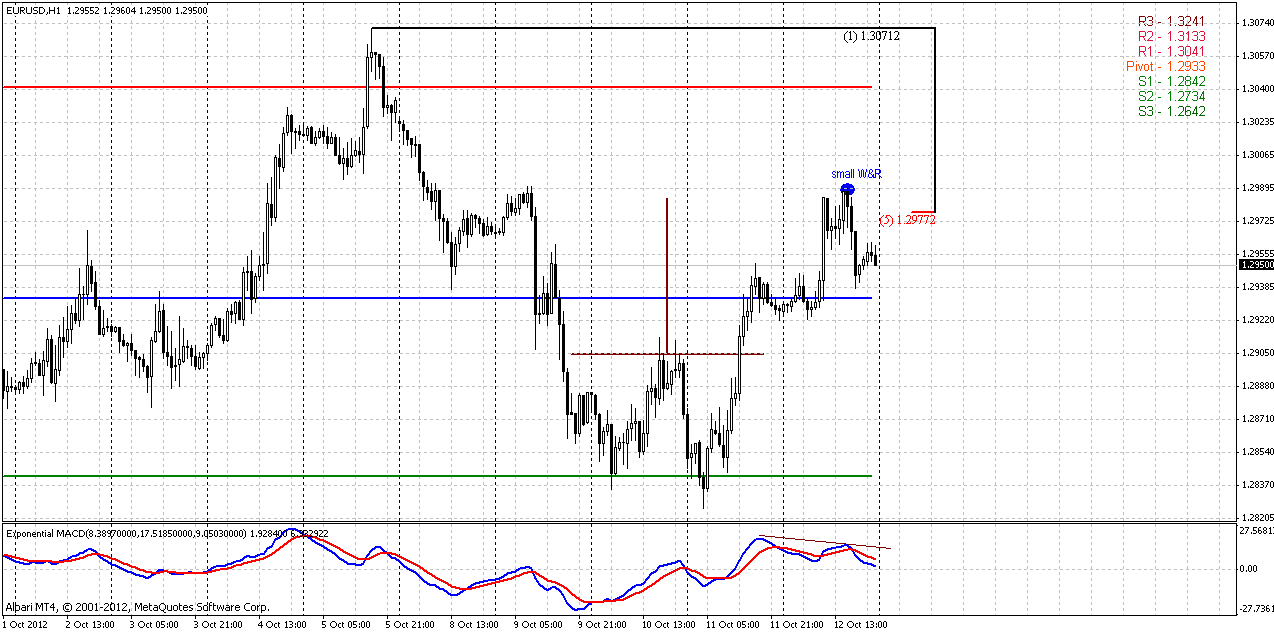
Hourly chart shows that our Double Bottom pattern has hit the target, trend turns bearish and market has shown small Wash&Rinse pattern right around 5/8 resistance. So, making conclusion here, the single possibility that we have is to enter short. Because daily trend is bearish, hourly trend is bearish, price stands at point that is logical finish of retracement after 0.618 Fib extension on daily. Bearish engulfing and W&R allows us to place tight stop right above 1.2990 high and try to take part in solid move down. For Long entry there is no sufficient context. True move above 1.30 will significantly change overall look at short-term perspective and it will be strange for bearish bias.
Conclusion:
So, in medium term perspective weekly flag pattern will dot all the “i”s, but this probably will happen a bit later, not on coming week. Flag allows downward move to 1.27 level as well, and does not hinder potential move down on daily.
In short-term perspective to my mind we have no much choice. There is no context for long entry, so probably we can try to enter short, especially because we can place tight stop and risk/reward is significant. But anyway it lies with you to decide this question.
The technical portion of Sive's analysis owes a great deal to Joe DiNapoli's methods, and uses a number of Joe's proprietary indicators. Please note that Sive's analysis is his own view of the market and is not endorsed by Joe DiNapoli or any related companies.
Although market has shown some deeper invasion inside of monthly Confluence resistance overall picture has not changed much since previous week. Probably in today’s research we again will be focused on lower time frame analysis.
On monthly chart trend holds bullish. After first pullback from K-resistance area, price again has entered inside this range. After two weeks passed October is still an inside month for September bar. All that we can see here is that market stands at long-term strong resistance.

Weekly
If you let me, I hold some text from previous research for some time, since this looks important for me. If you remember this discussion – you can skip reading this and move right to current weeks ovbservation:
“Speaking about weekly chart, it makes sense to re-read previous comments. All our suggestions are based on thought that currently we have first bullish swing up. This is very important for medium term perspective. Take a look – if we will treat as last swing down just small swing down from 1.2750, then our assumption is correct. But what if we have to treat as recent swing down whole butterfly move? This suspicion has come to me, because it was too small retracement on a way down before 1.2750 top. In this case we do not have bullish reversal swing. Hence we will not get deep retracement to 1.25. If market indeed is reversing up – it should show upward reversal swing, but it should be higher than 1.35 – the starting point of butterfly swing down. From the other side, if market will not reverse, we should get downward continuation, since from that swing calculation we just have next lower high in long term bear trend.
Speaking simply, if we were wrong by treating current swing up as reversal, we could get upward continuation and our thought about downward AB=CD on daily will be wrong. If this is not a reversal swing, then donward move will start, but it will not stop around 1.25 and continue futher.”
Today there are some moments on weekly that worthy of our attention. First one is most educational and relates to Stretch pattern. Now you can see clear example why Stretch is tricky pattern. Since we know that oversold and overbought levels are dynamic and stretch pattern target is a middle point between them (zero point on DOSC) – you can see how overbought line drifts higher and target point moves to current price level while price itself holds flat in tight range. Thus, without any price action target itself reaches current price. When such correction of overbought/oversold happens fast – you can get even a loss, since it needs to close position while price action might not show desireble move in favor of position. Always keep in mind this, when think about taking position by Stretch pattern.
Now let’s turn to pratical issues. Trend holds bullish here and price stands above MPP. Fortunately we have a pattern here – bullish flag. It can become very useful for our understanding of price action in medium-term perspective, especially with some difficulties of swing treatment. If market will break down bullish pattern this will tell us that something is wrong with bullish ambitions. Besides, market will probably move below MPP in this case. That is very important, because such price action could mean first - continuation of 1.5 year bear trend, second – that current swing up mistakenly treated as bullish reversal swing (read higher about it).
If situation will develop in nominal bullish mode and bullish flag, as it has to, will lead price to upward continuation, then classical target measurement points on the same 1.3840 level – length of the flag’s mast counted up from flag’s breakout point. That is also target of butterfly “buy” and major 5/8 Fib resistance on monthly chart.
May be flag, as a pattern of foundation, is not impressive, but, from the other side we do have nothing else here.
I foresee your question about down retracement on daily to 1.26 - 1.2750 level, how we can combine them? Here is no contradiction, if market will show another week inside the flag – then even move to 1.2650 area will not break the support line of the flag. But if you remember, we’ve discussed that there might be no downward continuation, if market will break 1.3040 level on daily.

Daily
Current analysis is, in fact, just a continuation of our updates on previous week. The key figure here is 0.618 target of downward AB=CD pattern and upper retracement after it. Such retracements after hitting of just 0.618 minor fib extension target are not forbidden, but they should not trigger too deep retracement, if market holds bearish bias. On daily time frame we already have this retracement. If market will hold here then we can count on move to 1.2730-1.2740 area. Here three different pattern have their targets – large AB=CD, Butterfly “Buy” and small AB=CD inside the butterfly pattern.

4-hour
This chart shows nice bearish engulfing pattern right at resistance that might be a finish point of retracement up before move to 1.27-1.2750 area. Pattern might be usefull as well, since it could assist us in stop placing.

1-hour
Hourly chart shows that our Double Bottom pattern has hit the target, trend turns bearish and market has shown small Wash&Rinse pattern right around 5/8 resistance. So, making conclusion here, the single possibility that we have is to enter short. Because daily trend is bearish, hourly trend is bearish, price stands at point that is logical finish of retracement after 0.618 Fib extension on daily. Bearish engulfing and W&R allows us to place tight stop right above 1.2990 high and try to take part in solid move down. For Long entry there is no sufficient context. True move above 1.30 will significantly change overall look at short-term perspective and it will be strange for bearish bias.

Conclusion:
So, in medium term perspective weekly flag pattern will dot all the “i”s, but this probably will happen a bit later, not on coming week. Flag allows downward move to 1.27 level as well, and does not hinder potential move down on daily.
In short-term perspective to my mind we have no much choice. There is no context for long entry, so probably we can try to enter short, especially because we can place tight stop and risk/reward is significant. But anyway it lies with you to decide this question.
The technical portion of Sive's analysis owes a great deal to Joe DiNapoli's methods, and uses a number of Joe's proprietary indicators. Please note that Sive's analysis is his own view of the market and is not endorsed by Joe DiNapoli or any related companies.
