Sive Morten
Special Consultant to the FPA
- Messages
- 18,648
Monthly
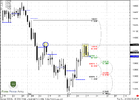
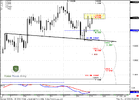
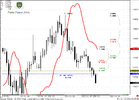
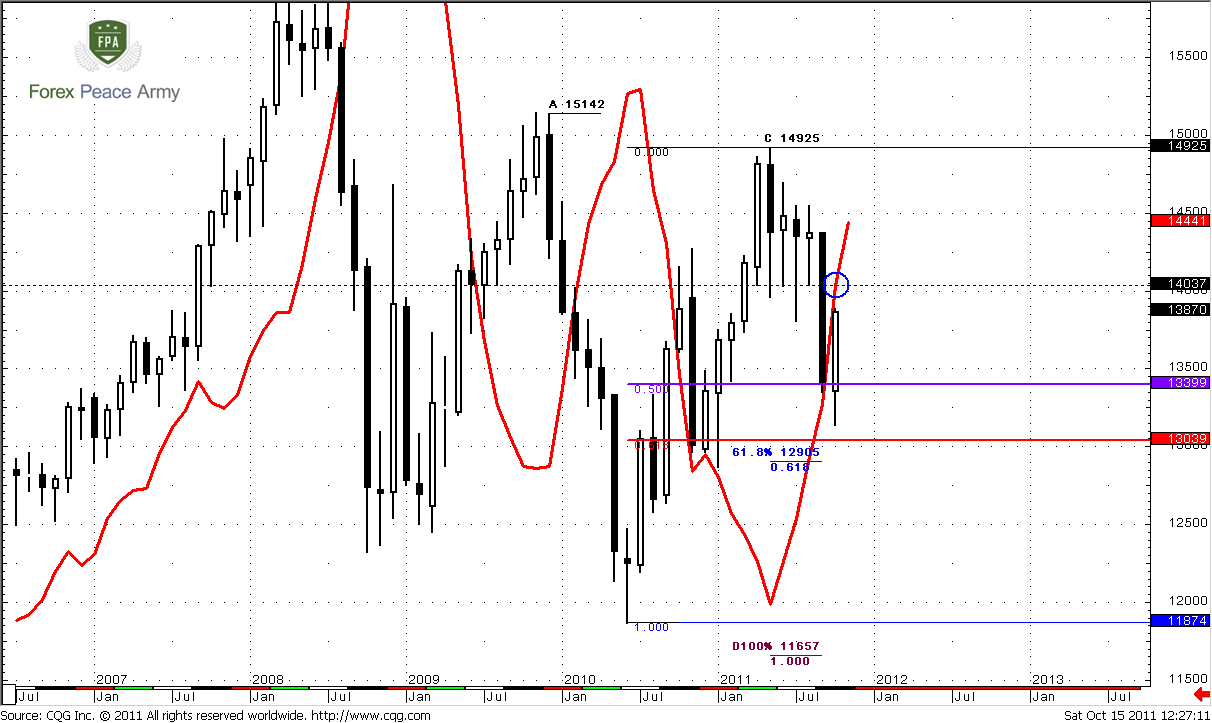
As you remember we’ve spoken about possible retracement during whole previous month. It should be more logical if it had happened two weeks ago, but market rarely does absolutely logical steps, so, we’ve seen this pullback only during past week. Anyway, this pullback has started. But is it absolutely correct to treat is as pullback on monthly chart? May be we have to treat as pullback previous down move? Really, if we will take a look at the chart we will see two things – first is confirmed bullish trend, second is deep 50% retracement, but still this is just a retracement from previous upswing. We treat current move up as pullback just because it’s smaller than previous move down, but actually this is not a big deal, how to call it. The most important, what we have to keep an eye on monthly chart. And I suppose that it will be price action versus MACD.
Today’s discussion of monthly chart will be dedicated mostly to trend. The red line on the chart is DiNapoli MACD Predictor. It acts as simple MACD, but uses price chart instead of second line. When price stands above red line – simple MACD shows uptrend, when it stands below – downtrend. But despite this common using of MACDP, this indicator has a lot of additional tools and one of them – prediction of precise price, where trend will change and simple MACD will show line crossing. It is happening so, that this tool will need as in near-term. Look at level in blue circle – this is trend breakeven point for October – 1.4037, and it stands below our target on daily time frame and just 200 pips away from current market. How do you think, is it too far in terms of monthly chart? Surely not. I think you are starting to catch my idea, right? If market will close above that level in October – we will get huge bullish stop grabber and perfect context for enter long with target at least around 1.50. Context will be perfect, since we will need just October range and retracement to possess ourselves in big move on monthly chart. This will give us outstanding risk/reward ratio.
But let’s suppose that you do not trade on monthly charts. Fine. But still you will know the overall direction – to 1.50. This will allow you to enter long on lower time frames without scare to catch deep pullback or drawdown. Other words you will know the direction and target of the market for 1-3 months ahead. Isn’t it cool?
You might say, that this is just a theory, and assumption, may be this will not happen – and you are 100% right. But that is a work of analyst – to look at picture in perspective. What’s the use from just poor description of past price action? Besides, monthly chart is rather long-term, and it’s just impossible to find something new on weekly basis here. Anyway, if this scenario will not happen, we will start to search another one, but currently I can’t find the reasons why this perspective could be unreal. It’s worthy to track monthly chart from that point of view.
Simultaneously we have to keep mind open for opposite price action, if bears are really strong – we should not be too surprised if market will break all supports and accelerates down further. Nearest target on monthly chart stands at 1.2905 from large AB-CD pattern – near major 0.618 Fib support 1.3039, so we might say that this is also a monthly Agreement. Current price action looks like Gartley “222” from AB swing on chart, so we can’t exclude that also.
Weekly
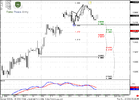
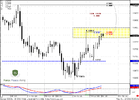
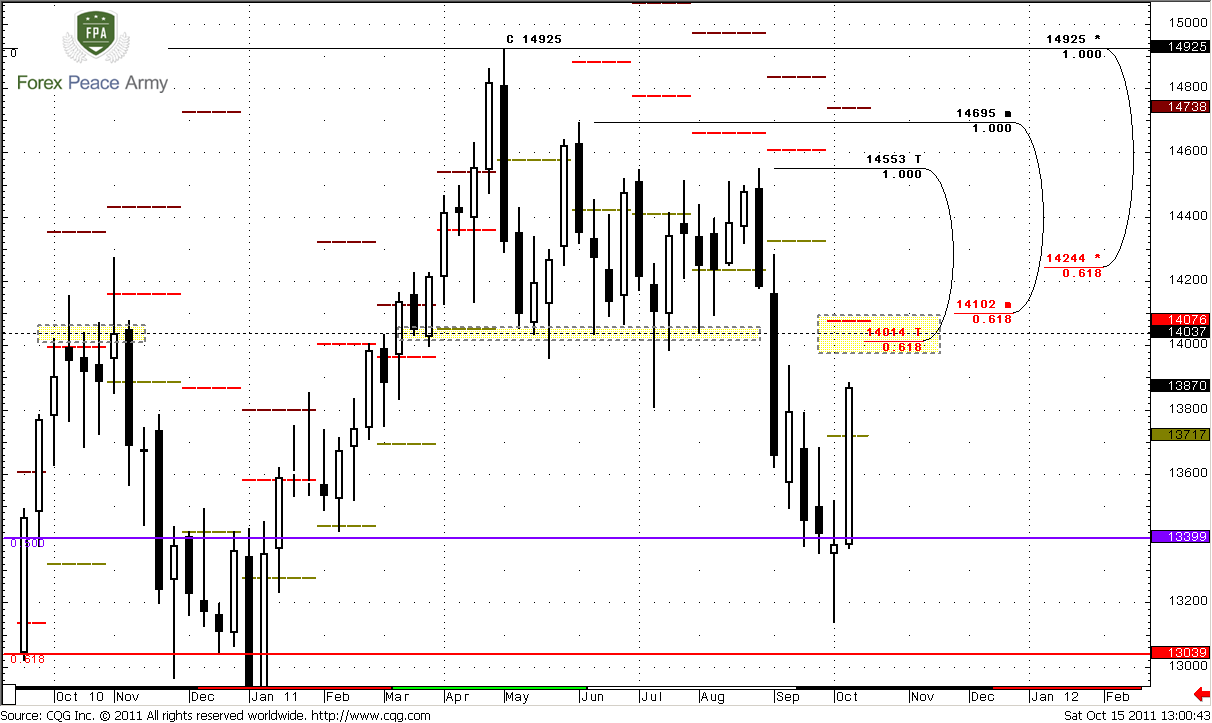
Important point that we’ve not mentioned in monthly analysis is that we need price above 1.4038 at close of October, but not just permanent penetration of it. We will not get any advantage if market will reach even 1.45 but close month below 1.4038. On the weekly time frame we see that this will be the real fortress to break.
Weekly trend is bearish, market neither at oversold nor at overbought, so it has no barriers except resistance levels. But these levels are impressive for coming week. Look at 1.4014-1.4080 area – this is classical and strong resistance level, Fib resistance at 1.4014, 1.4076 is monthly pivot resistance and 1.4102 – slightly above it minor Fib resistance. So, market will really struggle to pass through it.
Here is worthy to mention one of the possible scenarios that could happen. Market could reach that level since it has no barriers between current price and 1.40-1.41 area, but since this level is quite strong, probably market will not break it at first touch. So, we can see reaching of this level and some retracement from it on coming week and breakout could come on last week of October (if it will come at all, of cause).
Daily
Currently this time frame gives a lot of trading possibilities, and there are a lot of different patterns could appear on coming week, but let’s start from markings since this chart a bit overload with details.
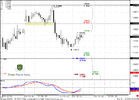
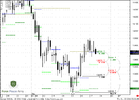
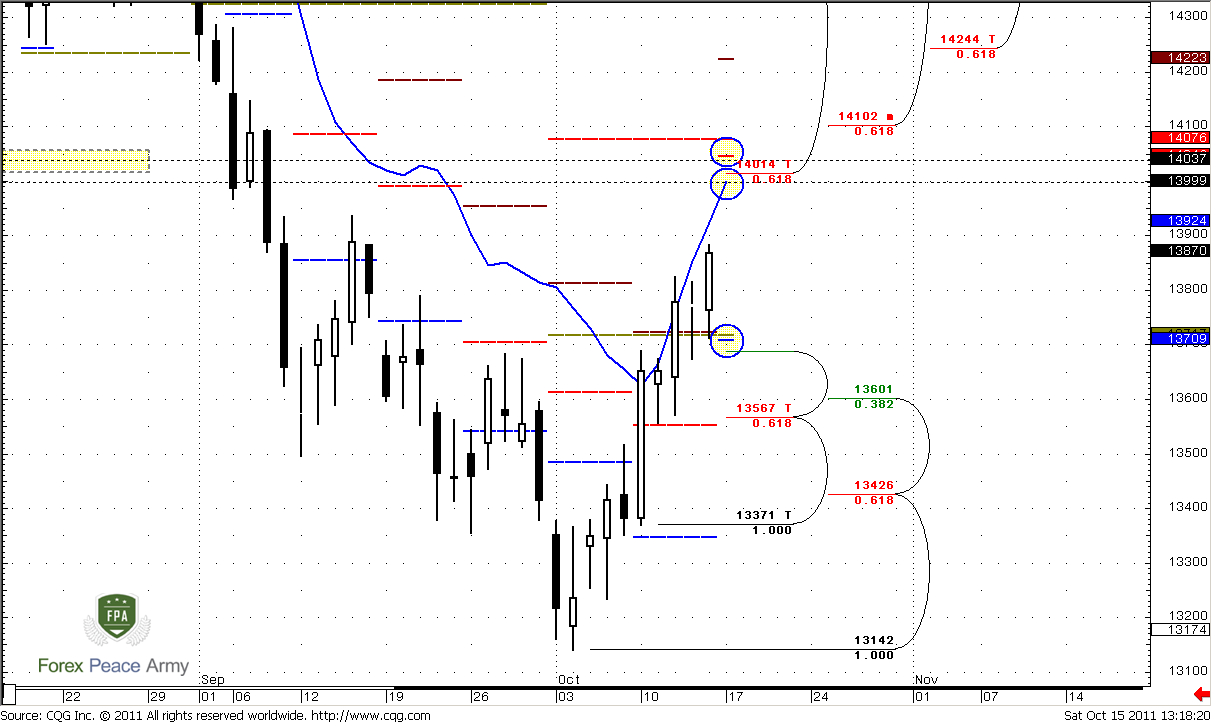
There are the same levels of resistance as on weekly chart – 1.4014, 14102 and 14244. Long red dash line is monthly pivot resistance 1 at 1.4076, small red dash line is weekly pivot resistance 1, that adds more resistance to above mentioned area – at 1.4046. Just below this area is level of overbought for Monday in blue circle – 1.40. Do you feel how pressure grows in this area, right? 1.4037 is a monthly trend breakeven point.
Now to the downside - small blue dash line at 1.3709 is weekly pivot that almost coincides with nearest Fib support 1.3689. Just below daily K-support stands at 1.3567-1.3601. I suppose that we will hardly need other support levels in near-term, at least on Monday.
Since market has some room to overbought and strong resistance level, we might expect two different scenarios – reaching of this level first and retracement second, or reaching pivot at 1.3710 and move to 1.40-1.41 resistance and then deeper retracement. Whatever scenario will happen, our trading plan is searching for sell signals around 1.40-1.41 and searching for buy signals around 1.37 or around K-area if market will reach it. By the way, if you add on chart 3x3 DMA, you will see, that current thrust has minimum required bars to classify it as thrust and could be a context for B&B or DRPO trade.
Based on daily time frame, it’s very difficult to say, how it will turn. All that we can do here is to discuss how to act, depending on future price action. If market will break to the downside 1.3550-1.36 daily K-support, then bullish bias will be under question. Also, if it will be B&B “Buy”, then it will probably start from K-support, rather than just from 1.37 area.
4-hour&hourly
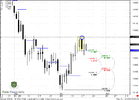
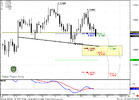
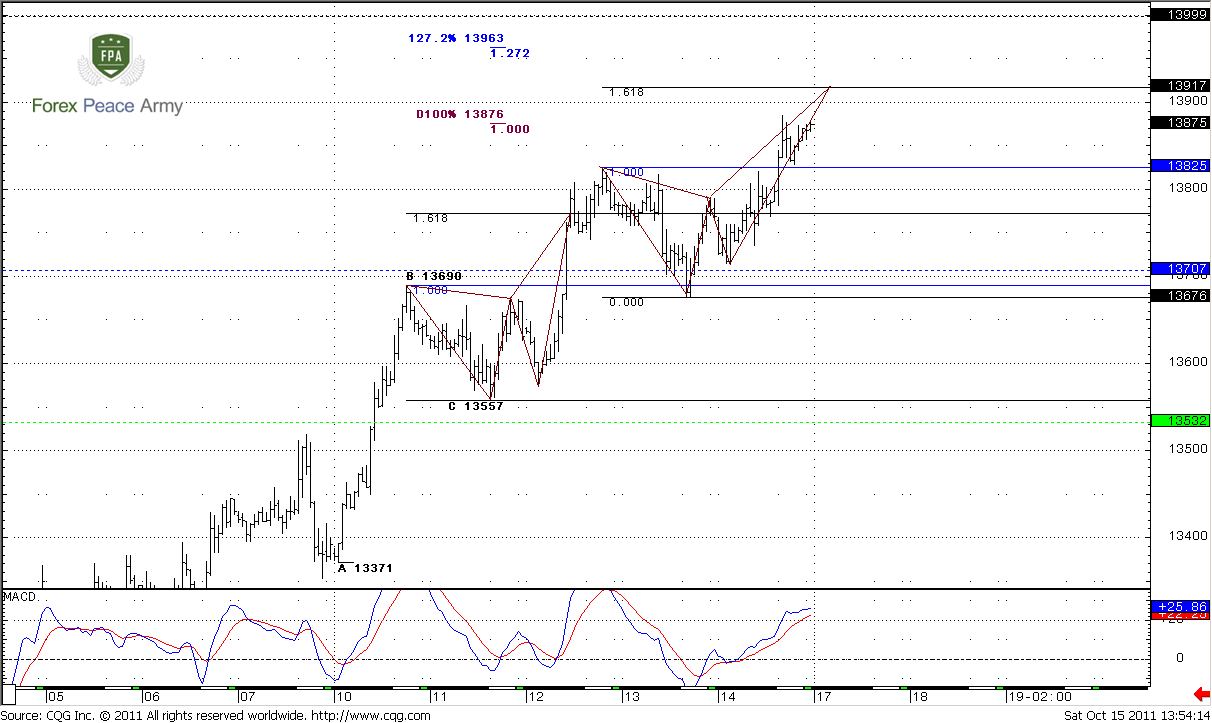
On these charts could be some clue to understanding of price action in nearest term. We see that 1.40-1.41 area just teems with different targets, levels and extensions. Which one we have to choose? How we may trigger our trade or make a decision. The common approach to solve that problem is to find some clear pattern. Based on current price action I still think, that market will continue move slightly higher at open. We see that it has reached 1.0 Extension at 1.3876, but shown just shallow pullback, why? I suspect that this is due butterfly “Sell” pattern, which 1.618 target stands somewhere near 1.272 extension of AB-CD at 1.3963. But I’m not done. Let’s shift to hourly chart to discuss another pattern that could help us…
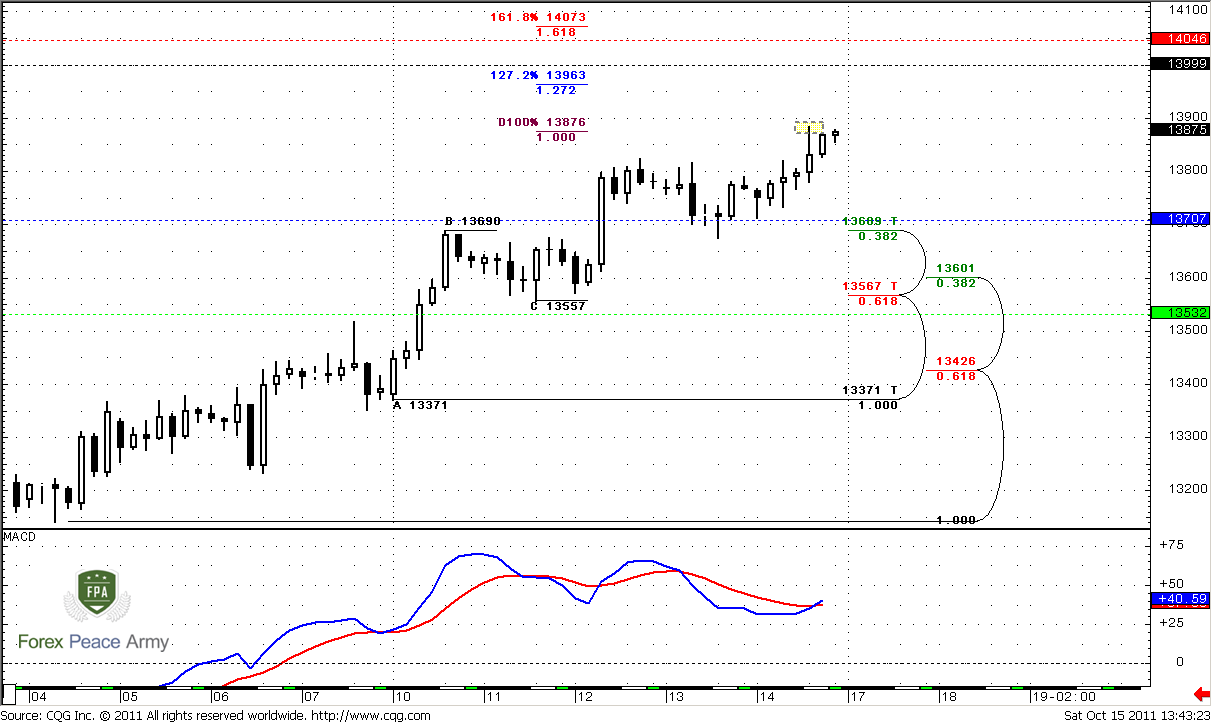
Hourly trend is bullish, here you can see both butterflies, that we’ve discussed during the week. Also you can see that first butterfly, was a bit extended beyond 1.618 extension before it has started to work properly. The same could happen with the second one – 1.618 target stands at 1.3917, while 1.27 AB-CD extension at 1.3963. So, market can reach that level before any signs of retracement will appear. But I would like to show you not that butterflies, but 1.618 3-Drive “Sell” pattern that is forming on 4-hour chart, especially if we will take into consideration 4-hour MACD action – double divergence. I guess you can find it by yourself now. That’s an excellent educational example by the way, of harmonic patterns compounding. In our FPA School you will find whole part dedicated to this topic (but probably it will be released a bit later).
Still will it work or not – I will not dare to suggest, but no doubt we have to keep an eye on it.
Hourly
Conclusion:
On long-term chart market could show a “Reversal and trap of the year” if October will close above 1.4038 level.
Still, on lower time frame, very probable some continuation to upside before retracement will start. There is some probability exists that market will show retracement to weekly pivot point prior of reaching significant resistance at 1.40-1.41 due to 3-Drive “Sell” pattern that is forming on 4-hour chart.
The technical portion of Sive's analysis owes a great deal to Joe DiNapoli's methods, and uses a number of Joe's proprietary indicators. Please note that Sive's analysis is his own view of the market and is not endorsed by Joe DiNapoli or any related companies.
As you remember we’ve spoken about possible retracement during whole previous month. It should be more logical if it had happened two weeks ago, but market rarely does absolutely logical steps, so, we’ve seen this pullback only during past week. Anyway, this pullback has started. But is it absolutely correct to treat is as pullback on monthly chart? May be we have to treat as pullback previous down move? Really, if we will take a look at the chart we will see two things – first is confirmed bullish trend, second is deep 50% retracement, but still this is just a retracement from previous upswing. We treat current move up as pullback just because it’s smaller than previous move down, but actually this is not a big deal, how to call it. The most important, what we have to keep an eye on monthly chart. And I suppose that it will be price action versus MACD.
Today’s discussion of monthly chart will be dedicated mostly to trend. The red line on the chart is DiNapoli MACD Predictor. It acts as simple MACD, but uses price chart instead of second line. When price stands above red line – simple MACD shows uptrend, when it stands below – downtrend. But despite this common using of MACDP, this indicator has a lot of additional tools and one of them – prediction of precise price, where trend will change and simple MACD will show line crossing. It is happening so, that this tool will need as in near-term. Look at level in blue circle – this is trend breakeven point for October – 1.4037, and it stands below our target on daily time frame and just 200 pips away from current market. How do you think, is it too far in terms of monthly chart? Surely not. I think you are starting to catch my idea, right? If market will close above that level in October – we will get huge bullish stop grabber and perfect context for enter long with target at least around 1.50. Context will be perfect, since we will need just October range and retracement to possess ourselves in big move on monthly chart. This will give us outstanding risk/reward ratio.
But let’s suppose that you do not trade on monthly charts. Fine. But still you will know the overall direction – to 1.50. This will allow you to enter long on lower time frames without scare to catch deep pullback or drawdown. Other words you will know the direction and target of the market for 1-3 months ahead. Isn’t it cool?
You might say, that this is just a theory, and assumption, may be this will not happen – and you are 100% right. But that is a work of analyst – to look at picture in perspective. What’s the use from just poor description of past price action? Besides, monthly chart is rather long-term, and it’s just impossible to find something new on weekly basis here. Anyway, if this scenario will not happen, we will start to search another one, but currently I can’t find the reasons why this perspective could be unreal. It’s worthy to track monthly chart from that point of view.
Simultaneously we have to keep mind open for opposite price action, if bears are really strong – we should not be too surprised if market will break all supports and accelerates down further. Nearest target on monthly chart stands at 1.2905 from large AB-CD pattern – near major 0.618 Fib support 1.3039, so we might say that this is also a monthly Agreement. Current price action looks like Gartley “222” from AB swing on chart, so we can’t exclude that also.
Weekly
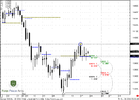
Important point that we’ve not mentioned in monthly analysis is that we need price above 1.4038 at close of October, but not just permanent penetration of it. We will not get any advantage if market will reach even 1.45 but close month below 1.4038. On the weekly time frame we see that this will be the real fortress to break.
Weekly trend is bearish, market neither at oversold nor at overbought, so it has no barriers except resistance levels. But these levels are impressive for coming week. Look at 1.4014-1.4080 area – this is classical and strong resistance level, Fib resistance at 1.4014, 1.4076 is monthly pivot resistance and 1.4102 – slightly above it minor Fib resistance. So, market will really struggle to pass through it.
Here is worthy to mention one of the possible scenarios that could happen. Market could reach that level since it has no barriers between current price and 1.40-1.41 area, but since this level is quite strong, probably market will not break it at first touch. So, we can see reaching of this level and some retracement from it on coming week and breakout could come on last week of October (if it will come at all, of cause).
Daily
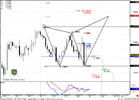
Currently this time frame gives a lot of trading possibilities, and there are a lot of different patterns could appear on coming week, but let’s start from markings since this chart a bit overload with details.
There are the same levels of resistance as on weekly chart – 1.4014, 14102 and 14244. Long red dash line is monthly pivot resistance 1 at 1.4076, small red dash line is weekly pivot resistance 1, that adds more resistance to above mentioned area – at 1.4046. Just below this area is level of overbought for Monday in blue circle – 1.40. Do you feel how pressure grows in this area, right? 1.4037 is a monthly trend breakeven point.
Now to the downside - small blue dash line at 1.3709 is weekly pivot that almost coincides with nearest Fib support 1.3689. Just below daily K-support stands at 1.3567-1.3601. I suppose that we will hardly need other support levels in near-term, at least on Monday.
Since market has some room to overbought and strong resistance level, we might expect two different scenarios – reaching of this level first and retracement second, or reaching pivot at 1.3710 and move to 1.40-1.41 resistance and then deeper retracement. Whatever scenario will happen, our trading plan is searching for sell signals around 1.40-1.41 and searching for buy signals around 1.37 or around K-area if market will reach it. By the way, if you add on chart 3x3 DMA, you will see, that current thrust has minimum required bars to classify it as thrust and could be a context for B&B or DRPO trade.
Based on daily time frame, it’s very difficult to say, how it will turn. All that we can do here is to discuss how to act, depending on future price action. If market will break to the downside 1.3550-1.36 daily K-support, then bullish bias will be under question. Also, if it will be B&B “Buy”, then it will probably start from K-support, rather than just from 1.37 area.
4-hour&hourly
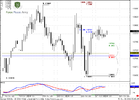
On these charts could be some clue to understanding of price action in nearest term. We see that 1.40-1.41 area just teems with different targets, levels and extensions. Which one we have to choose? How we may trigger our trade or make a decision. The common approach to solve that problem is to find some clear pattern. Based on current price action I still think, that market will continue move slightly higher at open. We see that it has reached 1.0 Extension at 1.3876, but shown just shallow pullback, why? I suspect that this is due butterfly “Sell” pattern, which 1.618 target stands somewhere near 1.272 extension of AB-CD at 1.3963. But I’m not done. Let’s shift to hourly chart to discuss another pattern that could help us…
Hourly trend is bullish, here you can see both butterflies, that we’ve discussed during the week. Also you can see that first butterfly, was a bit extended beyond 1.618 extension before it has started to work properly. The same could happen with the second one – 1.618 target stands at 1.3917, while 1.27 AB-CD extension at 1.3963. So, market can reach that level before any signs of retracement will appear. But I would like to show you not that butterflies, but 1.618 3-Drive “Sell” pattern that is forming on 4-hour chart, especially if we will take into consideration 4-hour MACD action – double divergence. I guess you can find it by yourself now. That’s an excellent educational example by the way, of harmonic patterns compounding. In our FPA School you will find whole part dedicated to this topic (but probably it will be released a bit later).
Still will it work or not – I will not dare to suggest, but no doubt we have to keep an eye on it.
Hourly
Conclusion:
On long-term chart market could show a “Reversal and trap of the year” if October will close above 1.4038 level.
Still, on lower time frame, very probable some continuation to upside before retracement will start. There is some probability exists that market will show retracement to weekly pivot point prior of reaching significant resistance at 1.40-1.41 due to 3-Drive “Sell” pattern that is forming on 4-hour chart.
The technical portion of Sive's analysis owes a great deal to Joe DiNapoli's methods, and uses a number of Joe's proprietary indicators. Please note that Sive's analysis is his own view of the market and is not endorsed by Joe DiNapoli or any related companies.
")