Sive Morten
Special Consultant to the FPA
- Messages
- 18,621
Monthly
Although market has shown some deeper invasion inside of monthly Confluence resistance overall picture has not changed much since previous week. Probably in today’s research we again will be focused on lower time frame analysis.
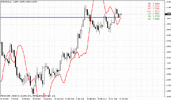
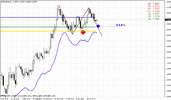
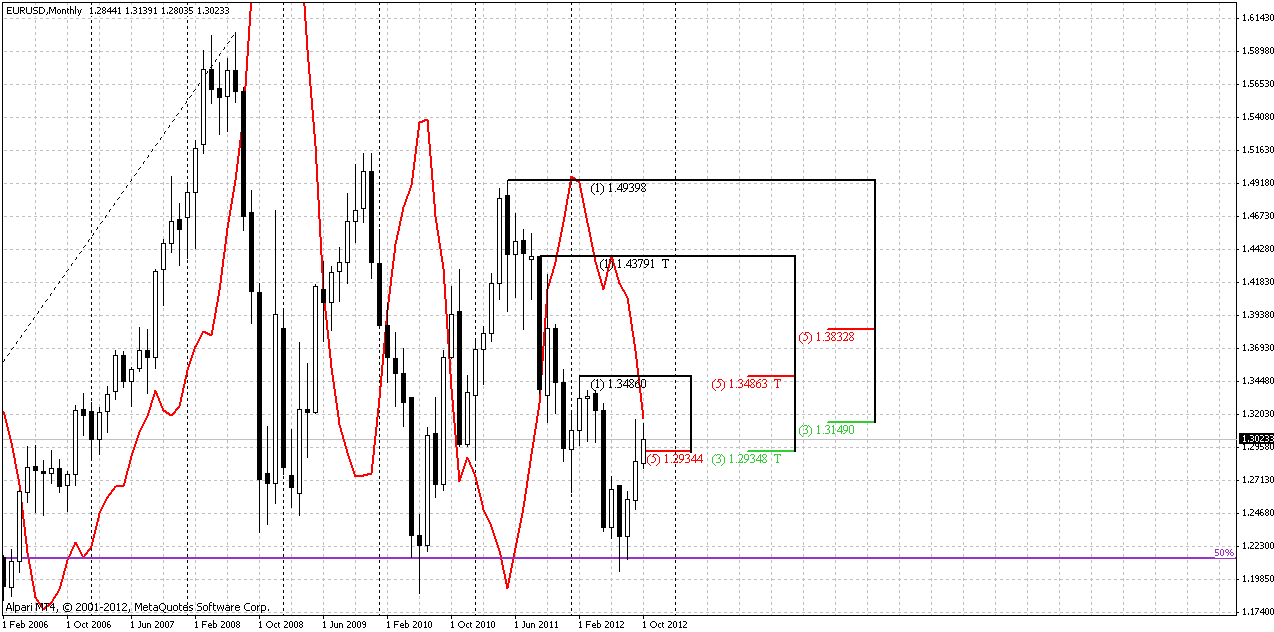
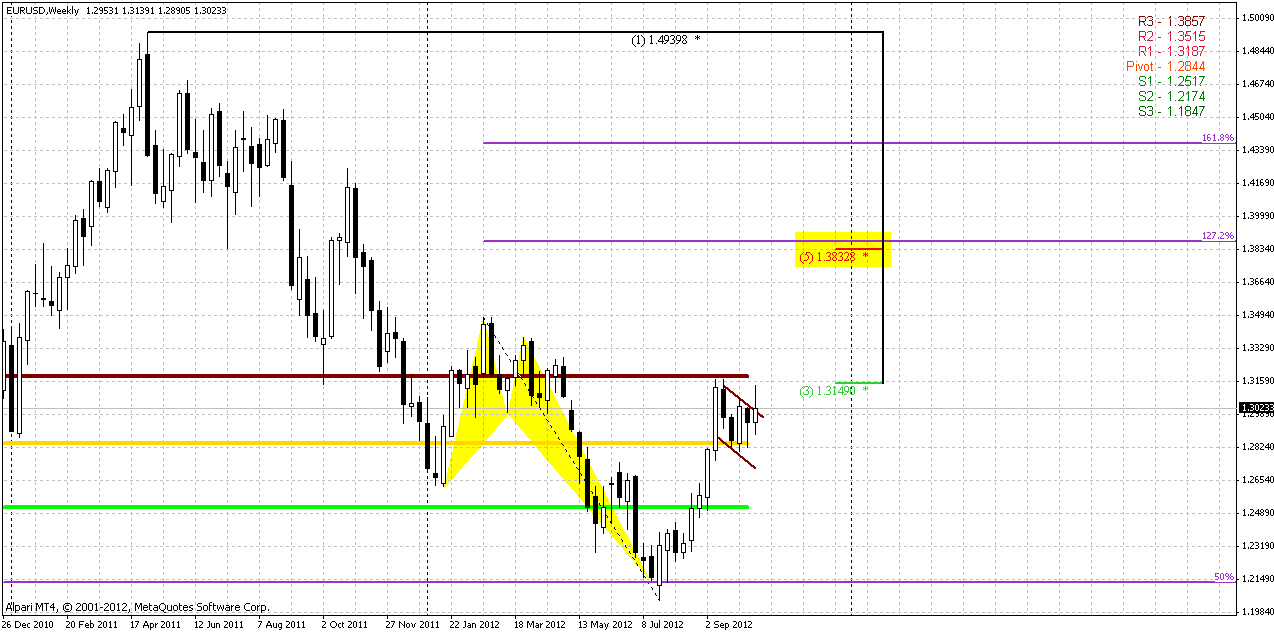
On monthly chart trend holds bearish. After first pullback from K-resistance area, price again has entered inside this range. After two weeks passed October is still an inside month for September bar. All that we can see here is that market stands at long-term strong resistance.
Weekly
If you let me, I hold some text from previous research for some time, since this looks important for me. If you remember this discussion – you can skip reading this and move right to current weeks ovbservation:
“Speaking about weekly chart, it makes sense to re-read previous comments. All our suggestions are based on thought that currently we have first bullish swing up. This is very important for medium term perspective. Take a look – if we will treat as last swing down just small swing down from 1.2750, then our assumption is correct. But what if we have to treat as recent swing down whole butterfly move? This suspicion has come to me, because it was too small retracement on a way down before 1.2750 top. In this case we do not have bullish reversal swing. Hence we will not get deep retracement to 1.25. If market indeed is reversing up – it should show upward reversal swing, but it should be higher than 1.35 – the starting point of butterfly swing down. From the other side, if market will not reverse, we should get downward continuation, since from that swing calculation we just have next lower high in long term bear trend.
Speaking simply, if we were wrong by treating current swing up as reversal, we could get upward continuation and our thought about downward AB=CD on daily will be wrong. If this is not a reversal swing, then donward move will start, but it will not stop around 1.25 and continue futher.”
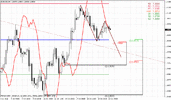
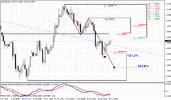
On previous week we’ve discussed perspectives of potential breakout of flag pattern on weekly time frame. In fact, we have nothing except this pattern, so whether we want it or not, all that we can do is just base our analysis on it. Theoretically, flag, as you know is bullish pattern, but mostly it will depend how market will out from it. Looking at price action on previous week makes me worry about its bullishness, since price action reminds bullish trap. If price breaks upward border of the flag (or pennant) it should not return back inside of it. Here price still holds above upper border, but overall price action looks queerly – possible bearish breakout of bullish pattern tells much about potential perspective. Probably I shouldn’t worry much about it if other markets will not show such price action. Take a look:
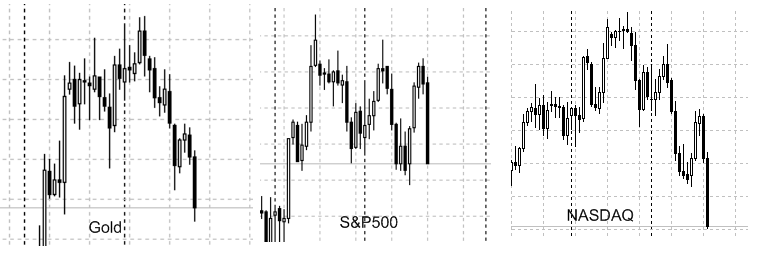
Not usual price action before US election, doesn’t it?
That’s why I probably will not hurry to enter long. As I’ve said in videos, I still think that enter after taking out of previous high will be much safer. At least by this action market will convince me with seriousnes of its intentions.
Althgough, as I’ve said, price formally holds above flag yet (but we will check it additionally on daily chart), I have solid suspicions that we will see downward action on next week.
Daily
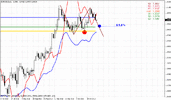
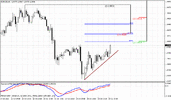
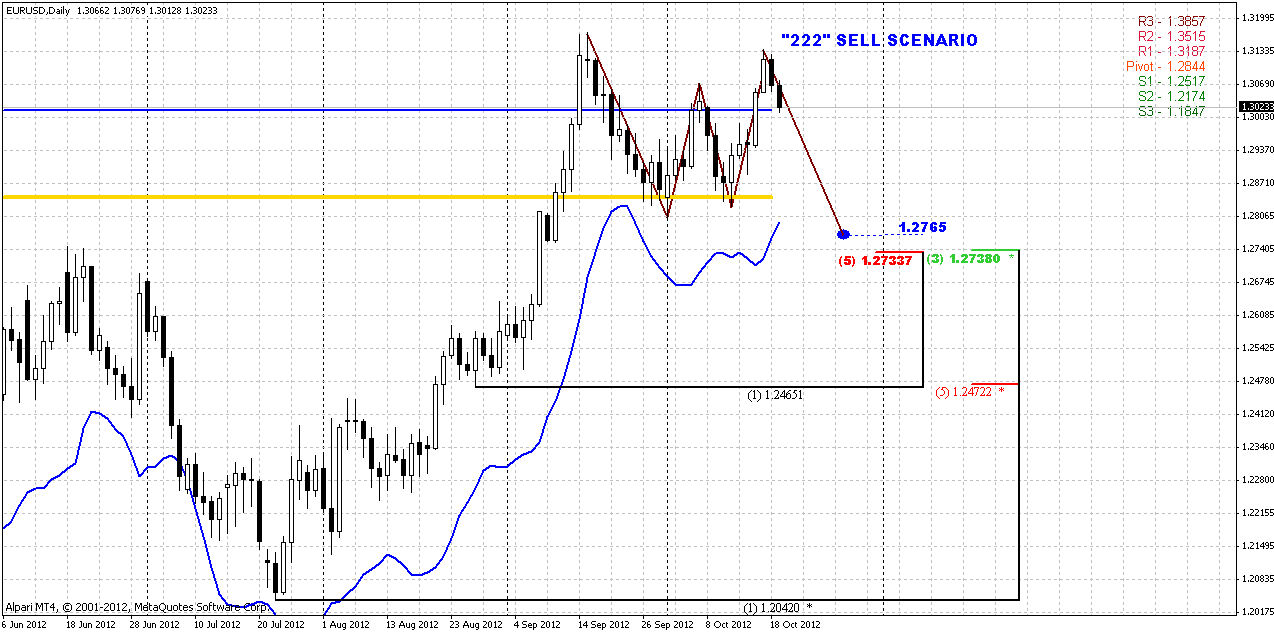
Since on previous week price action was relatively tight, there is nothing that I can add today to previous daily comments. Again we will be focused on two possible scenarios. First one is called “222 Sell”, since it based on cognominal harmonic pattern. It once again returns to life mostly due unimpressive bullish price action. If this scenario will be realized, we should see price around 1.2750 area - daily Confluence support, “222” target and daily oversold. But if it will really happen, it will mean that market will show failure breakout of flag on weekly chart. Thus, I will not be surprised if we will see further move down in medium term.
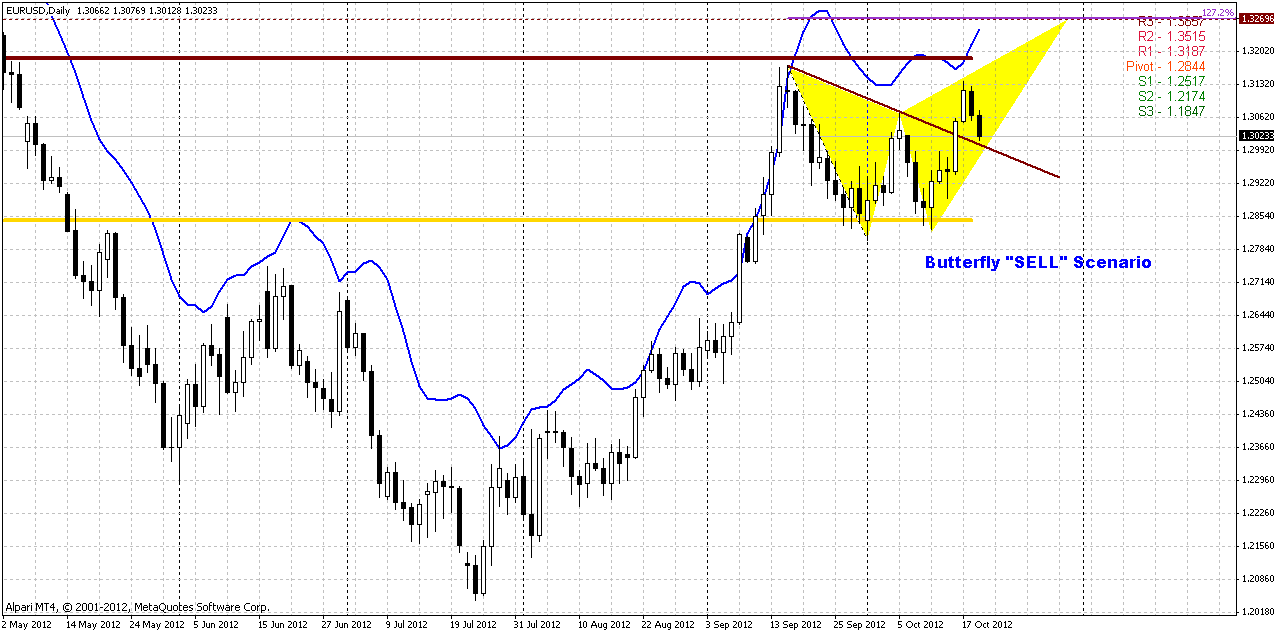
Next scenario is Butterfly “Sell” pattern. We might see that price still holds above upper border of the flag/pennant, so this move down might be just retesting of it as support and move up could continue. In this case, we can get reaching of 1.3270 area or even higher to 1.618 target. But as you can see there are two solid barriers ahead – MPR1 at 1.3187 and daily overbought. Unfortunately daily chart does not give us a clue what scenario will prevail. So, let’s try to find it out on intraday charts, or, at least, create some reasonable trading plan.
4-hour
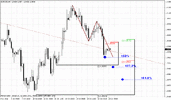
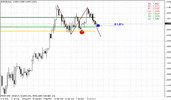
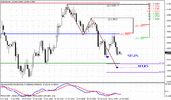
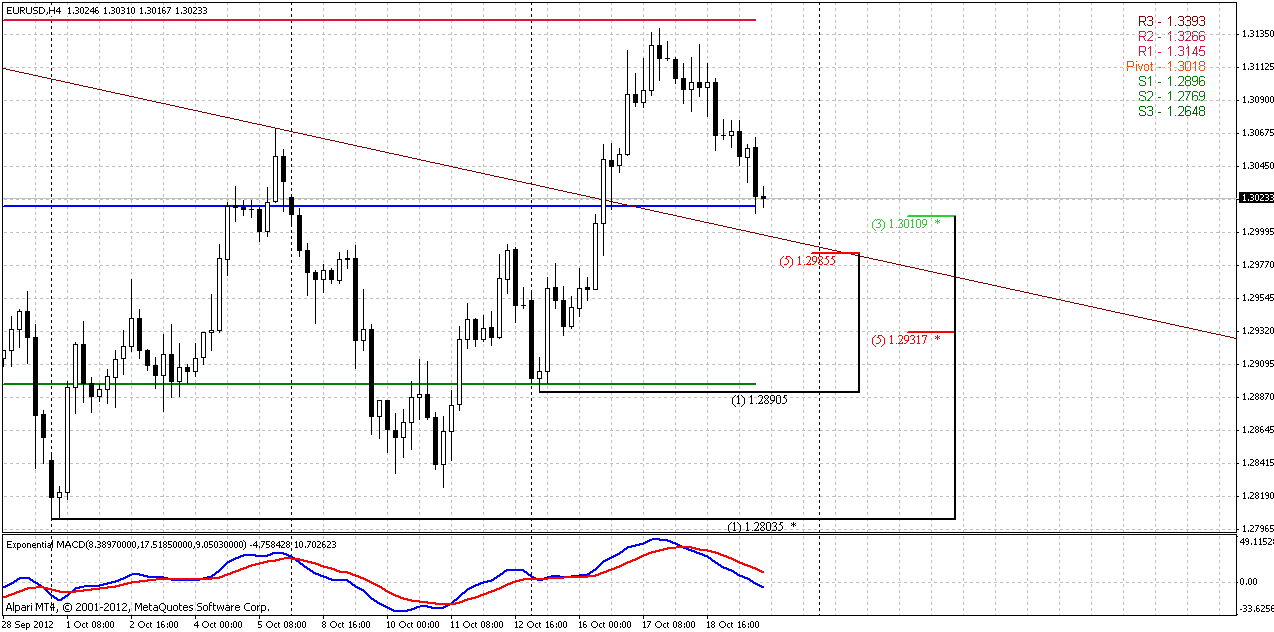
Take a look where we are stand. If you remember we where focused on retracement to 1.3020 area within couple of previous trading sessions. This suggestion was based on resistance and Agreement of 0.88 resistance and AB=CD upward pattern. So, this move has happen. Current level is great assistance for us, because this is new WPP=1.3018, 4-hour Confluence support and border of the flag. If market still have bullish ambitions, price should hold above this area, because retracement to major 3/8 support after hitting of AB=CD target looks quite enough move. What we will get, if market will not hold here? Moving below WPP will shift sentiment on bearish side, falling of the price below flag border will tell us, that that is probably failure upward breakout and, finally, breakout of 4-hour Confluence support will confirm shor-term bearish strength. So, keep eyes open on this area. It is a key level for whole coming week, I suppose. And don’t be decieved by possible upward bounce on first touch of this area, market could show small retracement. To speak about upward continuation we need see acceleration, some upward thrusting motion.
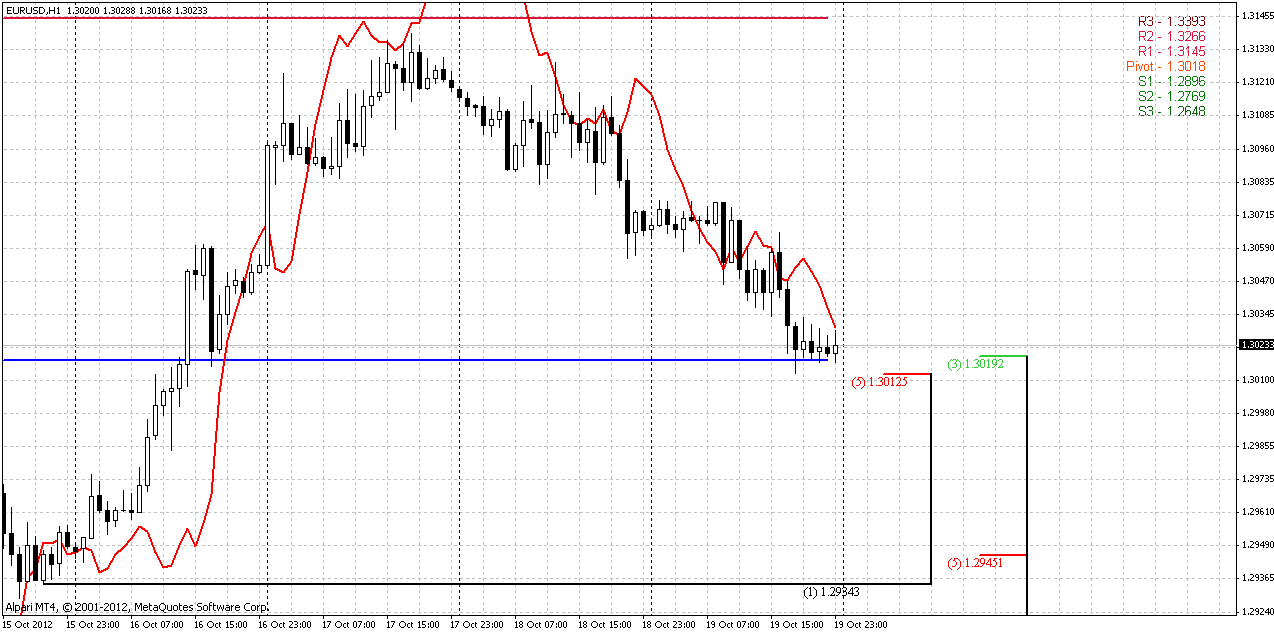
1-hour
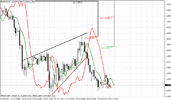
Here we do not have much add-on. Hourly chart shows particularly the level with which we had a deal on previous week – hourly Confluence support from most recent swing up. Take a look that trend holds bearish here.
Conclusion:
Coming week will clarify whether it will be true flag breakout or not. That will define direction in medium-term perspective.
In short-term we should keep an eye on 1.30 area. Since this is a congestion of significant levels – how market will behave around it and what direction it will choose will be determining moment.
The technical portion of Sive's analysis owes a great deal to Joe DiNapoli's methods, and uses a number of Joe's proprietary indicators. Please note that Sive's analysis is his own view of the market and is not endorsed by Joe DiNapoli or any related companies.
Although market has shown some deeper invasion inside of monthly Confluence resistance overall picture has not changed much since previous week. Probably in today’s research we again will be focused on lower time frame analysis.
On monthly chart trend holds bearish. After first pullback from K-resistance area, price again has entered inside this range. After two weeks passed October is still an inside month for September bar. All that we can see here is that market stands at long-term strong resistance.
Weekly
If you let me, I hold some text from previous research for some time, since this looks important for me. If you remember this discussion – you can skip reading this and move right to current weeks ovbservation:
“Speaking about weekly chart, it makes sense to re-read previous comments. All our suggestions are based on thought that currently we have first bullish swing up. This is very important for medium term perspective. Take a look – if we will treat as last swing down just small swing down from 1.2750, then our assumption is correct. But what if we have to treat as recent swing down whole butterfly move? This suspicion has come to me, because it was too small retracement on a way down before 1.2750 top. In this case we do not have bullish reversal swing. Hence we will not get deep retracement to 1.25. If market indeed is reversing up – it should show upward reversal swing, but it should be higher than 1.35 – the starting point of butterfly swing down. From the other side, if market will not reverse, we should get downward continuation, since from that swing calculation we just have next lower high in long term bear trend.
Speaking simply, if we were wrong by treating current swing up as reversal, we could get upward continuation and our thought about downward AB=CD on daily will be wrong. If this is not a reversal swing, then donward move will start, but it will not stop around 1.25 and continue futher.”
On previous week we’ve discussed perspectives of potential breakout of flag pattern on weekly time frame. In fact, we have nothing except this pattern, so whether we want it or not, all that we can do is just base our analysis on it. Theoretically, flag, as you know is bullish pattern, but mostly it will depend how market will out from it. Looking at price action on previous week makes me worry about its bullishness, since price action reminds bullish trap. If price breaks upward border of the flag (or pennant) it should not return back inside of it. Here price still holds above upper border, but overall price action looks queerly – possible bearish breakout of bullish pattern tells much about potential perspective. Probably I shouldn’t worry much about it if other markets will not show such price action. Take a look:
Not usual price action before US election, doesn’t it?
That’s why I probably will not hurry to enter long. As I’ve said in videos, I still think that enter after taking out of previous high will be much safer. At least by this action market will convince me with seriousnes of its intentions.
Althgough, as I’ve said, price formally holds above flag yet (but we will check it additionally on daily chart), I have solid suspicions that we will see downward action on next week.
Daily
Since on previous week price action was relatively tight, there is nothing that I can add today to previous daily comments. Again we will be focused on two possible scenarios. First one is called “222 Sell”, since it based on cognominal harmonic pattern. It once again returns to life mostly due unimpressive bullish price action. If this scenario will be realized, we should see price around 1.2750 area - daily Confluence support, “222” target and daily oversold. But if it will really happen, it will mean that market will show failure breakout of flag on weekly chart. Thus, I will not be surprised if we will see further move down in medium term.
Next scenario is Butterfly “Sell” pattern. We might see that price still holds above upper border of the flag/pennant, so this move down might be just retesting of it as support and move up could continue. In this case, we can get reaching of 1.3270 area or even higher to 1.618 target. But as you can see there are two solid barriers ahead – MPR1 at 1.3187 and daily overbought. Unfortunately daily chart does not give us a clue what scenario will prevail. So, let’s try to find it out on intraday charts, or, at least, create some reasonable trading plan.
4-hour
Take a look where we are stand. If you remember we where focused on retracement to 1.3020 area within couple of previous trading sessions. This suggestion was based on resistance and Agreement of 0.88 resistance and AB=CD upward pattern. So, this move has happen. Current level is great assistance for us, because this is new WPP=1.3018, 4-hour Confluence support and border of the flag. If market still have bullish ambitions, price should hold above this area, because retracement to major 3/8 support after hitting of AB=CD target looks quite enough move. What we will get, if market will not hold here? Moving below WPP will shift sentiment on bearish side, falling of the price below flag border will tell us, that that is probably failure upward breakout and, finally, breakout of 4-hour Confluence support will confirm shor-term bearish strength. So, keep eyes open on this area. It is a key level for whole coming week, I suppose. And don’t be decieved by possible upward bounce on first touch of this area, market could show small retracement. To speak about upward continuation we need see acceleration, some upward thrusting motion.
1-hour
Here we do not have much add-on. Hourly chart shows particularly the level with which we had a deal on previous week – hourly Confluence support from most recent swing up. Take a look that trend holds bearish here.
Conclusion:
Coming week will clarify whether it will be true flag breakout or not. That will define direction in medium-term perspective.
In short-term we should keep an eye on 1.30 area. Since this is a congestion of significant levels – how market will behave around it and what direction it will choose will be determining moment.
The technical portion of Sive's analysis owes a great deal to Joe DiNapoli's methods, and uses a number of Joe's proprietary indicators. Please note that Sive's analysis is his own view of the market and is not endorsed by Joe DiNapoli or any related companies.