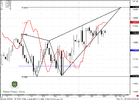
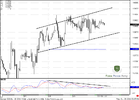
FOREX PRO Weekly October 24-28, 2011

3x3 Displayed moving average (DMA) is used for thrust identification mainly.

re thrust identification, i honestly don't understand why we need a MA because doesn't candle size and relative positions within the BBs already provide that information, don't they?


It is for example the only one I use on daily time frame. 7x5 and 25x5 are good for long trem delineation. Weekly and Montlhy time frames suit better with these ones. the MA's are very popular

again, the problem i have with MAs is that they just show what you can already see by just looking at the price action relative to a trend line or channel lines. and when displaying the price as a line instead of candles, the trend becomes even more visible if there is a trend.

i don't see that MAs add that much value to the info already present. the only thing i would concede is valuable on longer time frames are MA crossovers when multiple MAs are displayed. for ex., the 10, 20, 50, 100 MAs crossing over each other at the beginning of a trend. well, i shouldn't say 'at the beginning' because by the time they cross, the trend usually is already under way. MAs lag. most TIs lag as we know. but even so, i never consider MAs in my decision process. i mean, MA overlays on the price chart. but of course i can't help but rely on MAs inderectly since the mid-BB is a MA, MACD is just MA relationships too and so on.

what we need is some neural net to do some AI analysis of the price action. there is a company out there that sells an API package that allows you to use off-the-shelf neural nets, recombine them whichever way you want, train them, code your own, and so on. a little pricey... can't remember exactly but somewhere in the $1,000s. can't remember the company name... but if someone is interested, let me know. i can find out later.


Fib ratios are even crazier in my opinion.

i agree. fib analysis is just awesome. what's awesome is how they highlight the hidden structure in natural patterns. the very structure of reality seems to be based on PHI and the golden ratio, so it doesn't surprise me that financial markets being part of such a PHI-based reality should also demonstrate golden ratio relationships.

but at the end of the day, i believe that it is just all a self-fulfilling profecy. people learn about the ratios or whatever pattern, and they start trading according to the levels identified by that pattern thus reinforcing the meaning of said levels and patterns. what soros calls a self-reflexive process, if memory serves.


Trianthus, have you gone through the FPA military school? you0ve got the best info there...I've printed all and made a book. It's very helpfull.

i am currently working my way through it. will PDF it at some point. absolutely invaluable info. we most definitely owe a big 'thank you' to sive. one of these days, when we are loaded, i hope that we, i.e. FPA members who benefit so much from felix's vision in creating this awesome resource, show our gratitude by throwing a huge bash on a yacht somewhere cool like monte-carlo and have sive and the whole FPA team as guests of honor. now that would be really cool IMHO. :D
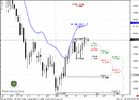
 
Check on the Templates and see if there is a DiNapoli. I was just going through my MT4 and found it. The default MA's are 3 x 3, 7 x 5 and 25 x 5 on the chart i have attached - USDCAD - Daily. You can change them of-course. He has a MACD (8,17,9), Stoch (8,3,3)

I follow Sive's Analysis very closely. I must say the FPA Academy is more practical and real. Thanks Sive for the education.

thanks, i'll take a look.
 
Guys,

Do not too frustrated about your losses cause with this technique and with assisting of Sive analysis, together we can scalp our loss, hopefully. :D

all to the good, but this reminds me that sive might not be around forever. therefore we should not become overly reliant on his analysis. the sooner independent, the better obviously. ;)
 
all to the good, but this reminds me that sive might not be around forever. therefore we should not become overly reliant on his analysis. the sooner independent, the better obviously. ;)

Definitely I agree with you.

By the way, just make some reading on DiNapoli's book (Trading with DiNapoli Levels) and you will find some interesting and useful information. I always wonder before why Sive is comfortable with DiNapoli's indicator because I do not see any special but since I go through the book and dig more deeper about DiNapoli's trading techniques, I realize it worth to learn and practice. Sometimes, the unpopular indicator is actually the most powerful and useful. Just take your time to think why most of the brokers platform (MT4) does not have the real (full pack) DiNapoli's indicator. In fact you must subscribe at a high cost to get full access on DiNapoli pack through a few brokers.;)

Thanks and Best Regards.
 
EUR/USD Daily Update, Wed 26, October 2011

Good morning,
market in fact sands in the range and has shown some kind of inside trading session. This is obvious, that market is awaiting resolving EU questions and tomorrow GDP release.
Our regression model shows that we can count on strong upside surprise in tomorrow GDP release. Consensus forecast currently is 2.2%, but we think that it could be 3%+ number. So, be very careful tomorrow. From the another point of view - we do not trade data releases, and purpose of our model is a bit different, it has not 100% waranty. I just want to warn you that this is possible.

Still there is just one technical issue on 4-hour time frame that I want to discuss. This is bullish dynamic pressure. It tells, that market should reach at least 1.27 extension of butterfly. What will be after that - it's very difficult to predict. It's also difficult to predict how it will happen - by solid move up, or just on some fake out, but there is a solid probability that it will happen.

On hourly chart you can see dynamic pressure clearer.

Since market just coiling around 1.3905, it's very difficult to find something to comment...
 

Attachments

  • EUR_D_26_10_11.PNG
    EUR_D_26_10_11.PNG
    45.4 KB · Views: 135
  • EUR_4H_26_10_11.PNG
    EUR_4H_26_10_11.PNG
    46.7 KB · Views: 138
  • EUR_1H_26_10_11.PNG
    EUR_1H_26_10_11.PNG
    40.9 KB · Views: 138
Redbars(short)

Hey sive.

Thanks again for your time and your expertise that you share with us.

I can se that there is a lot off redbars (short) if i look at eur/usd from yesterday til now. As i see it short is in over numbers. Is this a sign or is it normal?

Kind regards Tony
 
Hey sive.

Thanks again for your time and your expertise that you share with us.

I can se that there is a lot off redbars (short) if i look at eur/usd from yesterday til now. As i see it short is in over numbers. Is this a sign or is it normal?

Kind regards Tony

Hi Tony,
I'm not quite understand what do you mean. Could you please clarify a bit more.
 
Trading futures vs spot

Sive

I don't know anything about futures. Could you briefly explain, and/or redirect me to a resource, about what a trader should keep in mind in terms of strategy when trading futures?

I mean, since the technical analysis part is the same, I assume the market structure must be different and therefore I guess one cannot conceptually approach the futures market the same way as one does the spot market.

Where to start? How to go about it?

Thank you.
 
Back
Top