FOREX PRO Weekly October 29- November 03, 2012

Firstly, congrats Leon* ^^ Glad to see your trading better now. Its taken me 10 years and 1000's of $$ to finally be doing ok*

Secondly, dear Sive or readers, can somebody point me to how I can apply the Weekly and Monthly Pivot Points and K Resistence levels on MT4 platform...?

Thanks Muchly
K2* :cool:
 
Hi Sive,

Tried to enter and congratulate you several times through an old account but after logging in I could never post or leave a comment....

Hi Leon,
I'm really glad that you was able to catch your own trading style. Actually, I suppose that you've done anything by yourself. As you can see, I almost never give direct signals and show you as bullish as bearish view. So, it might be seen at first glance that I have no opinion.
But this is mostly done to trigger your own thought process. My major purpose here is to show some hidden nuances, that could be not seen at surface and to attract your attention to details. Also to impant complex and structurized view on market, so that you can correctly understand link between different time frames.


Firstly, congrats Leon* ^^ Glad to see your trading better now. Its taken me 10 years and 1000's of $$ to finally be doing ok*

Secondly, dear Sive or readers, can somebody point me to how I can apply the Weekly and Monthly Pivot Points and K Resistence levels on MT4 platform...?

Thanks Muchly
K2* :cool:

Hi Kalgan.
For Fib levels you need Michael's Fib tree indicator - you can download it from the corresponding tread in a root of my part of furum.
For pivot - you need pivot points indicator. It is attached somewhere in threads. Try to find it by search tool.
 
Hi Sive,

What is the name of the blue line in your daily chart (Weekly Analysis). And what is the parameter? It is a indicator that build in MT4?
I try to use Momentum, but it appear differently. It show a Indicator Window for Momentum when I apply it.
Thank you very much for the help!

Regards,
CheeLee

Hi CheeLee,
probably you can use DOSC indicator - to read how apply it and download it you can here:
https://www.forexpeacearmy.com/forex-forum/chapter-12/16449-chapter-12-part-vi-detrended-oscillator-momentum-indicator.html
Blue line on weekly chart is a derrivative indicator from DOSC. It shows levels right on the chart, while by using dosc you will have to calculate them by yourself. But core as DOSC as blue line on weekly is the same and they shows the same levels of overbought and oversold, since both are based on the same formula
 
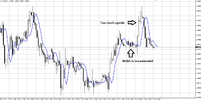
Master Sive, i think i saw a Drpo sell on hourly chat. Is that correct?

Maybe Sive will have a different opinion but for me, the upside was too big and also it took too long for upside to happen. The width should be much closer together.

nodrpo.png
 
Master Sive, i think i saw a Drpo sell on hourly chat. Is that correct?

Maybe Sive will have a different opinion but for me, the upside was too big and also it took too long for upside to happen. The width should be much closer together.

View attachment 7198

Brandon is right, it's not a DRPO. DRPO needs two peaks of approximately the same height and standing very close to each other.
 
Hi Sive

Thanks for your expert analysis.The MACD Predictor that you use on your MT4 charts,is it available to download somewhere.Could not find it on the forum.

Thanks alot
Regards
 
Sive, am I mistaken or am I seeing a near perfect Head & Shoulders formation on the H1 chart for Nov. 1, 2012?

Thanks!
 
Back
Top