mayur sarkar
Recruit
- Messages
- 4
1 no. sir ji
previous week I’ve found some really special on Dollar Index on a long-term chart and decided to watch this stuff to you. From one point of you – this will be chart analysis and hence technical approach, but from another one – this is a quarterly chart that has solid fundamental basis that we also will discuss.
Here is quarterly Dollar Index chart:
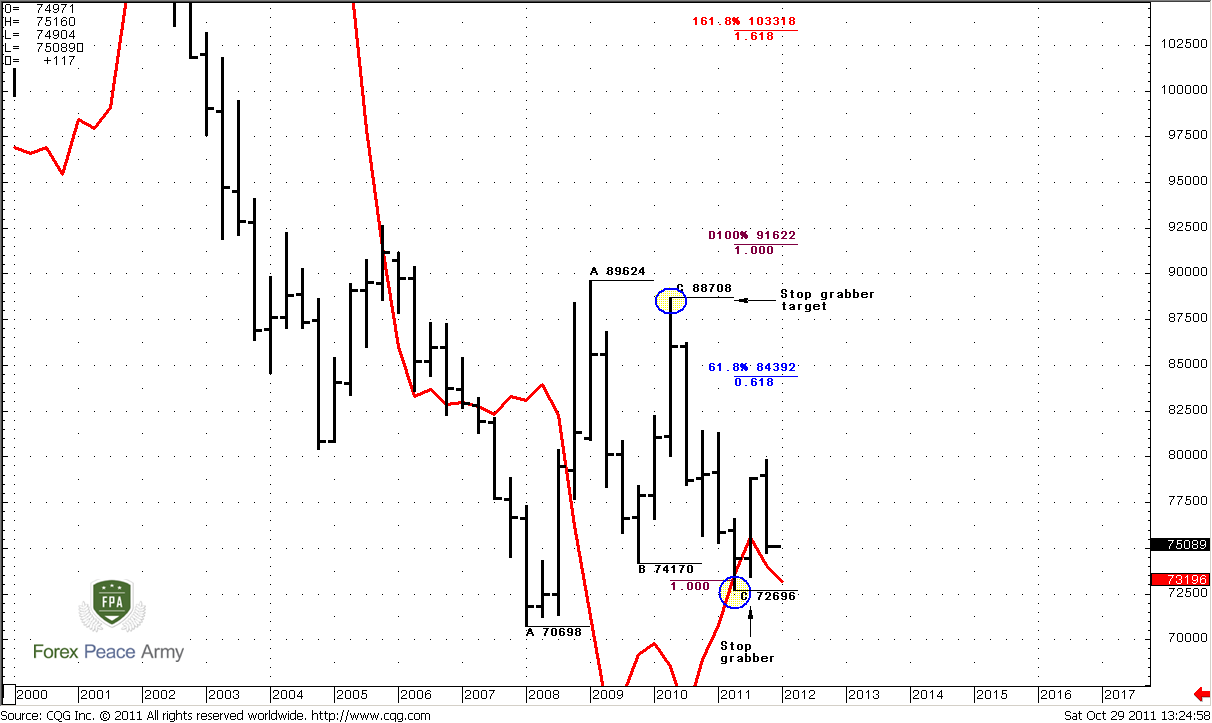
For those who already familiar a bit with DiNapoli approach to markets and Gartley patterns – there is no need any comments. Let me to describe situation for others. Red line on the chart is DiNapoli MACD Predictor. It acts and shows the same signals as simple MACD but uses price chart instead of second line of MACD. Other words, MACDP is a derivative indicator from simple MACD. When price chart stands above red line – trend is bullish by MACD, when it stands below – bearish. But what we see near blue circle around 72.696? This is trend shifting failure and it has happened on quarterly chart. During QI market has tried to shift trend bearish, penetrated red line, but later returned right back and closed above it. The same on QII – market has opened below it but later has shown fast jump out. Now think what has happened with those long-term traders, who have opened shorts by this unconfirmed and as we now see failed signal? Right, they are trapped now in a wrong direction and very nervous since they want to out.
Speaking about technical foundation of this pattern – it has as failure point, when it should be treated as failed and target point. The failure point is a low of this “failure trend shifting”, aka “Stop grabber” pattern – C point at 72.696. The target point is nearest previous highs, where most stops has been placed – 88.708, but since these stops should be taken out – the more probable target is 91.600 area – target of larger AB-CD.
If you like Gartley’s patterns – here is also bullish one. Market has reached AB-CD bearish target right at 73.254 from initial swing up. This is “222” Buy.
You may ask why Dollar Index is so big deal for us. Here is why – let’s add EUR/USD chart:
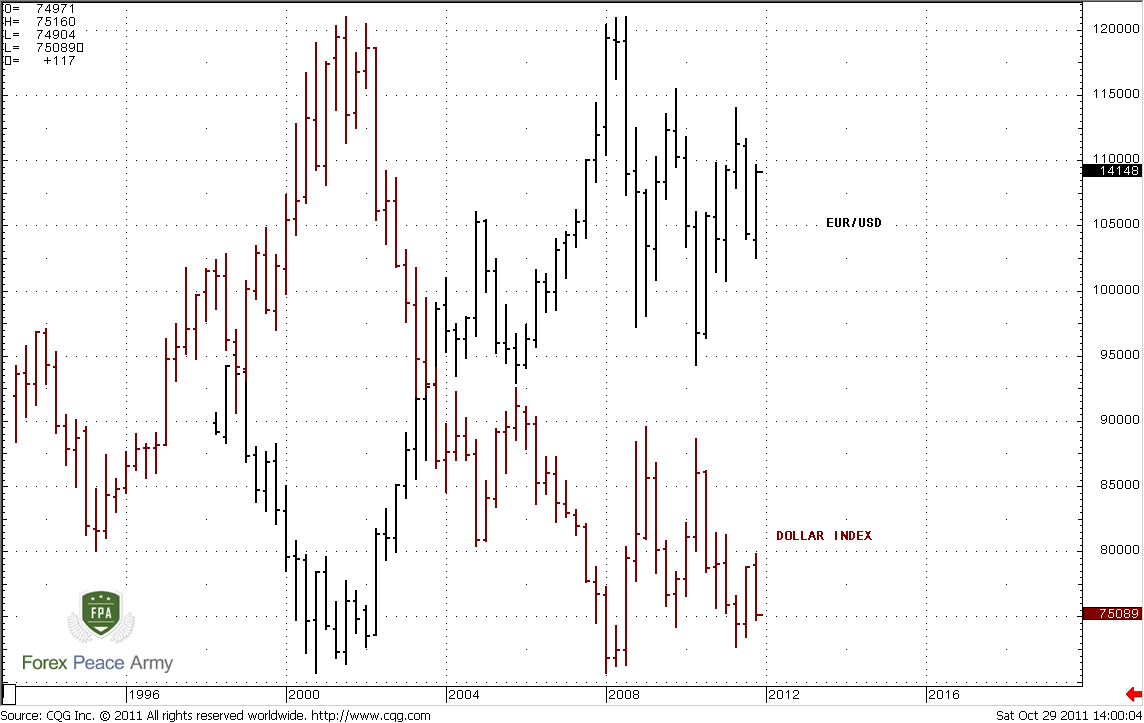
Impressive right? A bit later there will be a chapter in our FPA School dedicated to Dollar Index, so you will know that this index has strong negative correlation with EUR, because EUR has 56% value in the overall index.
Conclusion is obvious. If pattern on Dollar Index will come true – we will see 1.18 on EUR in nearest 1-2 years or may be even faster.
Now is time to add some fundamentals… I suppose most of you have heard about Dollar Smile theory. The major idea is initially Dollar rises due risk aversion (how it has happened in 2008), then market fallen in recession so dollar value declines. When US economy is starting to creep out from recession, investors become hungry for risk and start to search higher return – demand for USD starts to grow. It looks like “smile”.
Let’s take a look from that perspective on Dollar index chart again:
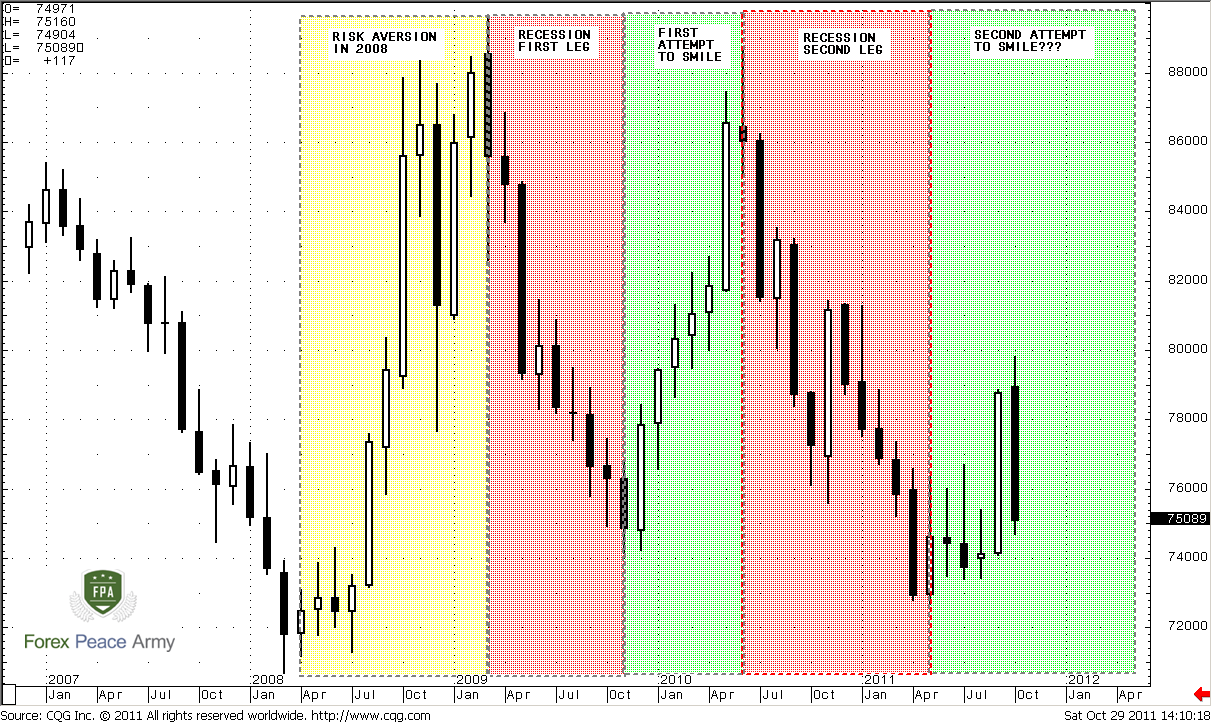
Here we see this theory in action. First jump up in 2008 was a risk aversion (yellow rectangle). Later world economy has fallen in deep recession; rates were decreased all around the world (red rectangle). Then intermediate relief has come, but it has failed, because economy very rare shows V-shape of recovery. In general, this relief was also some kind of dollar smile – just unite first red and green rectangles and look at price action – you clearly can see the smile.
But later economy has turned in second leg of recession and creates a “W” shape that is more stable and quite common, so the real smile is just ready to start. At my humble opinion correct picture should look as follows:
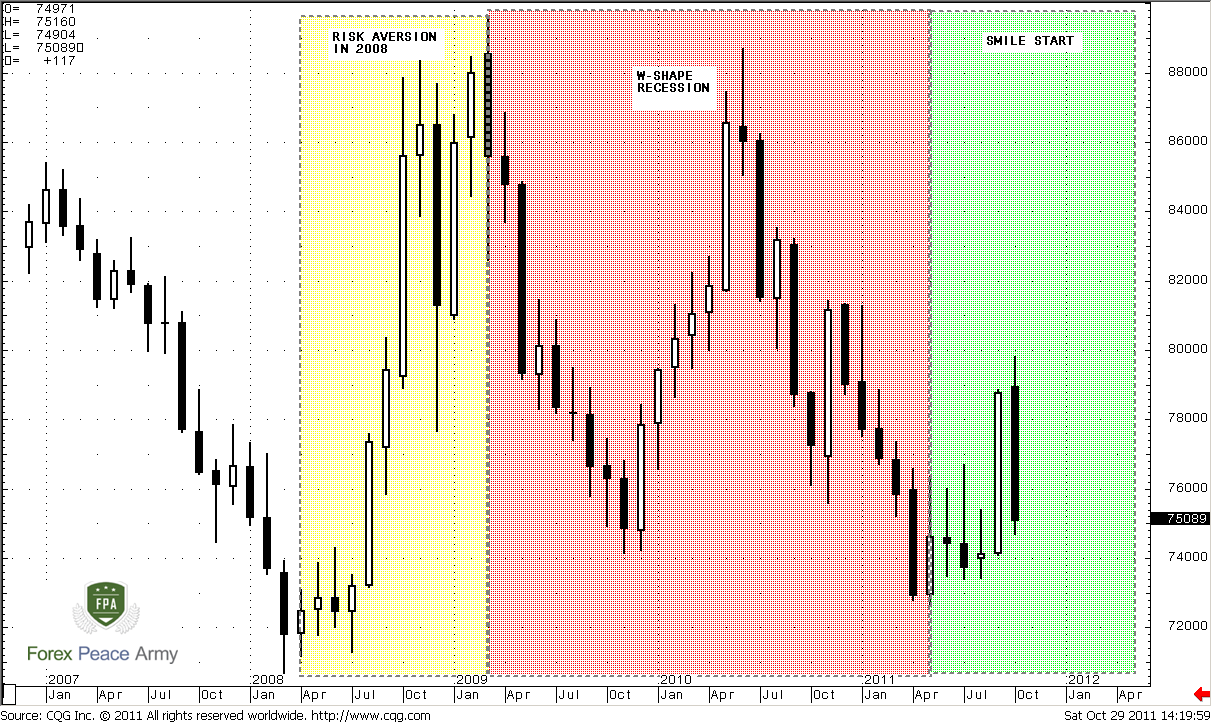
If you make some home work and match this chart with official data on GDP, you’ll see that it supports this price action and theory.
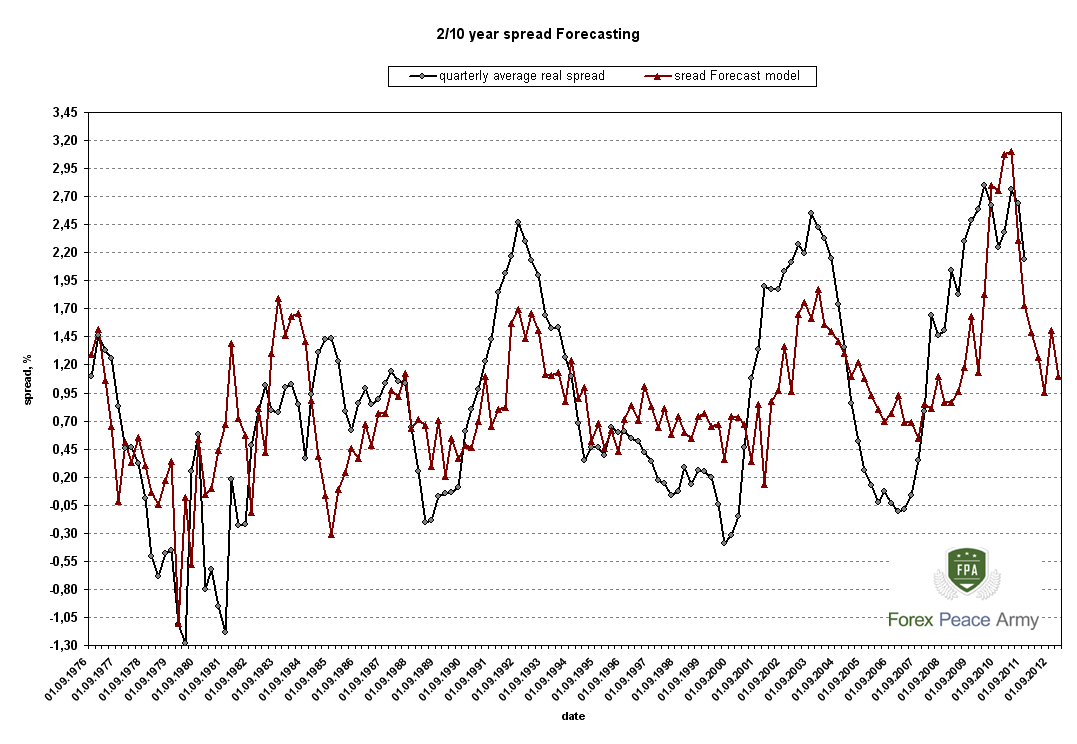
What else could we add? The last thing that I want to show you is our regression model on 2 year-10 year US Treasuries spread. It shows significant decrease in spread in nearest 4 quarters. We already see data improving in economy. Still, current situation in economy is a bit slips out of theoretical. And the reason is growing inflation. Fed has no choice. Although growth does not get enough pace to trigger rate hike, inflation has grown significantly, and Fed will be forced to be hawkish in nearest year. Usually inflation starts to grow after the moment when economy gets significant upward momentum. Growth phase consists of two parts – disinflationary growth and inflationary growth. But due to multiple QE programs there are a lot of liquidity was spring in the markets and inflation is not late in coming. Currently Fed in such situation when it has to rates despite that economy is weak, or, say not strong enough.
Our model is based on NFP and GDP numbers and it shows possible solid reducing in 2-10 year spread. Spread is a difference between 10 year and 2-year rates. In general, it means that 2-year rate should rise significantly and almost become an equal to 10-year rate. That is possible in 2 cases. First is US default, second is rate hiking. First scenario seems as less probable.
Probably we should keep in mind all this stuff and not be surprised when we hear the first bell of this and see some unexpected moves on market.
Now let’s pass to weekly reseach…
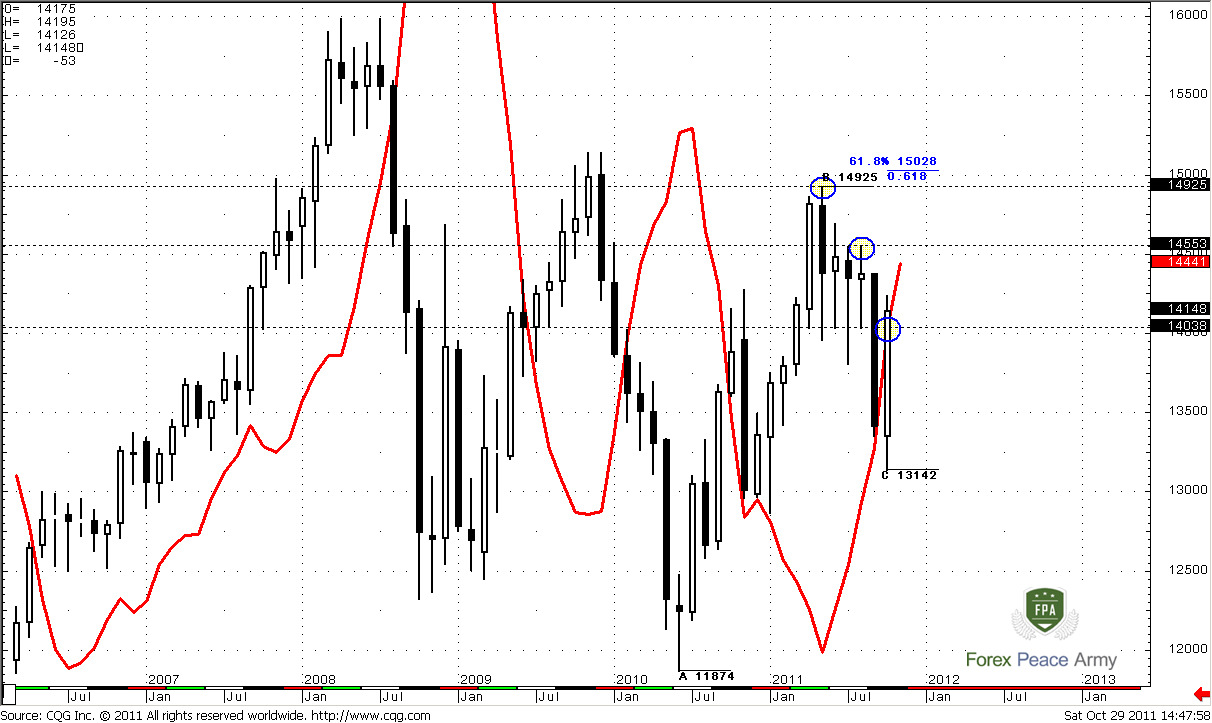
Monthly
On monthly chart we will continue to focus on possible stop grabber pattern that could be formed by market at the end of the month. This is in fact the most interesting thing that could happen in near term.
If October bar will close above 1.4038, then trend will remain bullish, and current trend shifting to bearish will be treated as failed. Can you imagine how many long-term traders will be locked in wrong positions? And how do you think, where they have place their stops? Right – the most probable area is above 1.4925 high. Here is the target of potential stop grabber pattern – 1.50 area. Still, I’ve found another one high around 1.4553 that also could become a potential target, especially if we will try to look at this from perspectives of our Dollar Index analysis. Anyway, even knowing in advance of 500+ pips move is not bad, right?
As we’ve said this pattern could tight our trading range. To enter with this pattern we will need only current white candle, since market should not close below its low. That allows us to trade on daily-weekly and place much tighter stops – now I’m speaking with long-term traders. Third advantage is you will know the overall direction – initially to 1.45 but may be event to 1.50. This will allow you to enter long on lower time frames without scare to catch deep pullback or drawdown. Other words you will know the direction and target of the market for 1-3 months ahead.
If this scenario will not happen, we will start to search another one, but currently I can’t find the reasons why this perspective could be unreal. It’s worthy to track monthly chart from that point of view. This pattern is also useful for us in perspective of its failure. Since we know what to watch for, we will be able to act accordingly, when and if we will see that this pattern has failed.
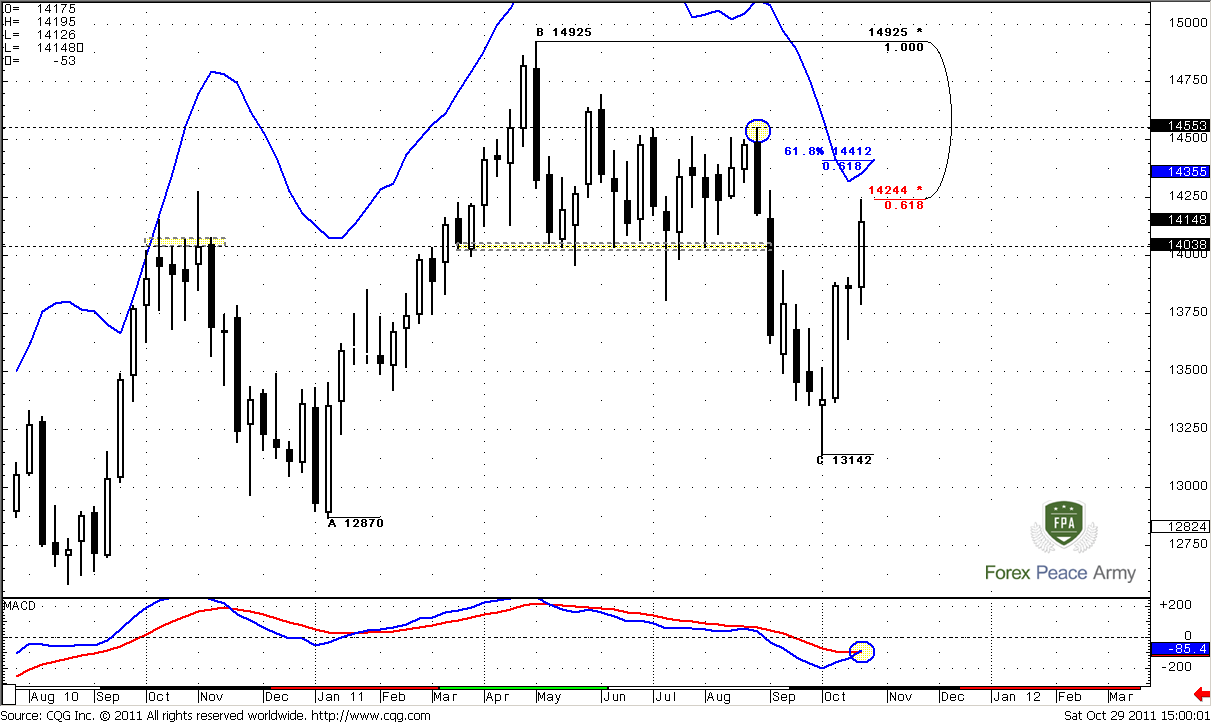
Weekly
Market has shown the real strength during past week. Although we’ve suggested that it should reach 1.4050-1.41 area and stop, since this is really strong resistance (see previous research), it has broken through it, changed trend to bullish and has reached last solid resistance level – 1.4244. Nearest target on weekly chart is 0.618 extension from AB-CD at 1.4412 and weekly overbought level.
Currently it is very difficult to say, based on weekly chart – will market show any retracement down or not, since we just can’t see it right here, but the one thing that we have to watch for is close by 31st of October. IT should be above 1.4038 to trigger stop grabber on monthly chart.
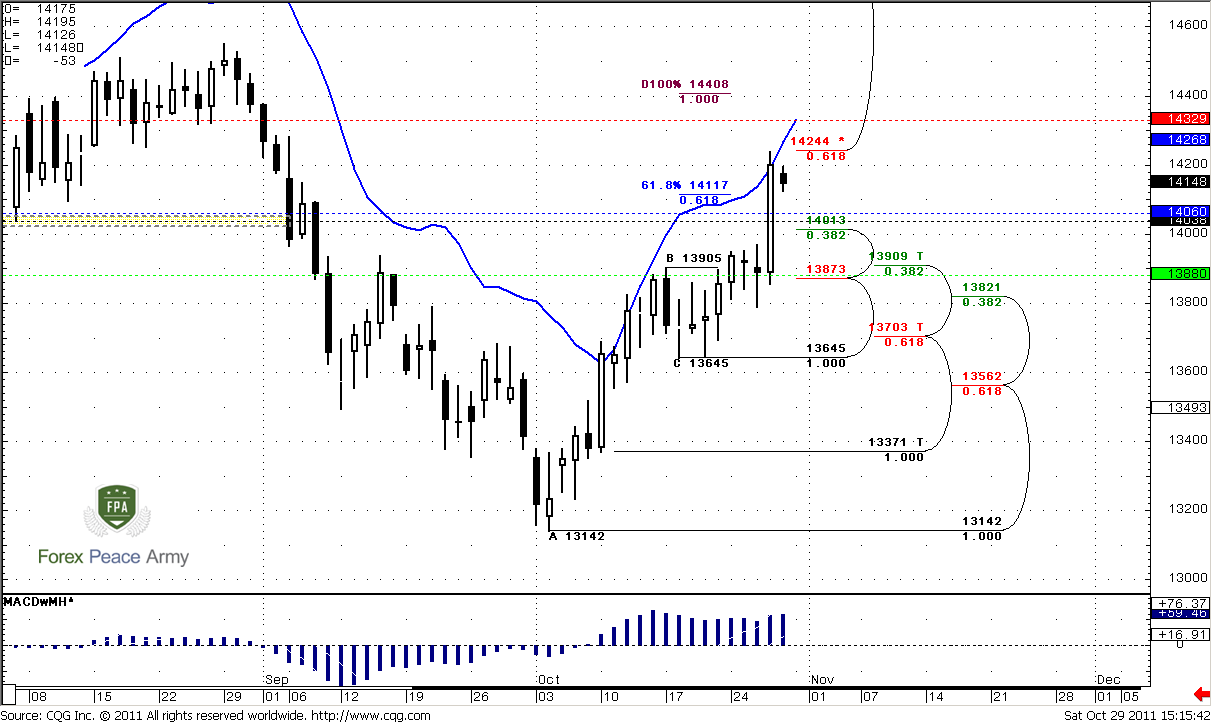
Daily
Trend is strongly bullish here, market is not at overbought. The one reason for retracement here is reaching of major 0.618 resistance and Agreement with 0.618 target. Price action on Friday was relatively shallow, so it’s difficult to add something. The area that we have to watch closely is 1.4038-1.4060. Preferably if market will hold above it, because this is weekly pivot point, Fib support, monthly trend breakeven point. Also, since market didn’t respect this area during up move, very often market returns back and retest such areas. This could happen, since this area stands in the same range.
Also I draw other support levels. Next strong support area is 1.3873-1.3909 K-support and weekly pivot support. Nearest resistance beyond 1.4244 level is 1.4330 – daily overbought and pivot resistance 1.
In general market shows strength and histogram confirms that momentum is solid. It tells that market should continue move up. The major question is – how deep retracement will be. Perfectly for upward bias is not deeper than 1.40, but 1.38-1.3850 is also acceptable.
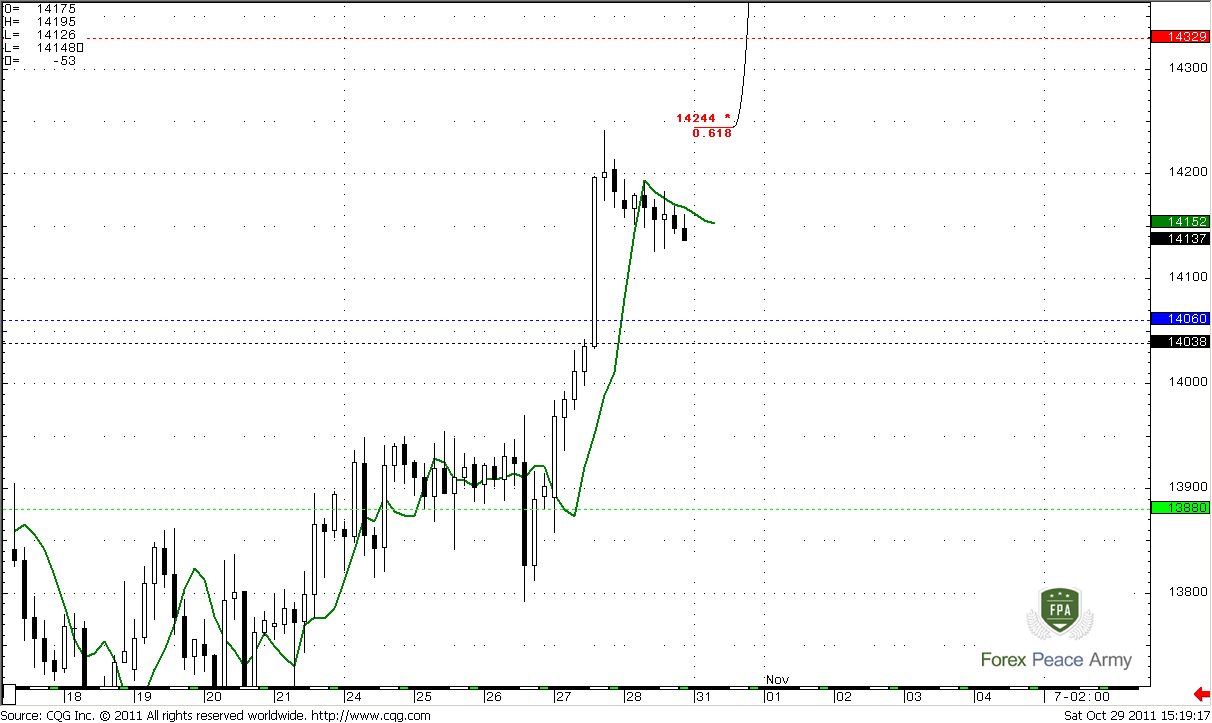
4-hour
Here is difficult to comment something. We need to wait some clear patterns though to speak about potential targets of retracement or about it at all. Currently I only see the potential context for DRPO LAL pattern or B&B– that’s all. May be, if market will form some AB-CD, or something, we can discuss it with more details during the week. Anyway – either it will be DRPO or B&B – we probably will see retracement to 1.4030-1.4060 area.
Conclusion:
If market will close on Monday above 1.4038 by futures quotes, we can count on continuation at least to 1.4550 or may be even to 1.50+ area.
In short term perspective, we need to see more price action to find some patterns on intraday chart that could help us determine level where we can reestablish longs. I hope that it will be 1.4030-1.4060 area by B&B or, may be some AB-CD on 4 hour chart – but currently it’s just an assumption.
In long-term performance we have to keep in mind unexpected reversal due fundamental factors that could be seen currently at Dollar Index. So, don’t be surprise, if we will see reversal on EUR from 1.45-1.50 area and long-term downtrend to 1.18 that could lasts 1-2 years.
The technical portion of Sive's analysis owes a great deal to Joe DiNapoli's methods, and uses a number of Joe's proprietary indicators. Please note that Sive's analysis is his own view of the market and is not endorsed by Joe DiNapoli or any related companies.
[/QUOTE]
previous week I’ve found some really special on Dollar Index on a long-term chart and decided to watch this stuff to you. From one point of you – this will be chart analysis and hence technical approach, but from another one – this is a quarterly chart that has solid fundamental basis that we also will discuss.
Here is quarterly Dollar Index chart:
For those who already familiar a bit with DiNapoli approach to markets and Gartley patterns – there is no need any comments. Let me to describe situation for others. Red line on the chart is DiNapoli MACD Predictor. It acts and shows the same signals as simple MACD but uses price chart instead of second line of MACD. Other words, MACDP is a derivative indicator from simple MACD. When price chart stands above red line – trend is bullish by MACD, when it stands below – bearish. But what we see near blue circle around 72.696? This is trend shifting failure and it has happened on quarterly chart. During QI market has tried to shift trend bearish, penetrated red line, but later returned right back and closed above it. The same on QII – market has opened below it but later has shown fast jump out. Now think what has happened with those long-term traders, who have opened shorts by this unconfirmed and as we now see failed signal? Right, they are trapped now in a wrong direction and very nervous since they want to out.
Speaking about technical foundation of this pattern – it has as failure point, when it should be treated as failed and target point. The failure point is a low of this “failure trend shifting”, aka “Stop grabber” pattern – C point at 72.696. The target point is nearest previous highs, where most stops has been placed – 88.708, but since these stops should be taken out – the more probable target is 91.600 area – target of larger AB-CD.
If you like Gartley’s patterns – here is also bullish one. Market has reached AB-CD bearish target right at 73.254 from initial swing up. This is “222” Buy.
You may ask why Dollar Index is so big deal for us. Here is why – let’s add EUR/USD chart:
Impressive right? A bit later there will be a chapter in our FPA School dedicated to Dollar Index, so you will know that this index has strong negative correlation with EUR, because EUR has 56% value in the overall index.
Conclusion is obvious. If pattern on Dollar Index will come true – we will see 1.18 on EUR in nearest 1-2 years or may be even faster.
Now is time to add some fundamentals… I suppose most of you have heard about Dollar Smile theory. The major idea is initially Dollar rises due risk aversion (how it has happened in 2008), then market fallen in recession so dollar value declines. When US economy is starting to creep out from recession, investors become hungry for risk and start to search higher return – demand for USD starts to grow. It looks like “smile”.
Let’s take a look from that perspective on Dollar index chart again:
Here we see this theory in action. First jump up in 2008 was a risk aversion (yellow rectangle). Later world economy has fallen in deep recession; rates were decreased all around the world (red rectangle). Then intermediate relief has come, but it has failed, because economy very rare shows V-shape of recovery. In general, this relief was also some kind of dollar smile – just unite first red and green rectangles and look at price action – you clearly can see the smile.
But later economy has turned in second leg of recession and creates a “W” shape that is more stable and quite common, so the real smile is just ready to start. At my humble opinion correct picture should look as follows:
If you make some home work and match this chart with official data on GDP, you’ll see that it supports this price action and theory.
What else could we add? The last thing that I want to show you is our regression model on 2 year-10 year US Treasuries spread. It shows significant decrease in spread in nearest 4 quarters. We already see data improving in economy. Still, current situation in economy is a bit slips out of theoretical. And the reason is growing inflation. Fed has no choice. Although growth does not get enough pace to trigger rate hike, inflation has grown significantly, and Fed will be forced to be hawkish in nearest year. Usually inflation starts to grow after the moment when economy gets significant upward momentum. Growth phase consists of two parts – disinflationary growth and inflationary growth. But due to multiple QE programs there are a lot of liquidity was spring in the markets and inflation is not late in coming. Currently Fed in such situation when it has to rates despite that economy is weak, or, say not strong enough.
Our model is based on NFP and GDP numbers and it shows possible solid reducing in 2-10 year spread. Spread is a difference between 10 year and 2-year rates. In general, it means that 2-year rate should rise significantly and almost become an equal to 10-year rate. That is possible in 2 cases. First is US default, second is rate hiking. First scenario seems as less probable.
Probably we should keep in mind all this stuff and not be surprised when we hear the first bell of this and see some unexpected moves on market.
Now let’s pass to weekly reseach…
Monthly
On monthly chart we will continue to focus on possible stop grabber pattern that could be formed by market at the end of the month. This is in fact the most interesting thing that could happen in near term.
If October bar will close above 1.4038, then trend will remain bullish, and current trend shifting to bearish will be treated as failed. Can you imagine how many long-term traders will be locked in wrong positions? And how do you think, where they have place their stops? Right – the most probable area is above 1.4925 high. Here is the target of potential stop grabber pattern – 1.50 area. Still, I’ve found another one high around 1.4553 that also could become a potential target, especially if we will try to look at this from perspectives of our Dollar Index analysis. Anyway, even knowing in advance of 500+ pips move is not bad, right?
As we’ve said this pattern could tight our trading range. To enter with this pattern we will need only current white candle, since market should not close below its low. That allows us to trade on daily-weekly and place much tighter stops – now I’m speaking with long-term traders. Third advantage is you will know the overall direction – initially to 1.45 but may be event to 1.50. This will allow you to enter long on lower time frames without scare to catch deep pullback or drawdown. Other words you will know the direction and target of the market for 1-3 months ahead.
If this scenario will not happen, we will start to search another one, but currently I can’t find the reasons why this perspective could be unreal. It’s worthy to track monthly chart from that point of view. This pattern is also useful for us in perspective of its failure. Since we know what to watch for, we will be able to act accordingly, when and if we will see that this pattern has failed.
Weekly
Market has shown the real strength during past week. Although we’ve suggested that it should reach 1.4050-1.41 area and stop, since this is really strong resistance (see previous research), it has broken through it, changed trend to bullish and has reached last solid resistance level – 1.4244. Nearest target on weekly chart is 0.618 extension from AB-CD at 1.4412 and weekly overbought level.
Currently it is very difficult to say, based on weekly chart – will market show any retracement down or not, since we just can’t see it right here, but the one thing that we have to watch for is close by 31st of October. IT should be above 1.4038 to trigger stop grabber on monthly chart.
Daily
Trend is strongly bullish here, market is not at overbought. The one reason for retracement here is reaching of major 0.618 resistance and Agreement with 0.618 target. Price action on Friday was relatively shallow, so it’s difficult to add something. The area that we have to watch closely is 1.4038-1.4060. Preferably if market will hold above it, because this is weekly pivot point, Fib support, monthly trend breakeven point. Also, since market didn’t respect this area during up move, very often market returns back and retest such areas. This could happen, since this area stands in the same range.
Also I draw other support levels. Next strong support area is 1.3873-1.3909 K-support and weekly pivot support. Nearest resistance beyond 1.4244 level is 1.4330 – daily overbought and pivot resistance 1.
In general market shows strength and histogram confirms that momentum is solid. It tells that market should continue move up. The major question is – how deep retracement will be. Perfectly for upward bias is not deeper than 1.40, but 1.38-1.3850 is also acceptable.
4-hour
Here is difficult to comment something. We need to wait some clear patterns though to speak about potential targets of retracement or about it at all. Currently I only see the potential context for DRPO LAL pattern or B&B– that’s all. May be, if market will form some AB-CD, or something, we can discuss it with more details during the week. Anyway – either it will be DRPO or B&B – we probably will see retracement to 1.4030-1.4060 area.
Conclusion:
If market will close on Monday above 1.4038 by futures quotes, we can count on continuation at least to 1.4550 or may be even to 1.50+ area.
In short term perspective, we need to see more price action to find some patterns on intraday chart that could help us determine level where we can reestablish longs. I hope that it will be 1.4030-1.4060 area by B&B or, may be some AB-CD on 4 hour chart – but currently it’s just an assumption.
In long-term performance we have to keep in mind unexpected reversal due fundamental factors that could be seen currently at Dollar Index. So, don’t be surprise, if we will see reversal on EUR from 1.45-1.50 area and long-term downtrend to 1.18 that could lasts 1-2 years.
The technical portion of Sive's analysis owes a great deal to Joe DiNapoli's methods, and uses a number of Joe's proprietary indicators. Please note that Sive's analysis is his own view of the market and is not endorsed by Joe DiNapoli or any related companies.
[/QUOTE]